Prepared by Melissa Griffin and David F. Zierden.
Florida Climate Center
The Florida State University
Tallahassee, FL

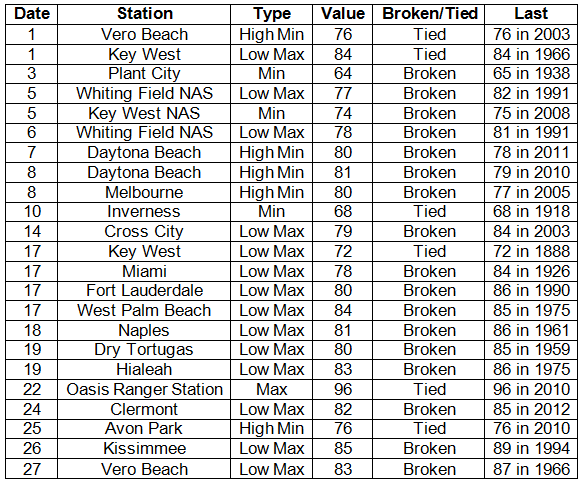
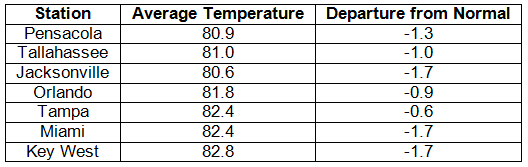
Average temperatures varied across the state in July. Average temperatures were below normal during July across the entire state (Table 1 and Appendix 1). Departures from normal ranged from -0.1˚F in St. Petersburg to -2.6˚F in Fort Lauderdale. These below normal average temperatures are a bit deceiving without looking at both the maximum and minimum temperatures for the month. Most stations across the state reported lower than normal maximum temperatures and higher than normal minimum temperatures. For example, maximum temperatures for July 2013 were the coolest on record in Federal Point, the 3rd coolest at Pensacola, 4th coolest in Miami, and 8th coolest in Key West; while the minimum temperatures were the 3rd warmest at Moore Have Lock, 4th warmest in St. Petersburg, 10th warmest at Daytona Beach. There were a number of low maximum and high minimum temperatures tied and broken during July (Appendix 2).
Table 1: July average temperatures and departures from normal (°F) for selected cities.
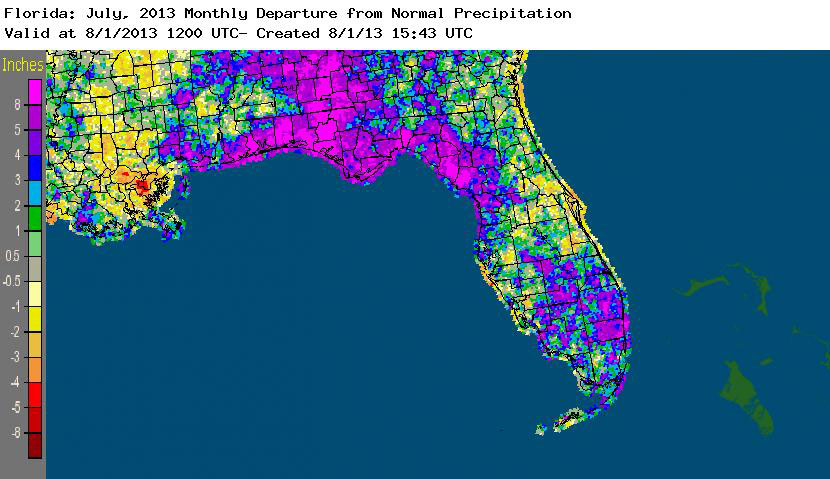
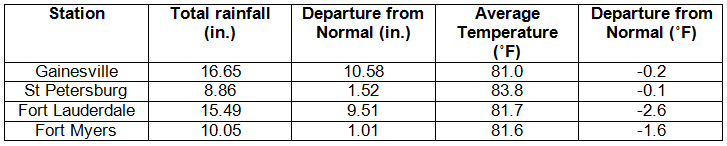
Rainfall totals varied across the state in July. Rainfall totals across the state varied in July, though most of the state reported above normal precipitation for the month (Table 2). Portions of the Big Bend, Panhandle and southern Florida recorded up to 8 inches above normal precipitation while portions along the east coast from Jacksonville to Titusville and inland from the Orlando to the west coast between 1 to 3 inches below normal rainfall (Figure 1). The unusual rainfall pattern during the month has impacted agricultural producers with diseases, standing water and decaying crops to causing a forced release of the high water in Lake Okeechobee to keep the lake at a level that can be managed in the event of any tropical storm/hurricane impacts later in the season. July 2013 was the wettest on record in Gainesville, 3rd wettest in Pensacola, 5th wettest in Miami and 9th wettest in Tallahassee. Numerous 24-hour precipitation records were broken for the month, with one record that dated back to 1890 (Table 3).
Table 2: July precipitation totals and departures from normal (inches) for selected cities.
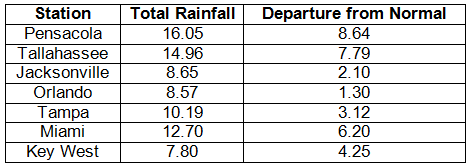
Table 3: Select daily rainfall records (inches) broken during July (compiled from NOAA, NWS).
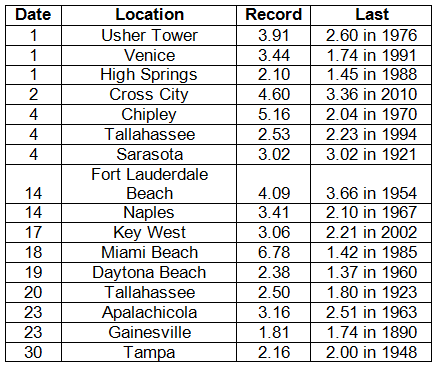
Figure 1: A graphical depiction of the monthly rainfall departure from normal (inches) for July is given in the figure below (courtesy of NOAA, NWS).
ENSO-neutral conditions continue in the Pacific. As of July 29th, neutral ENSO conditions continue to be reported for the equatorial Pacific. Equatorial sea surface temperatures (SST) are near average across the western and central Pacific Ocean and below average in the eastern Pacific. ENSO-neutral conditions are favored to continue through the summer and into the fall of 2013. The Climate Prediction Center (CPC) predicts above normal temperatures for the state and they are also predicting above normal precipitation for the entire state and normal temperatures through October.
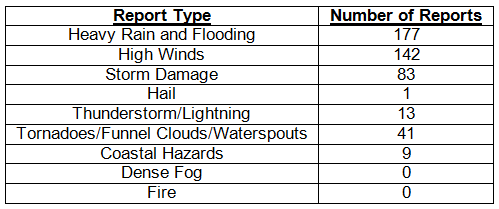
Hazardous weather events in July. Over 450 storm reports were submitted during the month of July, with the majority of those reports categorized with heavy rain, flooding or high winds. The month started off with nearly 199 of the total 450 reports coming from July 1st – July 5th; 77 of the severe weather reports were on the 4th of July. Heavy rains and related flooding were seen in many portions of the Panhandle, Big Bend and southern Florida and numerous reports of high winds were scattered across the state. Tornadoes touched down in Oldsmar and Bradenton on the 9th and 10th, causing damage to homes, and 3 people were injured when a waterspout moved onshore near Sea Ranch Lakes on the 19th. Over the course of the month, 4 people were injured from lightning strikes in Pace, Cooper City and Fort Lauderdale; 6 people died and more than 50 people were rescued along Florida beaches due to dangerous rip currents.
Table 4: Breakdown of storm reports submitted in Florida during the month of July (compiled from Southeast Regional Climate Center).
Agricultural and other climate related impacts. Topsoil and subsoil levels were adequate at the beginning of the month, with reports from some portions of the state having a surplus at both levels. Farmers in the Panhandle finished up planting soybeans, while others replanted cotton and peanut fields. Heavy rains kept growers in Dixie County from having a second hay cutting. In south Florida, grapefruits and late oranges seasons came to a close and producers began preparing fields for fall/winter vegetables. All areas reported heavy spraying and Psyllid control. The heavy rains brought soil (top and sub) moisture levels up, with over 20% reporting a surplus. The threat of disease to crops had increased due to standing water across the state. Okaloosa County reported peanut acreage lost due to the heavy rains. Rain caused watermelons to burst in Gulf County. Growers began concentrating on next year’s citrus crop. Toward the end of the month, soil moisture surplus levels were at 40%. Haying was delayed due to the heavy rains, and white mold was present in peanuts in a few Panhandle counties. Preparing for the fall planting season continued but was hindered in some locations because of standing water. Peanuts also showed signs of yellowing in Washington County, while Bradford and Seminole counties reported loss of hay sitting in wet fields waiting to be baled. Cattle conditions across the state during the state were good to excellent, though forage was limited due to flooding and disease.
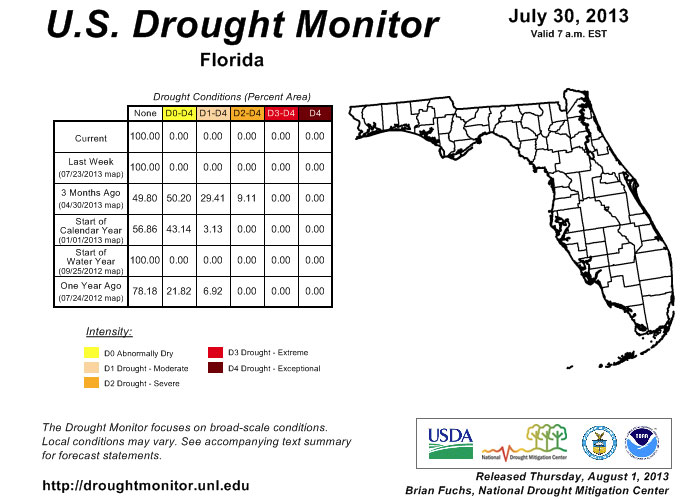
The dry conditions that had lingered in the Panhandle at the beginning of July were completely removed after an unusual atmospheric weather pattern allowed for an extremely moist flow over the state. Rainfall totals for the month (Table 2 and Figure 1) were well above normal across Florida, wiping out all the remaining traces of drought conditions in the state. With all of the rain, interests have shifted from a drought focus, to inland flooding as many rivers in the state are near flood stage. The current wet pattern is forecasted to hold through October, which should keep any drought conditions that appear localized and not severe.
Figure 2: Drought conditions in Florida as of July 30, 2013 (courtesy of U.S. Drought Monitor).
Appendix 1: Additional July departures from normal data for Florida locations.
Appendix 2: Select daily maximum and minimum temperature records (° F) tied or broken during July (compiled from NOAA, NWS).