Prepared by Melissa Griffin and David F. Zierden
Florida Climate Center
The Florida State University
Tallahassee, FL

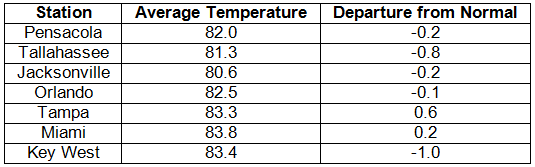
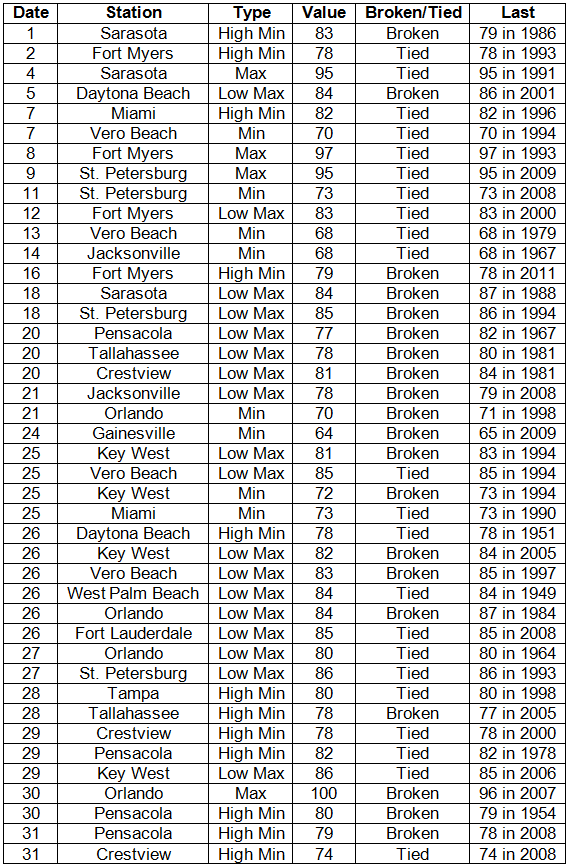
Average temperatures varied across the state in August. Average temperatures were below normal to above normal for August across the entire state (Table 1 and Appendix 1). Departures from normal ranged from -1.0˚F at Key West to 0.6˚F in Tampa. The average maximum temperatures at most reporting stations were cooler than normal in August, while the recorded average minimum temperatures were above normal. Only 4 record highs were broken in August, though the month saw numerous records tied or broken (Appendix 2), with the majority of those being from low maximum or high minimum temperatures.
Table 1: August average temperatures and departures from normal (° F) for selected cities.
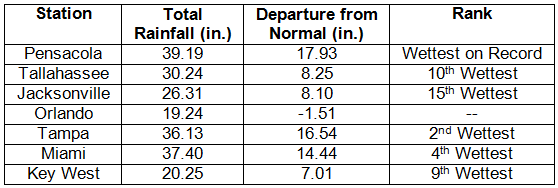
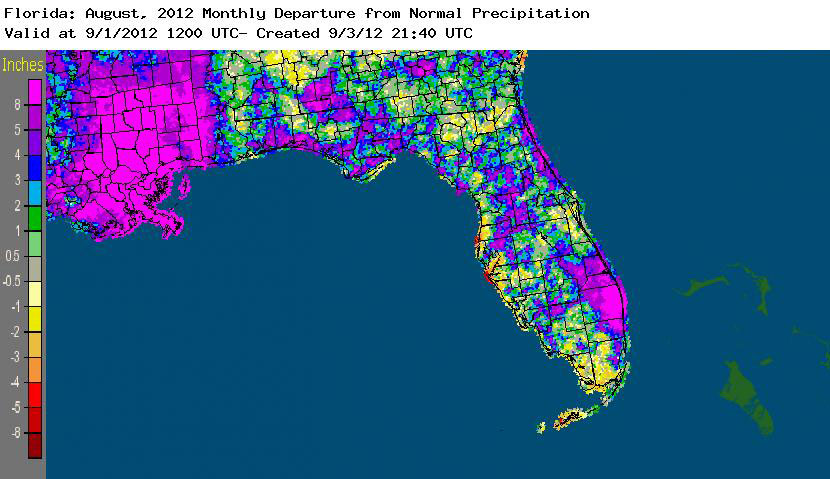
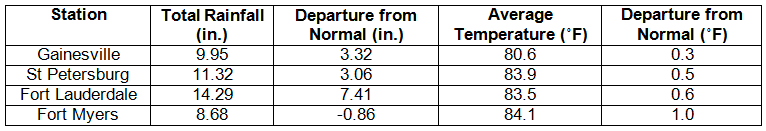
Rainfall totals varied across the state in August. Rainfall totals across the state varied in August (Table 2), though most of Florida saw above normal precipitation for the month. Areal patterns of monthly rainfall relative to normal are depicted in Figure 1 and show how areas around Tarpon Springs (near the Hillsborough and Pasco County line), Anna Maria Key (Manatee County), and the Keys were below normal, while portions of the Emerald Coast, First Coast, and Gold Coast saw above normal rainfall totals. At the end of the month, Tropical Storm Isaac brought torrential rainfall to parts of the state, breaking many 24-hour records in southern Florida (Table 3). August 2012 was the wettest on record at Niceville and West Palm Beach, the 4th wettest on record in Miami and Fort Lauderdale (Appendix 1), the 7th wettest on record in Pensacola, and the 9th wettest on record in Tallahassee. The summer as a whole proved to be extremely wet for numerous locations (Appendix 3).
Table 2: August precipitation totals and departures from normal (inches) for selected cities.
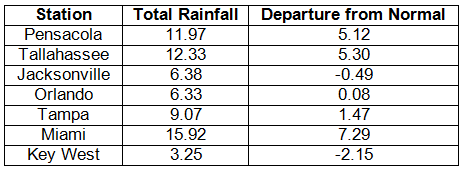
Table 3: Select daily rainfall records (inches) broken during August (compiled from NOAA, NWS).
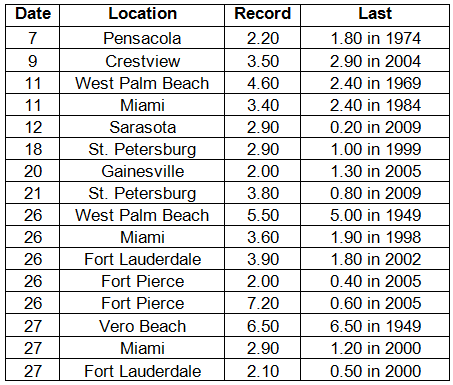
Figure 1: A graphical depiction of the monthly rainfall departure from normal (inches) for August is given in the figure below (courtesy of NOAA, NWS).
ENSO-neutral conditions continue in the Pacific. Neutral ENSO conditions continue to be reported for the equatorial Pacific. Equatorial sea surface temperatures (SST) are greater than 0.5˚C above average across the eastern Pacific Ocean. The chances have increased for El Niño to begin September 2012 and continue through the winter of 2012-2013. The Climate Prediction Center (CPC) predicts normal temperatures for the state and above normal precipitation in the western Panhandle through November.
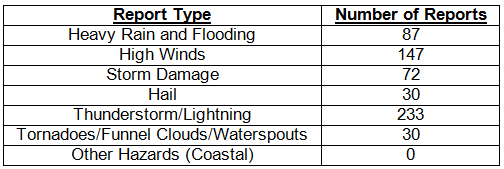
Hazardous weather events in August. August was a fairly active month for hazardous weather across the state.
Table 4: Breakdown of storm reports submitted in Florida during the month of August. (Compiled from Southeast Regional Climate Center.)
Tropical Storm Isaac
Tropical Storm Isaac passed just to the west of the Florida Keys before making landfall as a hurricane near Port Fourchon, LA, during the early morning hours of August 29. While Isaac never directly hit Florida, the size of the storm caused the impacts to be felt over a widespread area, affecting a large portion of the state. Here are just some of the impacts felt here in Florida during the storm:
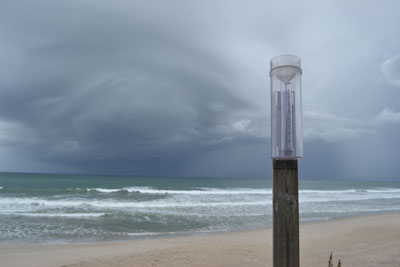
View from Brevard County prior to Isaac’s passage. Credit: FL-BV-11.
Tornadoes/Waterspouts
EF-0 tornados were reported in both Jackson (near Greenwood) and Holmes (Graceville) counties in the Panhandle. The Jackson County tornado touched down in a rural area and did little damage, while the tornado near Graceville uprooted some trees and tore a porch off a mobile home. Another EF-0 tornado touched down near Vero Beach (Indian River County) on the 27th and impacted the Vero Palm Estates Countryside Mobile Home Park. A waterspout moved ashore from Tampa Bay and damaged 6 residences on Maple Ave near 22nd Street in Tampa.
Storm Surge
The storm surge associated with Isaac ranged from a little over a foot to about 3.5 feet. However, once that is combined with the tide (which ranged from 2 to 4 feet), many areas saw coastal inundation with the surge. There was minor flooding in Saint Marks, FL (Wakulla County), and Water Street in Apalachicola (Franklin County) was under water. Saint George Island State Park reported surf passing the dune line and flooding the parking areas. Surf heights at the park were estimated between 6 and 8 feet and caused moderate beach erosion. St. Joe State Park (Gulf County) was closed due to water inundation, and some roads near downtown Panama City (Bay County) and West Bay were under water. Along Panama City Beach, moderate beach erosion was reported with surf estimated between 8 and 10 feet. Areas to the west of Panama City Beach also experienced high surf conditions and moderate erosion, along with strong rip currents. Most of the beaches along northwest Florida were closed prior to Labor Day Weekend.
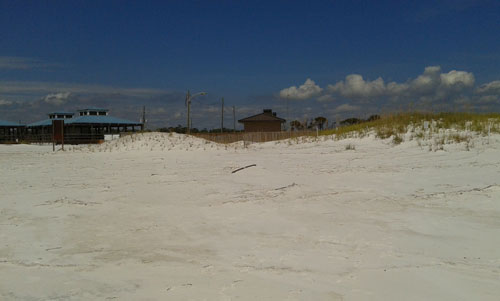
Damaged dunes along Okaloosa Island.
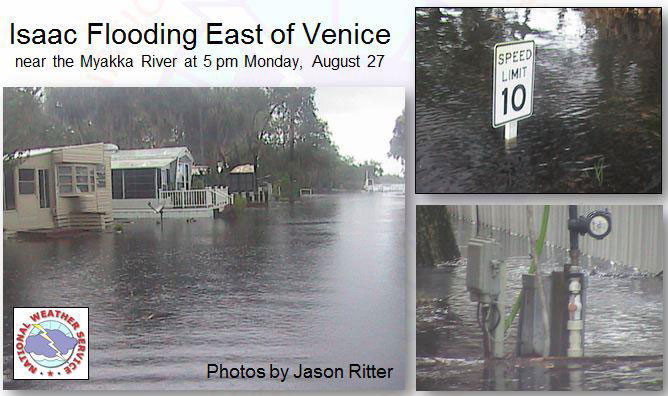
Surge also affected parts of coastal Levy, Pinellas, Lee, Hillsborough and Manatee counties, and there was flooding along the Hillsborough River during high tide. The high surge, in combination with the rainfall, led to flooding in East Venice (Sarasota County) near the Myakka River.
In South Florida, moderate to locally heavy beach erosion was reported along all south Florida beaches. The southern coast of Collier County had the highest surge in the south part of the state, with about 3 feet estimated from Marco Island to Everglades City, which caused some minor coastal flooding issues in low lying areas.
Rainfall/Flooding
Portions of Highlands and Polk counties received 4.00-6.00” of rain, and numerous reports of 4.00” rainfall came out of Pasco County. US 98, south of Sebring, was closed on the 27th due to standing water on the road. Central and southwest Florida saw 0.50”-4.00”, while the Panhandle and Big Bend regions reported 2.00”-5.00” from Isaac.
Southeast Florida took the brunt of the rainfall from Isaac with observed two-day rainfall totals from the area ranging between 3.00-16.00”. Significant flooding was reported in the metro area of Broward County (Lauderhill, Tamarac and Coral Springs). Roadways were mainly impacted, though some homes and businesses had water damage. Southwest metro area also had flooding issues, but not as bad as northern parts. Severe flooding was reported in large parts of metro Palm Beach County. The hardest hit area was from the Florida Turnpike to Boca Raton, with measured rainfall at 10.00-16.00”, though radar estimates were up to 20.00”. Wellington, Royal Palm Beach, and Loxahatchee suffered the worst of the flooding, with entire neighborhoods isolated by several feet of water and over topped canals.
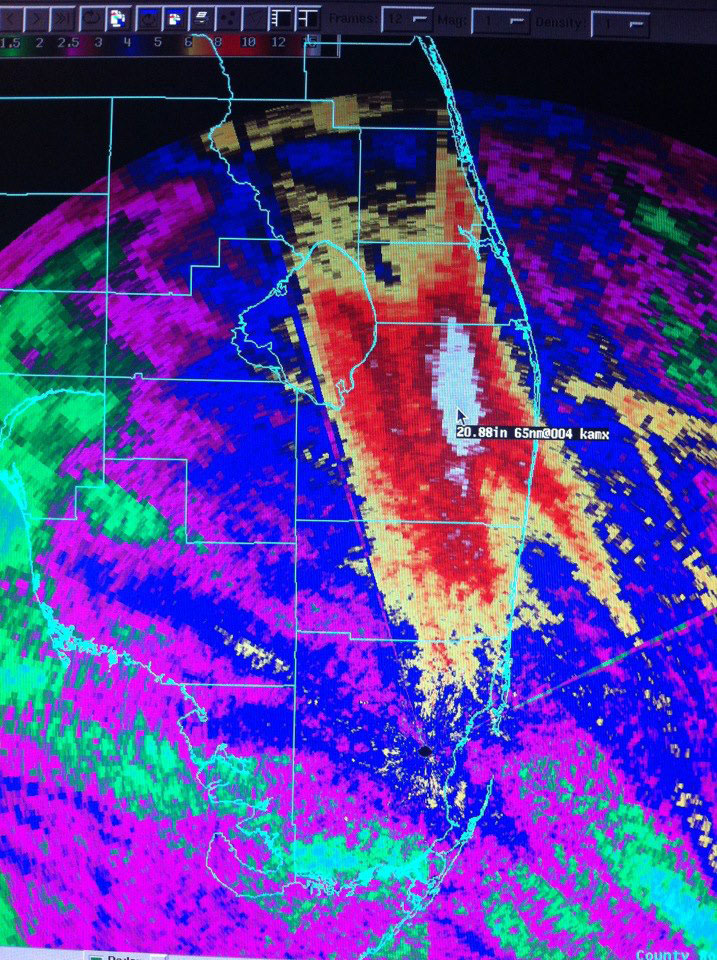
Radar estimates of rainfall over south Florida. Credit: NWS Miami.
The National Hurricane Center will release its final report on Isaac (along with rest of the tropical storms/hurricanes that have impacted the United States) at the end of the 2012 Atlantic hurricane season.
Agricultural and other climate-related impacts. Levy and Gilchrist counties started to harvest peanuts at the beginning of August. Washington County saw a flurry of activity as corn, peanuts and soybeans were being harvested, while corn was picked in Madison County. Vegetable growers increased the pace of land preparation, fumigating and laying plastic for fall crops. Citrus fertilizer and grove maintenance continued. Statewide, most of the pasturelands had improved due to the frequent rainfall, though some issues with lingering drought, disease and insects had been reported. By the middle of the month, the frequent rains were causing a variety of issues in northern parts of the state. Rain caused harvesting and disease problems in Gulf (peanuts), Jefferson (peanuts) and Washington (peanuts and cotton) counties. Some pastures (Okaloosa and Jefferson counties) reported diseases. The sugarcane crop (Glades County) looked good, and preparations (Collier, Lee, Hendry, Glades and Charlotte counties) for fall vegetables continued. Rain continued to hinder harvesting operations in the northern part of the state toward the end of the month. In Washington County, rust on soybeans, white mold in peanuts and leaf spot in cotton were reported. Hillsborough County began preparations for strawberries. Cattle conditions across the state ranged from very poor to excellent, with most reporting fair to excellent, though pasture conditions in some areas were limited due to drought, disease and flooding depending on location. At the end of August, white mold (peanuts) was reported in Jackson, Jefferson and Santa Rosa counties. Cypress and wetlands saw water levels rise in many low areas. Gulf, Flagler, and Putnam counties halted hay harvesting due to the daily rains. Vegetable growers in southwestern counties were using throw-out pumps to control high water levels. Tropical Storm Isaac caused wide spread rain and flooding crop related issues across the state, though the rains did improve pasture conditions in some areas.
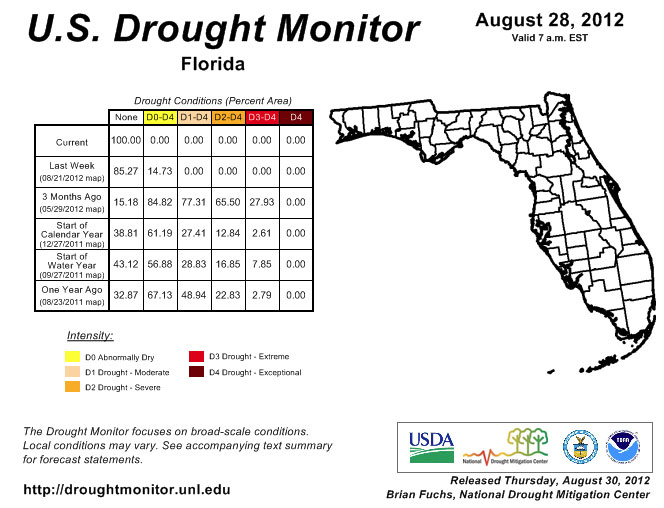
The frequent rains during the early part of August helped ease the lingering drought conditions across the state. Prior to Tropical Storm Isaac’s impact, all of the dry conditions (D0) across the Panhandle and in northeastern Florida had been alleviated by above normal summer-time rains. An area of D0 expanded from Monroe and Collier counties across areas close to the Everglades and Lake Okeechobee to portions of the East Coast. The water level of Lake Okeechobee around this time was just above 12 feet. Torrential rains from Tropical Storm Isaac brought much needed, and in some cases too much, rainfall to portions of south Florida. The rains wiped out what remaining dryness had been in the state, and as of the August 28th release of the Drought Monitor, the state was drought-free for the first time since May 2010. The September 4th water level reported at Lake Okeechobee had risen to 14.24 feet, which is still below normal for this time of year.
Figure 2: Drought conditions in Florida as of August 28, 2012 (courtesy of U.S. Drought Monitor).
Appendix 1: Additional August departures from normal data for Florida locations.
Appendix 2: Select daily maximum and minimum temperature records (° F) tied or broken during August (compiled from NOAA, NWS).
Appendix 3: June - August precipitation departures from normal data for Florida locations