The Florida Climate Center serves as the primary resource for climate data, information, and services in the state of Florida.
What's new in our world?
The Florida Climate Center achieves its mission by providing climate monitoring, research, and expertise to be applied by the people, institutions, and businesses of Florida and the surrounding region.
We provide direct service by fulfilling requests for climate and weather data and information in a variety of formats.
We perform research that advances the understanding of the climate variability and changes of Florida and the surrounding region.
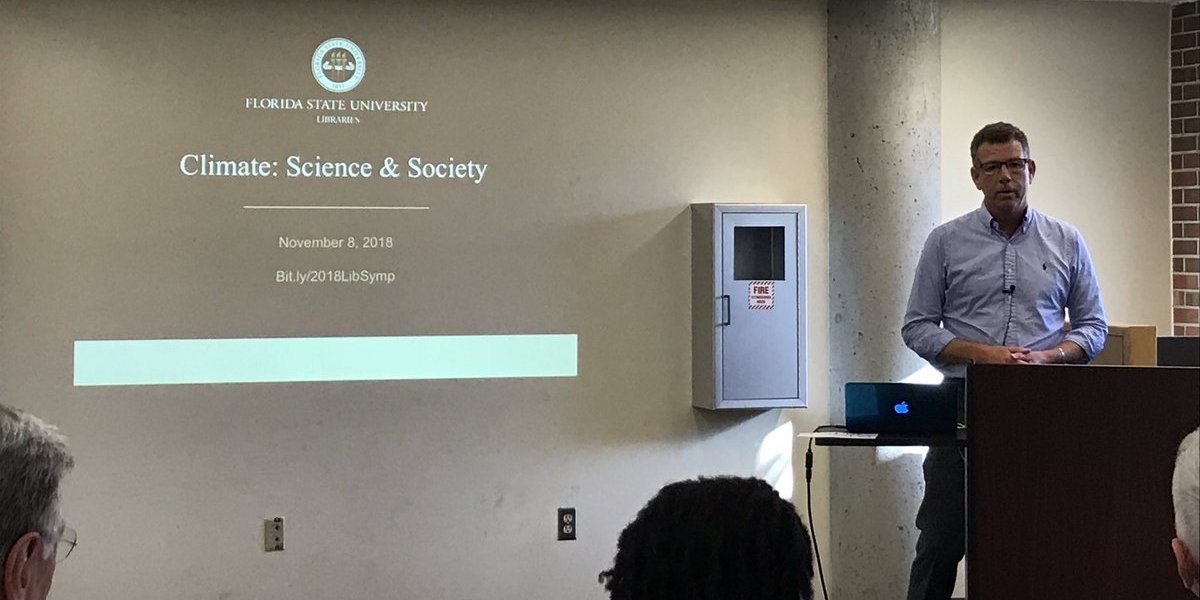
We provide outreach in presentations and at events aimed at a variety of groups, interests, and ages.
[OK]
[OK]
How does the thickness of a cloud change the way it looks from the satellite?
Here is a visible image where the satellite radiometer collected reflected energy from the visible part of the electromagnetic spectrum, or 0.6 microns. A piece of this image has been extracted and appears as a square below the larger satellite image. This portion of the image contains a cloud and some clear sky areas. You can change the appearance of this extracted image by changing the cloud thickness or the surface characteristics. You do this by moving the sliding scales (scroll bars) accompanying the picture on the right.
- Use the vertical slider to the right of the picture to adjust the thickness of the cloud and its effective brightness.
- Use the horizontal slider to modify the surface characteristics and note the resulting contrast between the cloud and the different surfaces.
This educational applet was developed by Tom Whittaker and Steve Ackerman of the Department of Atmospheric and Oceanic Sciences and the Space Science and Engineering Center at the University of Wisconsin-Madison.
This activity demonstrates some of the physics involved in hitting a baseball.
This applet is Copyright © 2011 by the American Meteorological Society.
This applet was developed by Ira Geer (AMS), Robert Weinbeck (AMS), and Tom Whittaker (University of Wisconsin-Madison).
Why are there Moon "phases"?
This is a model of the view from space. The relative sizes and distances are not in proportion to reality, nor is the tilt of the Moon's orbital plane when shown in the oblique view.
Explore just how much of the Moon is always in darkness -- for each position of the Moon in its orbit (shown by the light gray circle), click (or tap) on the Moon to move the terminator (the line between the illuminated part and dark part) until you think it is in the correct position. Then click "Check My Answer" button.
You can change the view point at any time by clicking on the "Show Oblique View" (or "Show Top View") button.
When you click "Check My Answer", if you get it right you will be encouraged to move the Moon to a different position in its orbit, or, you will be instructed to try again to position the terminator correctly.
Upon demonstrating several first attempt correct answers you'll advance to another level to explore the view of the Moon as seen from Earth.
(In the initial views, the Earth is shown in the approximate position during Winter, with the Northern Hemisphere tilted toward the Sun.)
This applet is Copyright © 2012 by Tom Whittaker.
Images courtsey of NASA.


