


Prepared by Florida Climate Center
The Florida State University
Tallahassee, FL

Key Points:
- Average monthly temperatures in October ended up near normal, with periods of much above and much below normal during the month.
- Monthly precipitation totals in October were below normal across the state.
- Drought rapidly worsened by the end of the month in the western Panhandle following about two weeks of no rainfall, while extreme drought persisted and expanded in west-central coastal areas.
- El Niño is expected to persist through winter, with an 80% chance of continuing in spring (March-May 2024); chances of a strong event have increased to 75%-85%.
Average monthly temperatures in October were near average despite temperature swings throughout the month. Average temperature departures from normal ranged from -0.8 ̊F in Jacksonville to +1.9 ̊F in Miami for the month (see Table 1 and Appendix 1 for select cities). October saw wide temperature swings throughout the month, beginning and ending with above normal temperatures. However, mid-month saw below normal temperatures across the state by as much as 12 ̊F or 13 ̊F below normal. No monthly average temperature records were tied or broken in October. More daily high minimum temperature records were broken than high maximum temperatures during the month. Select daily high minimum temperature records tied or broken during the month are provided in Appendix 2.
Table 1. October average temperatures and departures from normal ( ̊F) for selected cities.
| Station | Mean Temperature | Departure from Normal |
| Pensacola | 71.0 | -0.3 |
| Tallahassee | 70.5 | +0.2 |
| Jacksonville | 70.4 | -0.8 |
| Orlando | 76.0 | +0.5 |
| Tampa | 77.5 | +0.1 |
| Miami | 82.0 | +1.9 |
| Key West | 82.3 | +1.0 |
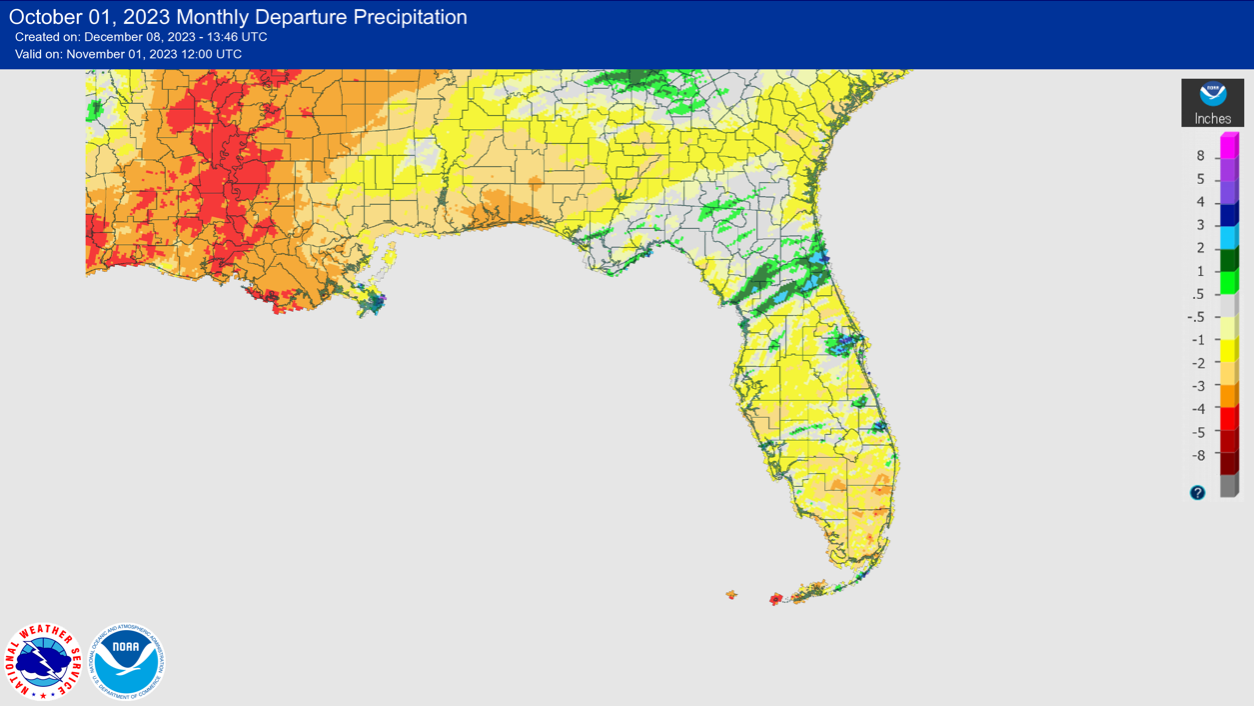
Monthly rainfall totals in October were generally below normal across the state. The monthly precipitation departures from normal ranged from -3.26 inches in Pensacola to +1.05 inches in Gainesville (see Table 2 and Appendix 1 for select locations). All of north Florida and the Panhandle have not recorded any rainfall since mid-October and drought conditions deteriorated by month’s end across the western Panhandle and Tampa Bay regions (see below). Locations along coastal southwest Florida continue to see their driest year-to-date on record, including Naples, Sarasota, Venice, and Tarpon Springs. A pattern shift toward wetter conditions is expected around mid-November, but a dry pattern set in by late October without any tropical activity.
Table 2. October precipitation totals and departures from normal (inches) for selected cities.
| Station | Total Rainfall | Departure from Normal |
| Pensacola | 1.44 | -3.26 |
| Tallahassee | 2.99 | -0.25 |
| Jacksonville | 2.65 | -1.38 |
| Orlando | 2.07 | -1.39 |
| Tampa | 0.38 | -1.96 |
| Miami | 5.78 | -1.87 |
| Key West | 4.19 | -1.48 |
Figure 1. A graphical depiction of the monthly rainfall departure from normal (inches) for October (courtesy of NOAA, NWS).
El Niño Advisory.
El Niño conditions, the warm phase of the El Niño Southern Oscillation climate pattern in the tropical equatorial Pacific Ocean, continued in October. El Niño is expected to persist through the Northern Hemisphere winter 2023-24, with an 80% chance of continuing in spring (March-May 2024). Chances of a strong El Niño event have increased to a 75-85% chance. El Niño events favor wetter and cooler than normal winters in Florida. However, El Niño rainfall is late this year with drying conditions observed in recent weeks across much of the state.
Hazardous Weather Events in October.
According to the Local Storm Reports issued by the local National Weather Service offices serving Florida, there were 138 individual local reports of hazardous weather events recorded across the state during the month of October (see Table 4 for a breakdown by event type). At the beginning of the month, heavy rainfall led to flooding of roadways in Brevard County, and high tide flooding was reported in Duval, Broward, and Nassau Counties on the 1st. An EF2 tornado was reported in Flagler County on the 12th, which caused substantial damage to several houses but no injuries or fatalities were reported.
Table 3. Breakdown of storm reports submitted in Florida during the month of October (compiled from Iowa State University/Iowa Environmental Mesonet).
| Report Type | Number of Reports |
| Heavy Rain | 36 |
| Flood | 6 |
| Flash Flood | 0 |
| Coastal Flood | 7 |
| Hail | 0 |
| Non-Thunderstorm Wind Gust | 25 |
| Non-Thunderstorm Wind Damage | 0 |
| Tornado/Waterspout/Funnel Cloud | 7/12/6 |
| Thunderstorm Wind Damage | 12 |
| Thunderstorm Wind Gust | 26 |
| Dense Fog | 1 |
Daily Record Events in October.
Table 4. Summary of daily records broken or set in Florida in October (source: NCEI Daily Weather Records).
| Category | Number of Records |
| Highest daily max. temp. | 13 |
| Highest daily min. temp. | 51 |
| Lowest daily max. temp. | 31 |
| Lowest daily min. temp. | 11 |
| Highest daily precipitation | 23 |
| Total | 129 |
Weather/Climate Highlight of the Month: Drought Development.
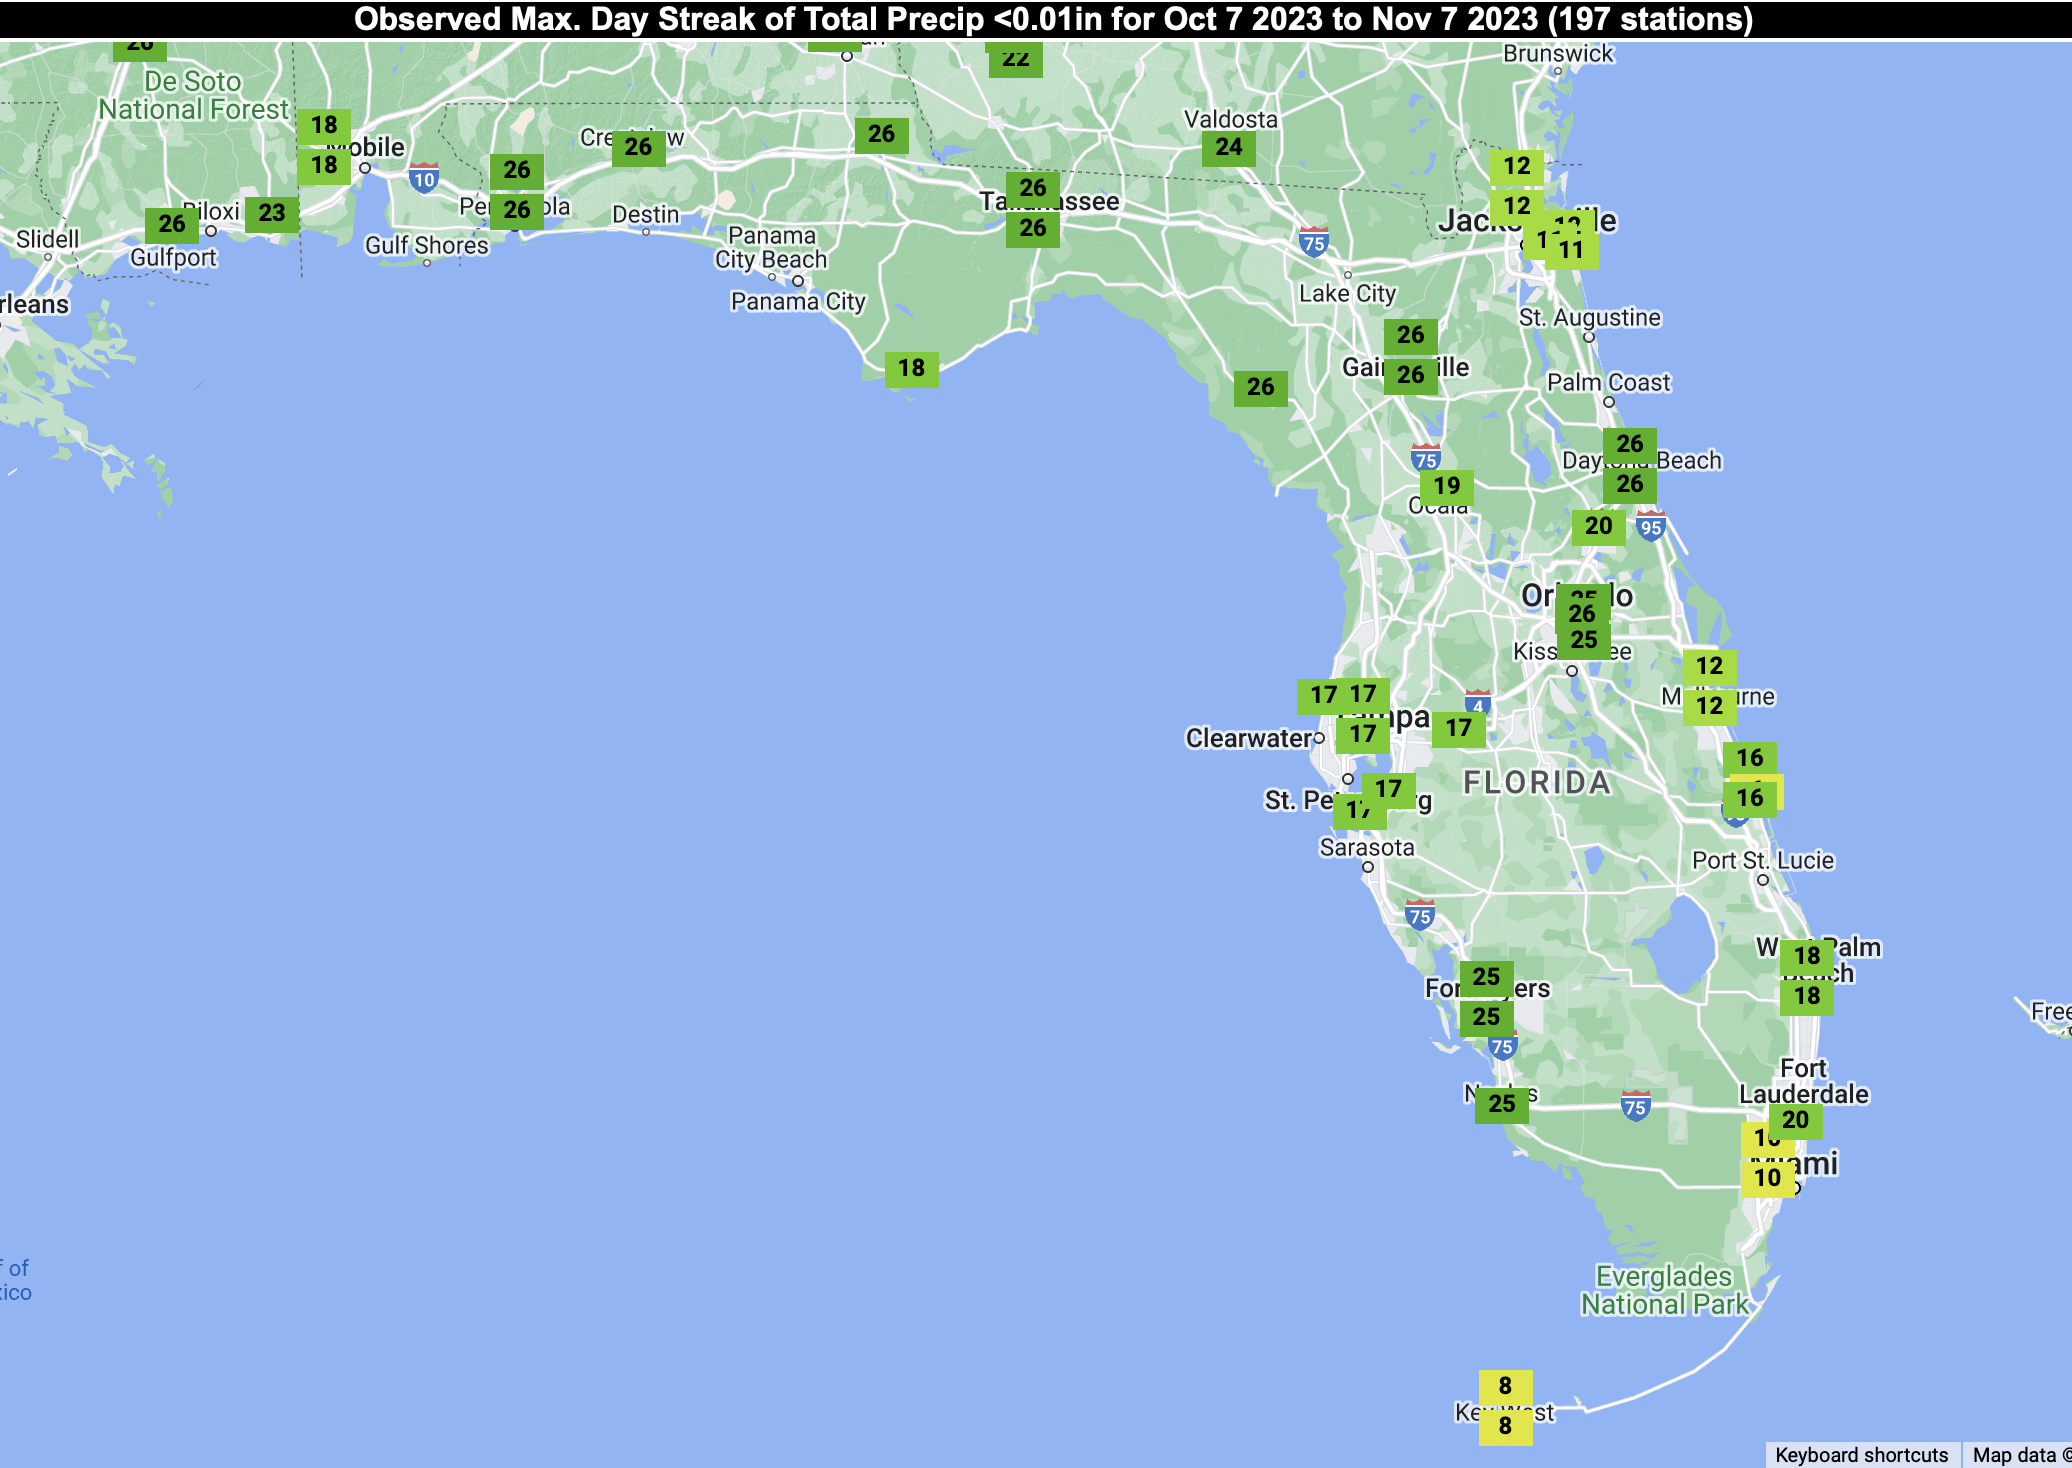
Drought conditions worsened across the western Panhandle, where flash drought is currently underway. Most places across north Florida have gone over 20 consecutive days without rainfall as of early November. Pasture conditions are poor with very little pasture to graze. Most cattle operations are relying on supplemental feeding. Other agriculture reports in the area indicate they are waiting on rainfall for planting.
Drought-Related Impacts.
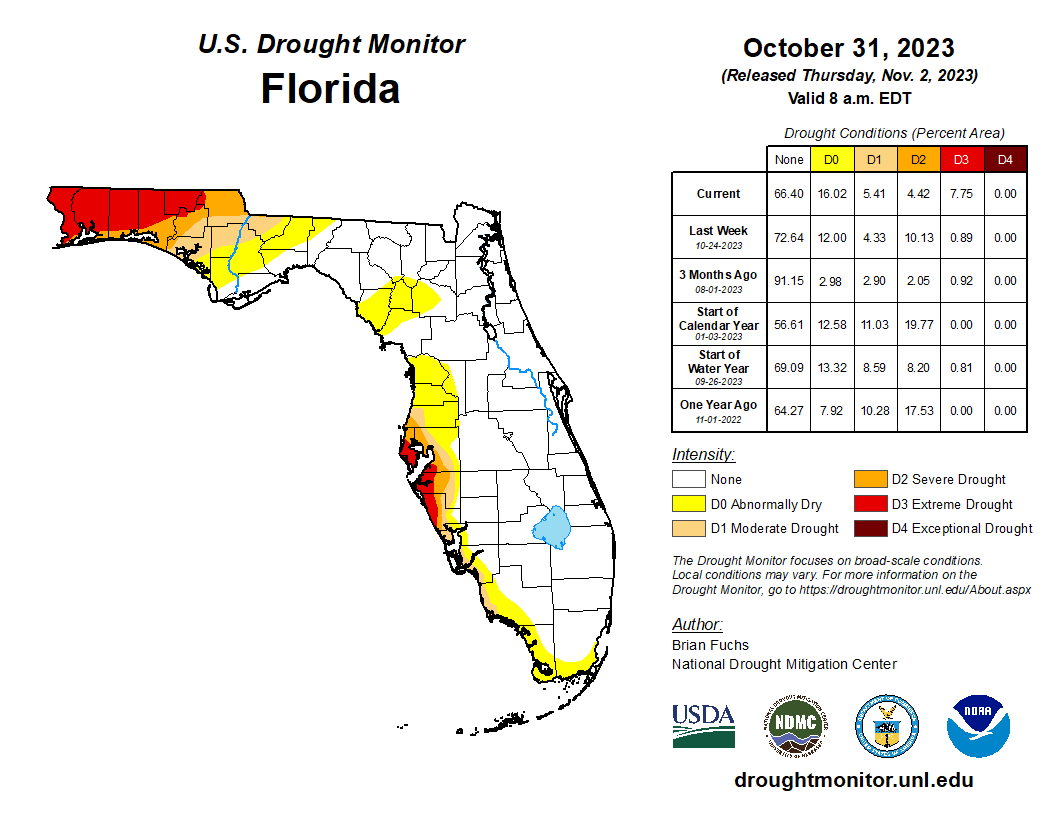
Drought persisted and deteriorated in the Panhandle and west-central coastal parts of the state in October. At the beginning of the month, drought affected the western Panhandle and west-central coast, while abnormally dry conditions were spread across North Florida. By the 17th, roughly 1% of the state was in extreme drought (D3), 9% was in severe drought (D2), 5% was experiencing moderate drought (D1), and 10% was abnormally dry (D0), according to the U.S. Drought Monitor. By the end of the month, drought degraded rapidly in the western Panhandle. By the 31st, about 8% of the state was in extreme drought (D3), 4% was in severe drought (D2), 5% was in moderate drought (D1), and 16% was abnormally dry (D0) (see Figure 2 below).
As of October 31, the Lake Okeechobee water level was 16.20 ft. above sea level (Feet-NGVD29), which is above average for this time of year. At the first of the month, the water level was 15.82 ft. above sea level.
Figure 2. A graphical depiction of the latest drought conditions in Florida according to the U.S. Drought Monitor (courtesy of the National Drought Mitigation Center, University of Nebraska-Lincoln).
Agriculture-Related Impacts.
In mid-October, topsoil moisture conditions were adequate in 72% of the state, short in 16%, and very short in 3% of the state, while 9% of the state was experiencing surplus topsoil moisture conditions. By October 29, topsoil moisture conditions were adequate in 60% of the state, short in 23%, and very short in 16% of the state; 1% of the state was in surplus. For more information, consult the Crop Progress and Conditions Report, which is published by the USDA’s National Agricultural Statistics Service.
Appendix 1
Additional October departures from normal data for select Florida locations (Source: NWS).
| Station | Average Temperature (˚F) | Departure from Normal (˚F) | Total Rainfall (in.) | Departure from Normal (in.) |
| Gainesville | 71.5 | +0.1 | 3.73 | +1.05 |
| Sarasota | 77.8 | +0.5 | 0.70 | -2.06 |
| Naples | 79.4 | +0.9 | 2.50 | -1.43 |
| Fort Myers | 78.5 | +0.5 | 1.90 | -1.18 |
| West Palm Beach | 79.6 | +0.9 | 4.56 | -1.34 |
Appendix 2
Select daily record high minimum temperatures (°F) broken or tied during October (compiled from NOAA).
| Location | Date | Record | Broken/Tied | Last |
| Bradenton | 1 | 77 | Broken | 76 in 2019 |
| Hastings | 1 | 75 | Broken | 74 in 2017 |
| Stuart | 5 | 80 | Tied | 80 in 2018 |
| Key West | 11 | 81 | Tied | 81 in 2022 |
| Tarpon Springs | 12 | 79 | Broken | 77 in 1994 |
| Miles City | 12 | 80 | Broken | 76 in 2018 |
| Ochopee | 12 | 82 | Broken | 78 in 1995 |
| Orlando | 12 | 77 | Broken | 75 in 2005 |
| Fort Myers | 12 | 80 | Broken | 77 in 1934 |
| Key West | 12 | 85 | Broken | 82 in 2002 |
| Miami | 12 | 84 | Broken | 82 in 2009 |
| Tampa | 12 | 81 | Broken | 77 in 2009 |
| Vero Beach | 12 | 79 | Broken | 76 in 2018 |
| Lakeland | 12 | 78 | Broken | 75 in 2018 |
| Bradenton | 13 | 79 | Broken | 76 in 2005 |
| Clermont | 13 | 78 | Broken | 77 in 1994 |
| Fort Lauderdale | 13 | 82 | Broken | 78 in 2019 |
| Fort Pierce | 13 | 79 | Broken | 78 in 2008 |
| Hialeah | 13 | 81 | Broken | 80 in 2022 |
| Homestead | 13 | 80 | Broken | 75 in 2019 |
| Kissimmee | 13 | 78 | Broken | 76 in 1995 |
| Melbourne | 13 | 79 | Broken | 77 in 1954 |
| Plant City | 13 | 79 | Broken | 74 in 1912 |
| Stuart | 13 | 80 | Broken | 78 in 1986 |
| Titusville | 13 | 79 | Broken | 78 in 1999 |
| Ochopee | 13 | 80 | Broken | 76 in 2017 |
| Fort Myers | 13 | 80 | Broken | 77 in 2005 |
| Miami | 13 | 83 | Broken | 80 in 2009 |
| Key West | 13 | 84 | Broken | 82 in 2009 |
| Lakeland | 13 | 78 | Broken | 74 in 2017 |
| Fort Lauderdale | 14 | 81 | Broken | 78 in 2001 |
| Hialeah | 14 | 80 | Broken | 79 in 2009 |
| Homestead | 14 | 79 | Broken | 76 in 2014 |
| Miami | 14 | 80 | Tied | 80 in 2009 |
| Fort Lauderdale | 15 | 79 | Broken | 78 in 1983 |
| Usher Tower | 24 | 79 | Broken | 72 in 1959 |