


Prepared by Florida Climate Center
The Florida State University
Tallahassee, FL

Key Points:
- Monthly average temperatures were above normal in March for the third month in a row this year.
- Monthly precipitation totals were generally below normal, with exceptions in parts of northern Florida; the Big Bend region saw a surplus of rainfall during the month.
- Severe drought expanded across the Peninsula, and a pocket of extreme drought developed in Southwest Florida later in the month.
- A final La Niña Advisory was issued and ENSO-neutral conditions currently exist.
Average monthly temperatures in March were above normal across the state. Average temperature departures from normal ranged from +3.0 ̊F in Jacksonville to +5.0 ̊F in Tallahassee and Ft. Myers for the month (see Table 1 and Appendix 1 for select cities). Temperatures in March 2023 began much above normal, with most stations recording their top warmest or 2nd-warmest first week of March on record. Cooler, more seasonable weather returned by mid-month, and a late-season frost with minimum temperatures reaching as low as 30 ̊F -35 ̊F affected much of the Panhandle and northern Florida on March 20-21. Above-normal temperatures returned at the end of the month, with 90+ ̊F maximum temperatures observed across southern Florida during the last week of March. Many stations recorded one of the top 5-warmest months of March on record, such as Tallahassee, Pensacola, Orlando, Fort Myers, Melbourne, Lakeland, Miami, West Palm Beach, Naples, and Key West. Select daily high maximum temperature records tied or broken during the month are provided in Appendix 2.
Table 1. March average temperatures and departures from normal ( ̊F) for selected cities.
| Station | Mean Temperature | Departure from Normal |
| Pensacola | 66.5 | +4.2 |
| Tallahassee | 66.4 | +5.0 |
| Jacksonville | 65.4 | +3.0 |
| Orlando | 71.9 | +4.6 |
| Tampa | 72.3 | +3.7 |
| Miami | 76.9 | +3.8 |
| Key West | 77.5 | +3.1 |
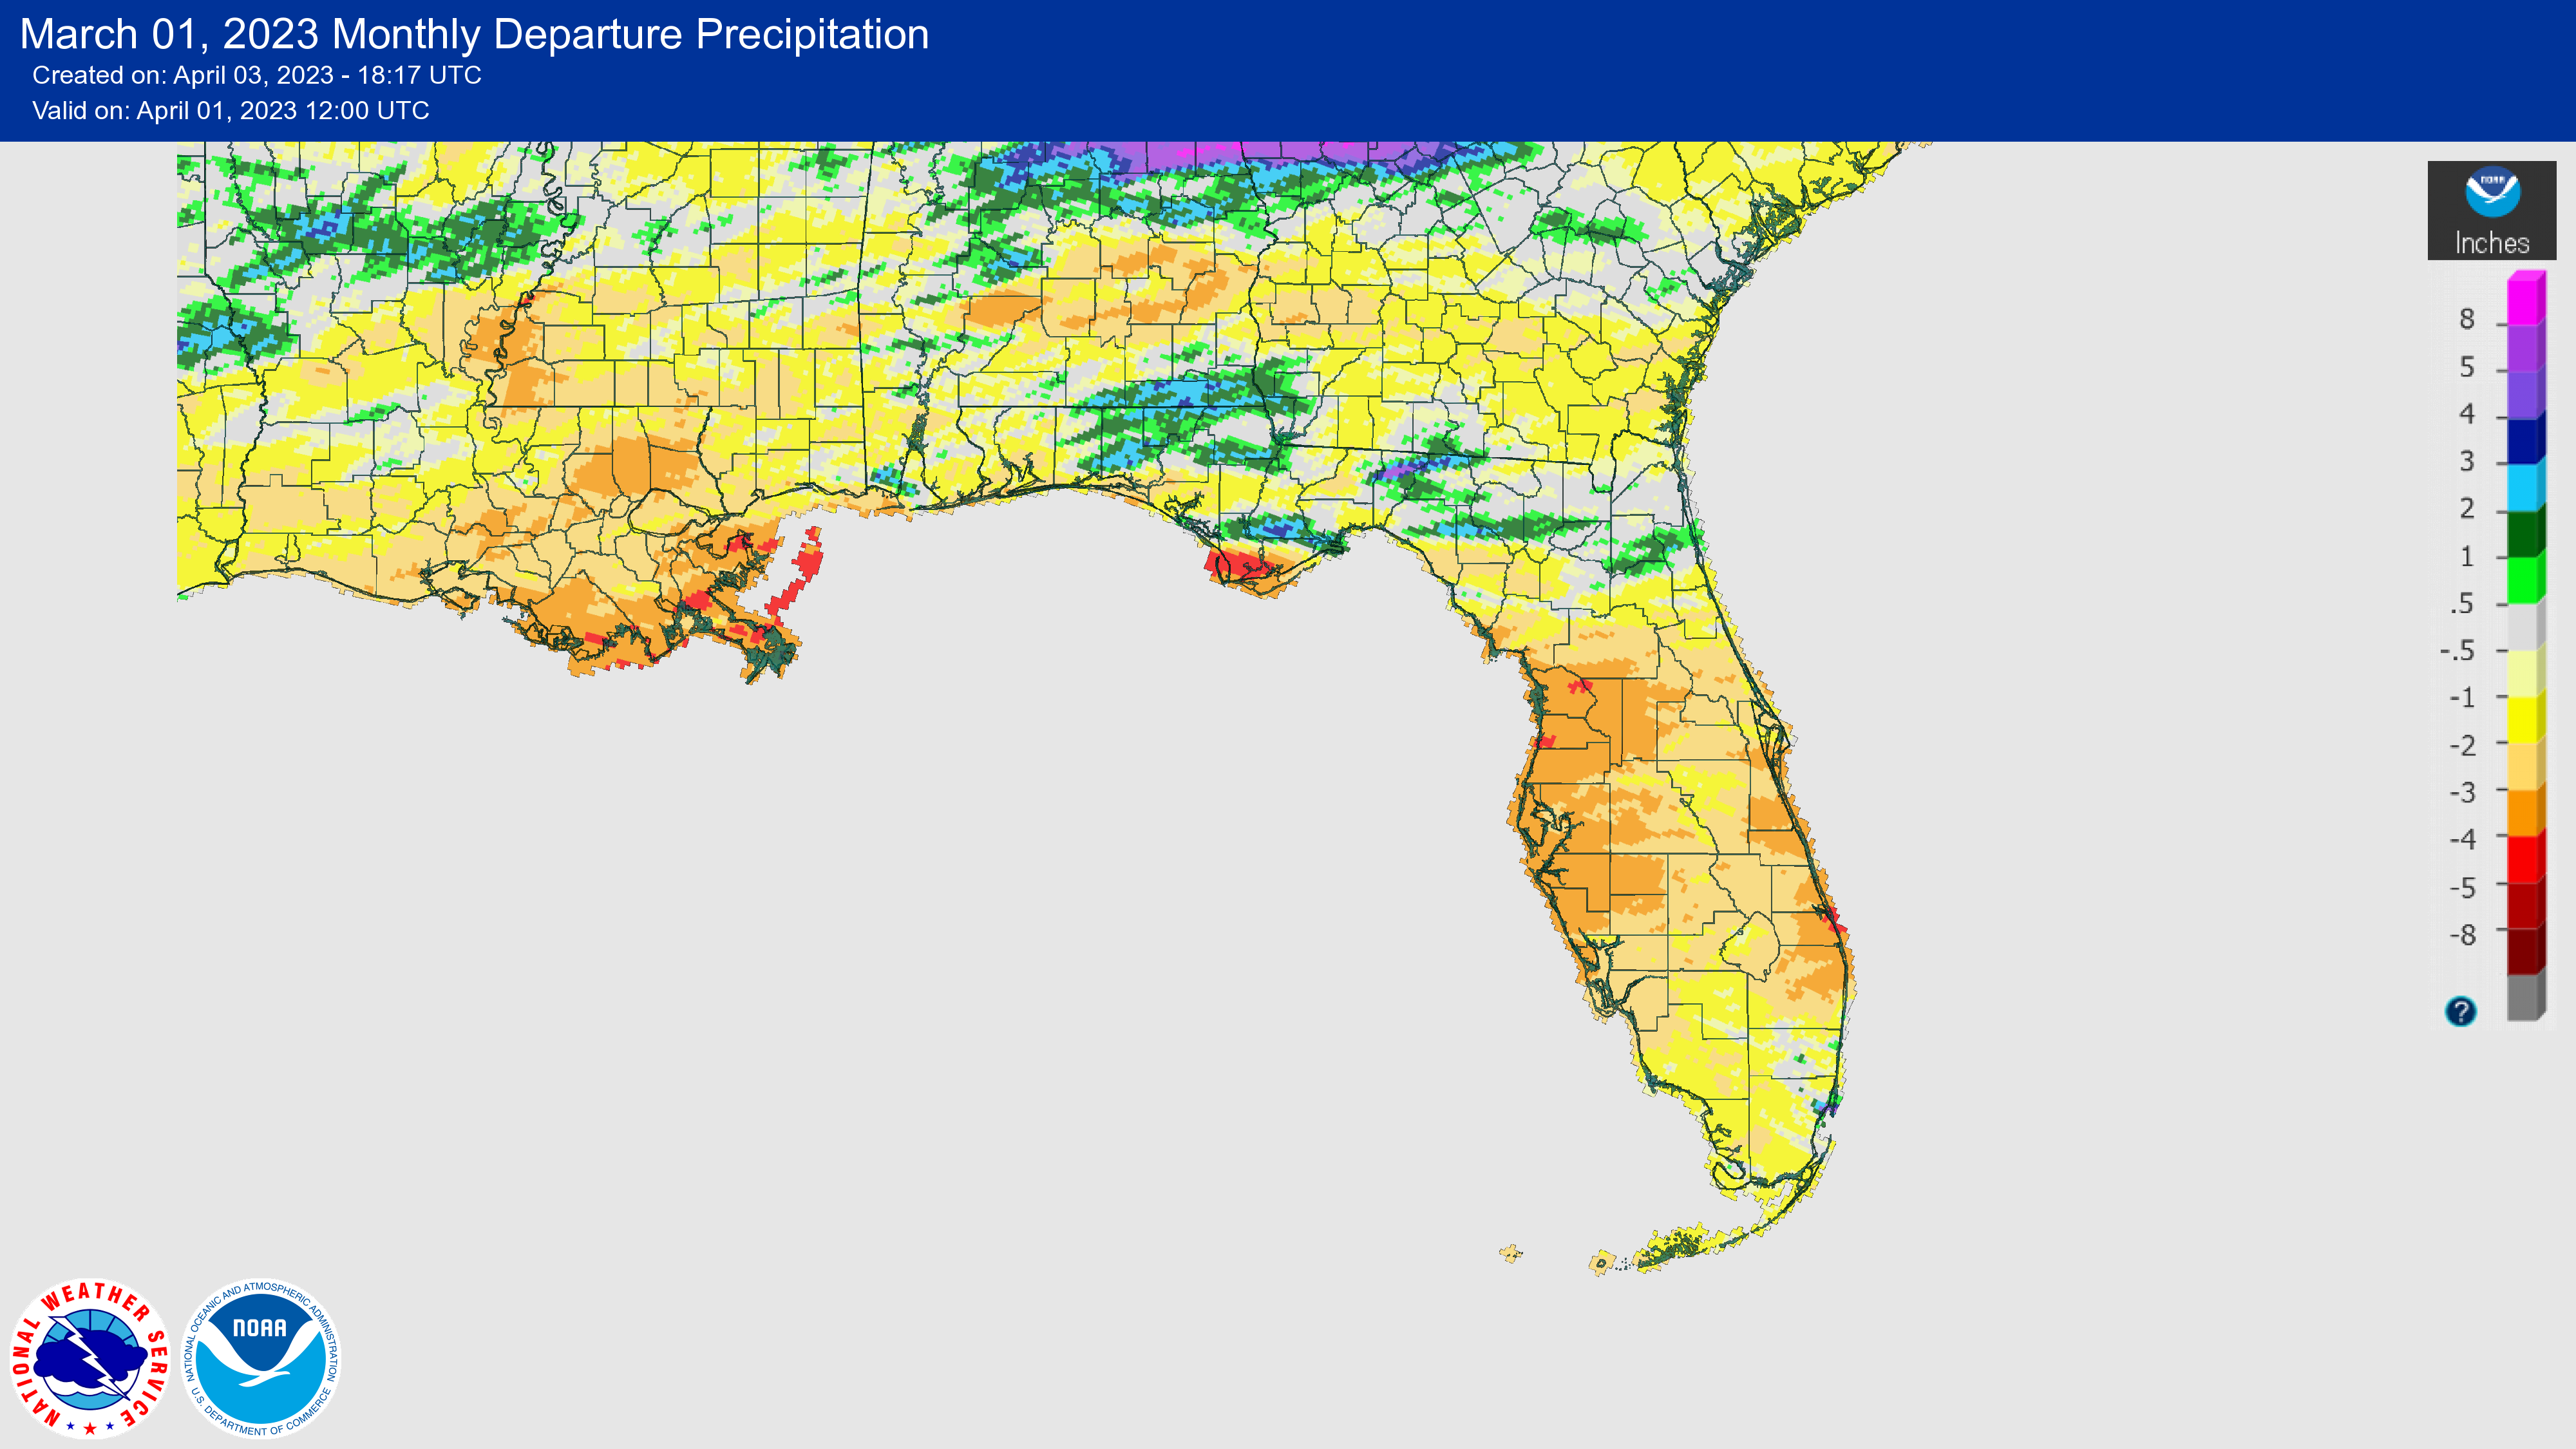
March was dry across the Peninsula and wet in some northern areas, including in the Big Bend region. The monthly precipitation departures from normal ranged from -3.19 inches in West Palm Beach to +2.04 inches in Miami (see Table 2 and Appendix 1 for additional locations). Much of the Peninsula received less than one-quarter of expected precipitation during the month of March, and West Palm Beach had its driest March on record. Venice had its 2nd-driest March on record, Bradenton had its 3rd-driest, and Orlando had its 4th-driest on record. With rainfall well below average, drought conditions expanded and intensified across the Peninsula during the month (see drought section below).
Table 2. March precipitation totals and departures from normal (inches) for selected cities.
| Station | Total Rainfall | Departure from Normal |
| Pensacola | 3.15 | -2.10 |
| Tallahassee | 3.46 | -1.78 |
| Jacksonville | 3.33 | +0.04 |
| Orlando | 0.33 | -2.70 |
| Tampa | 0.35 | -2.17 |
| Miami | 4.50 | +2.04 |
| Key West | 0.25 | -1.28 |
Figure 1. A graphical depiction of the monthly rainfall departure from normal (inches) for March (courtesy of NOAA, NWS).
Final La Niña Advisory Issued.
La Niña transitioned to ENSO-neutral conditions in February and NOAA issued the final La Niña advisory on March 9th. During the month of February, below-average sea surface temperatures continued to weaken and persisted only in the central Pacific Ocean by early March. The latest weekly Niño-3.4 index value was -0.2 ̊C; whereas, sea surface temperatures in the eastern Pacific Ocean were slightly above average. ENSO-neutral conditions currently exist and are expected to continue through the Northern Hemisphere spring and early summer. Models suggest a transition to El Niño conditions during summer, but large uncertainty remains beyond spring.
Hazardous Weather Events in March.
According to the Local Storm Reports issued by the local National Weather Service offices serving Florida, there were 107 individual local reports of hazardous weather events recorded across the state during the month of March (see Table 3 for a breakdown by event type). Dry, warm weather in March increased the threat of wildfires and wildfires were reported in Collier County early in the month, which destroyed several homes and outbuildings. Wildfires were also reported in Broward, Martin, and Volusia counties later in the month. Two fatalities occurred as a result of drowning from rip currents, both in Brevard County, and another fatality occurred when a tree fell on a car during a heavy thunderstorm in Leon County on the 10th.
Table 3. Breakdown of storm reports submitted in Florida during the month of March (compiled from Iowa State University/Iowa Environmental Mesonet).
| Report Type | Number of Reports |
| Heavy Rain | 0 |
| Flood | 2 |
| Dense Fog | 1 |
| Hail | 8 |
| Marine Thunderstorm Wind | 10 |
| Non-Thunderstorm Wind Gust | 35 |
| Non-Thunderstorm Wind Damage | 2 |
| Tornado/Waterspout/Funnel Cloud | 3/7/0 |
| Thunderstorm Wind Damage | 17 |
| Thunderstorm Wind Gust | 13 |
| Rip Currents | 2 |
| Wildfire | 7 |
Daily Record Events in March.
Table 4. Summary of daily records broken or set in Florida in March (source: NCEI Daily Weather Records).
| Category | Number of Records |
| Highest daily max. temp. | 98 |
| Highest daily min. temp. | 77 |
| Lowest daily max. temp. | 7 |
| Lowest daily min. temp. | 8 |
| Highest daily precipitation | 13 |
| Total | 203 |
Weather/Climate Highlight of the Month:
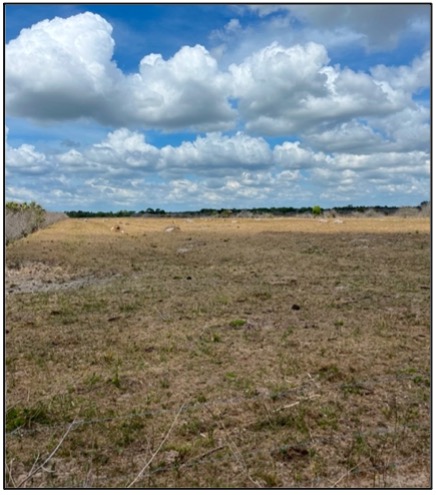
Extreme drought (D3) emerged in Florida this month for the first time since it briefly affected the state in October 2019. People began submitting drought condition monitoring reports as the month progressed. Reports have stated that excessively dry conditions are impacting pastures, resulting in poor crop yields, and requiring increased irrigation and supplemental feeding to maintain livestock. This photo was taken in Okeechobee County and submitted on April 3, 2023 by 5 L Cattle.
Drought-Related Impacts.
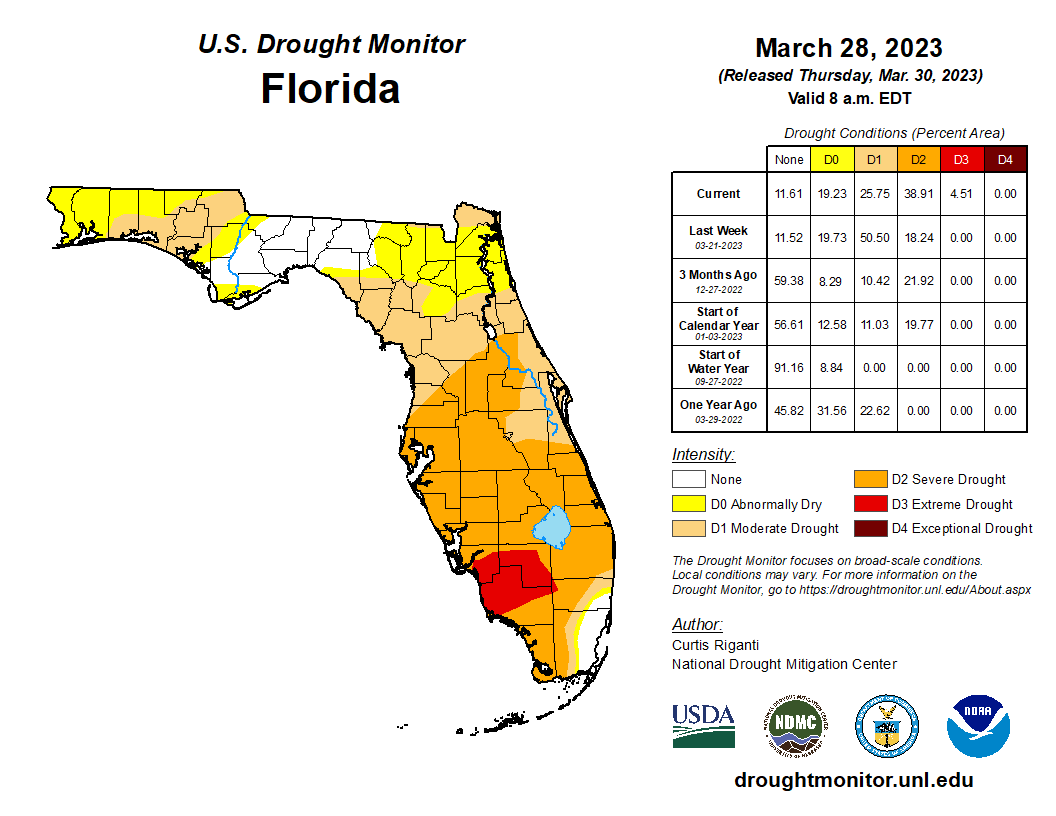
By the middle of March, moderate drought (D1) spread across the Florida Peninsula and severe drought (D2) emerged in southwest Florida. About 10% of the state was in severe drought (D2), 60% was in moderate drought (D1), and 21% was abnormally dry, according to the U.S. Drought Monitor. By the end of the month, degradation occurred across the Peninsula with the emergence of a pocket of extreme drought (D3) in southwest Florida. As of March 28, 4.5% of the state was in extreme drought (D3), 39% was in severe drought (D2), 26% of the state was in moderate drought (D1), and 19% was abnormally dry (Figure 3).
As of March 31, the Lake Okeechobee water level was 14.55 ft. above sea level (Feet-NGVD29), which is close to average for this time of year. At the first of the month, the water level was 15.50 ft. above sea level.
Figure 2. A graphical depiction of the latest drought conditions in Florida according to the U.S. Drought Monitor (courtesy of the National Drought Mitigation Center, University of Nebraska-Lincoln).
Agriculture-Related Impacts.
During March, the lack of precipitation in most of the state and above-normal temperatures worsened drought conditions across the Peninsula. Drought conditions adversely affected pastures and pasture conditions were reported as mostly poor to fair. Cattle were reported to be in mostly good to fair condition. Preparations for spring planting of row crops progressed well. Citrus grove activities included general maintenance and removal of dead trees. Drought has resulted in widespread irrigation. With unseasonably warm temperatures during February and March, a mid-month freeze event, which followed on a long period without freezing temperatures, resulted in fruit damage particularly in areas further north in central and southern Georgia. Chill hours for northern Florida and nearby areas are below last year’s accumulation and below historical averages. North Florida experienced only 1-3 days with temperatures at or below 32 ̊ F during March. Fruits and vegetables that were planted and harvested during the month included green beans, yellow squash, strawberries, watermelon, zucchini, sweet corn, pepper, and avocadoes. For more information, consult the Crop Progress - State Stories reports, which are produced monthly December through March by the USDA’s National Agricultural Statistics Service.
Appendix 1
Additional March departures from normal data for select Florida locations (Source: NWS).
| Station | Average Temperature (˚F) | Departure from Normal (˚F) | Total Rainfall (in.) | Departure from Normal (in.) |
| Gainesville | 66.4 | +3.7 | 4.68 | +1.19 |
| Sarasota | 71.6 | +3.5 | 0.18 | -2.67 |
| Melbourne | 72.6 | +4.0 | 1.16 | -1.53 |
| Fort Myers | 75.3 | +5.0 | 0.10 | -1.97 |
| West Palm Beach | 75.8 | +4.7 | 0.12 | -3.19 |
Appendix 2
Select daily record high maximum temperatures (°F) broken or tied during March (compiled from NOAA).
| Location | Date | Record | Broken/Tied | Last |
| Pensacola | 1 | 79 | Broken | 77 in 2012 |
| Key West | 1 | 90 | Broken | 85 in 2019 |
| Plant City | 2 | 90 | Broken | 89 in 2021 |
| Mayport | 2 | 86 | Broken | 85 in 1971 |
| Lakeland | 2 | 88 | Broken | 87 in 2019 |
| Clermont | 3 | 89 | Broken | 88 in 2019 |
| Pensacola | 3 | 80 | Broken | 76 in 1997 |
| Orlando | 3 | 90 | Tied | 90 in 2012 |
| Vero Beach | 3 | 91 | Broken | 89 in 2012 |
| Bradenton | 4 | 89 | Broken | 86 in 2020 |
| Clermont | 4 | 91 | Broken | 89 in 1961 |
| Jacksonville Beach | 4 | 88 | Broken | 87 in 1953 |
| Lisbon | 4 | 88 | Broken | 86 in 2001 |
| Daytona Beach | 4 | 90 | Broken | 88 in 1953 |
| Orlando | 4 | 91 | Broken | 89 in 2020 |
| Vero Beach | 4 | 91 | Broken | 90 in 2020 |
| Key West | 4 | 91 | Broken | 86 in 2020 |
| Pensacola | 4 | 81 | Broken | 80 in 1997 |
| Tallahassee | 4 | 87 | Broken | 86 in 1945 |
| Apalachicola | 5 | 79 | Broken | 77 in 2004 |
| Melbourne | 5 | 89 | Broken | 88 in 1982 |
| Miles City | 5 | 94 | Broken | 92 in 2003 |
| Key West | 5 | 92 | Broken | 87 in 2022 |
| Pensacola | 5 | 81 | Broken | 80 in 1974 |
| Tallahassee | 5 | 86 | Broken | 85 in 1955 |
| Kissimmee | 6 | 90 | Broken | 87 in 2015 |
| Panama City | 6 | 83 | Broken | 81 in 2022 |
| Quincy | 6 | 84 | Broken | 83 in 1976 |
| Orlando | 6 | 90 | Broken | 89 in 2003 |
| Fort Myers | 6 | 92 | Tied | 92 in 1944 |
| Miami | 6 | 91 | Broken | 88 in 2003 |
| Key West | 6 | 91 | Broken | 87 in 2022 |
| Tallahassee | 6 | 88 | Broken | 85 in 2003 |
| Apalachicola | 7 | 84 | Broken | 81 in 1945 |
| Clermont | 7 | 90 | Tied | 90 in 1961 |
| Fort Lauderdale | 7 | 91 | Broken | 89 in 1967 |
| Jacksonville Beach | 7 | 90 | Broken | 87 in 2022 |
| Gainesville | 7 | 88 | Broken | 87 in 2022 |
| Miami | 7 | 91 | Broken | 89 in 2003 |
| Jacksonville | 7 | 89 | Broken | 87 in 2022 |
| Pensacola | 7 | 86 | Broken | 83 in 1992 |
| Tallahassee | 7 | 88 | Broken | 84 in 1992 |
| Crestview | 7 | 87 | Broken | 86 in 1992 |
| Fort Lauderdale | 8 | 91 | Broken | 90 in 2003 |
| Niceville | 8 | 84 | Broken | 81 in 1951 |
| Miami | 8 | 90 | Broken | 88 in 2003 |
| Key West | 9 | 92 | Broken | 88 in 2022 |
| West Palm Beach | 13 | 94 | Broken | 93 in 2001 |
| Fort Myers | 23 | 90 | Tied | 90 in 2017 |
| Orlando | 25 | 92 | Broken | 91 in 2021 |
| Daytona Beach | 25 | 90 | Broken | 88 in 2021 |
| Jacksonville Beach | 26 | 88 | Broken | 86 in 2021 |
| Orlando | 26 | 92 | Broken | 89 in 2021 |
| Lisbon | 28 | 90 | Broken | 89 in 2021 |
| West Palm Beach | 28 | 91 | Broken | 88 in 2021 |
| Fort Lauderdale | 30 | 88 | Broken | 85 in 2021 |
| Venice | 31 | 90 | Broken | 88 in 2002 |