


Prepared by Florida Climate Center
The Florida State University
Tallahassee, FL

Key Points:
- Monthly average temperatures were well above normal in February, and it was among the warmest months of February on record for many locations.
- Monthly precipitation totals were generally below normal for the month, with exceptions along the southeastern coast and Big Bend regions.
- Severe drought improved in north-central Florida by mid-month, but moderate drought expanded across the Peninsula during the month
- La Niña conditions in the equatorial Pacific Ocean weakened, and a transition to ENSO-neutral is expected during the spring to early summer timeframe.
Average monthly temperatures in February were well above normal across the state. Average temperature departures from normal ranged from +4.3 ̊F in Key West to +8.2 ̊F in Tallahassee for the month (see Table 1 and Appendix 1 for select cities). Many stations recorded one of their warmest months of February on record. Fort Lauderdale had its warmest February on record this year, based on the monthly mean average temperature. Pensacola, Tallahassee, Jacksonville, Daytona Beach, Miami, and Fort Myers all had their 2nd-warmest February on record, based on monthly mean average temperatures. In addition, many stations across the state had one of their top three warmest months of February on record based on monthly average maximum temperatures. Select daily high maximum temperature records tied or broken during the month are provided in Appendix 2.
Table 1. February average temperatures and departures from normal ( ̊F) for selected cities.
| Station | Mean Temperature | Departure from Normal |
| Pensacola | 64.6 | +7.8 |
| Tallahassee | 63.8 | +8.2 |
| Jacksonville | 65.5 | +8.0 |
| Orlando | 70.0 | +6.4 |
| Tampa | 70.3 | +5.6 |
| Miami | 75.9 | +5.2 |
| Key West | 76.6 | +4.3 |
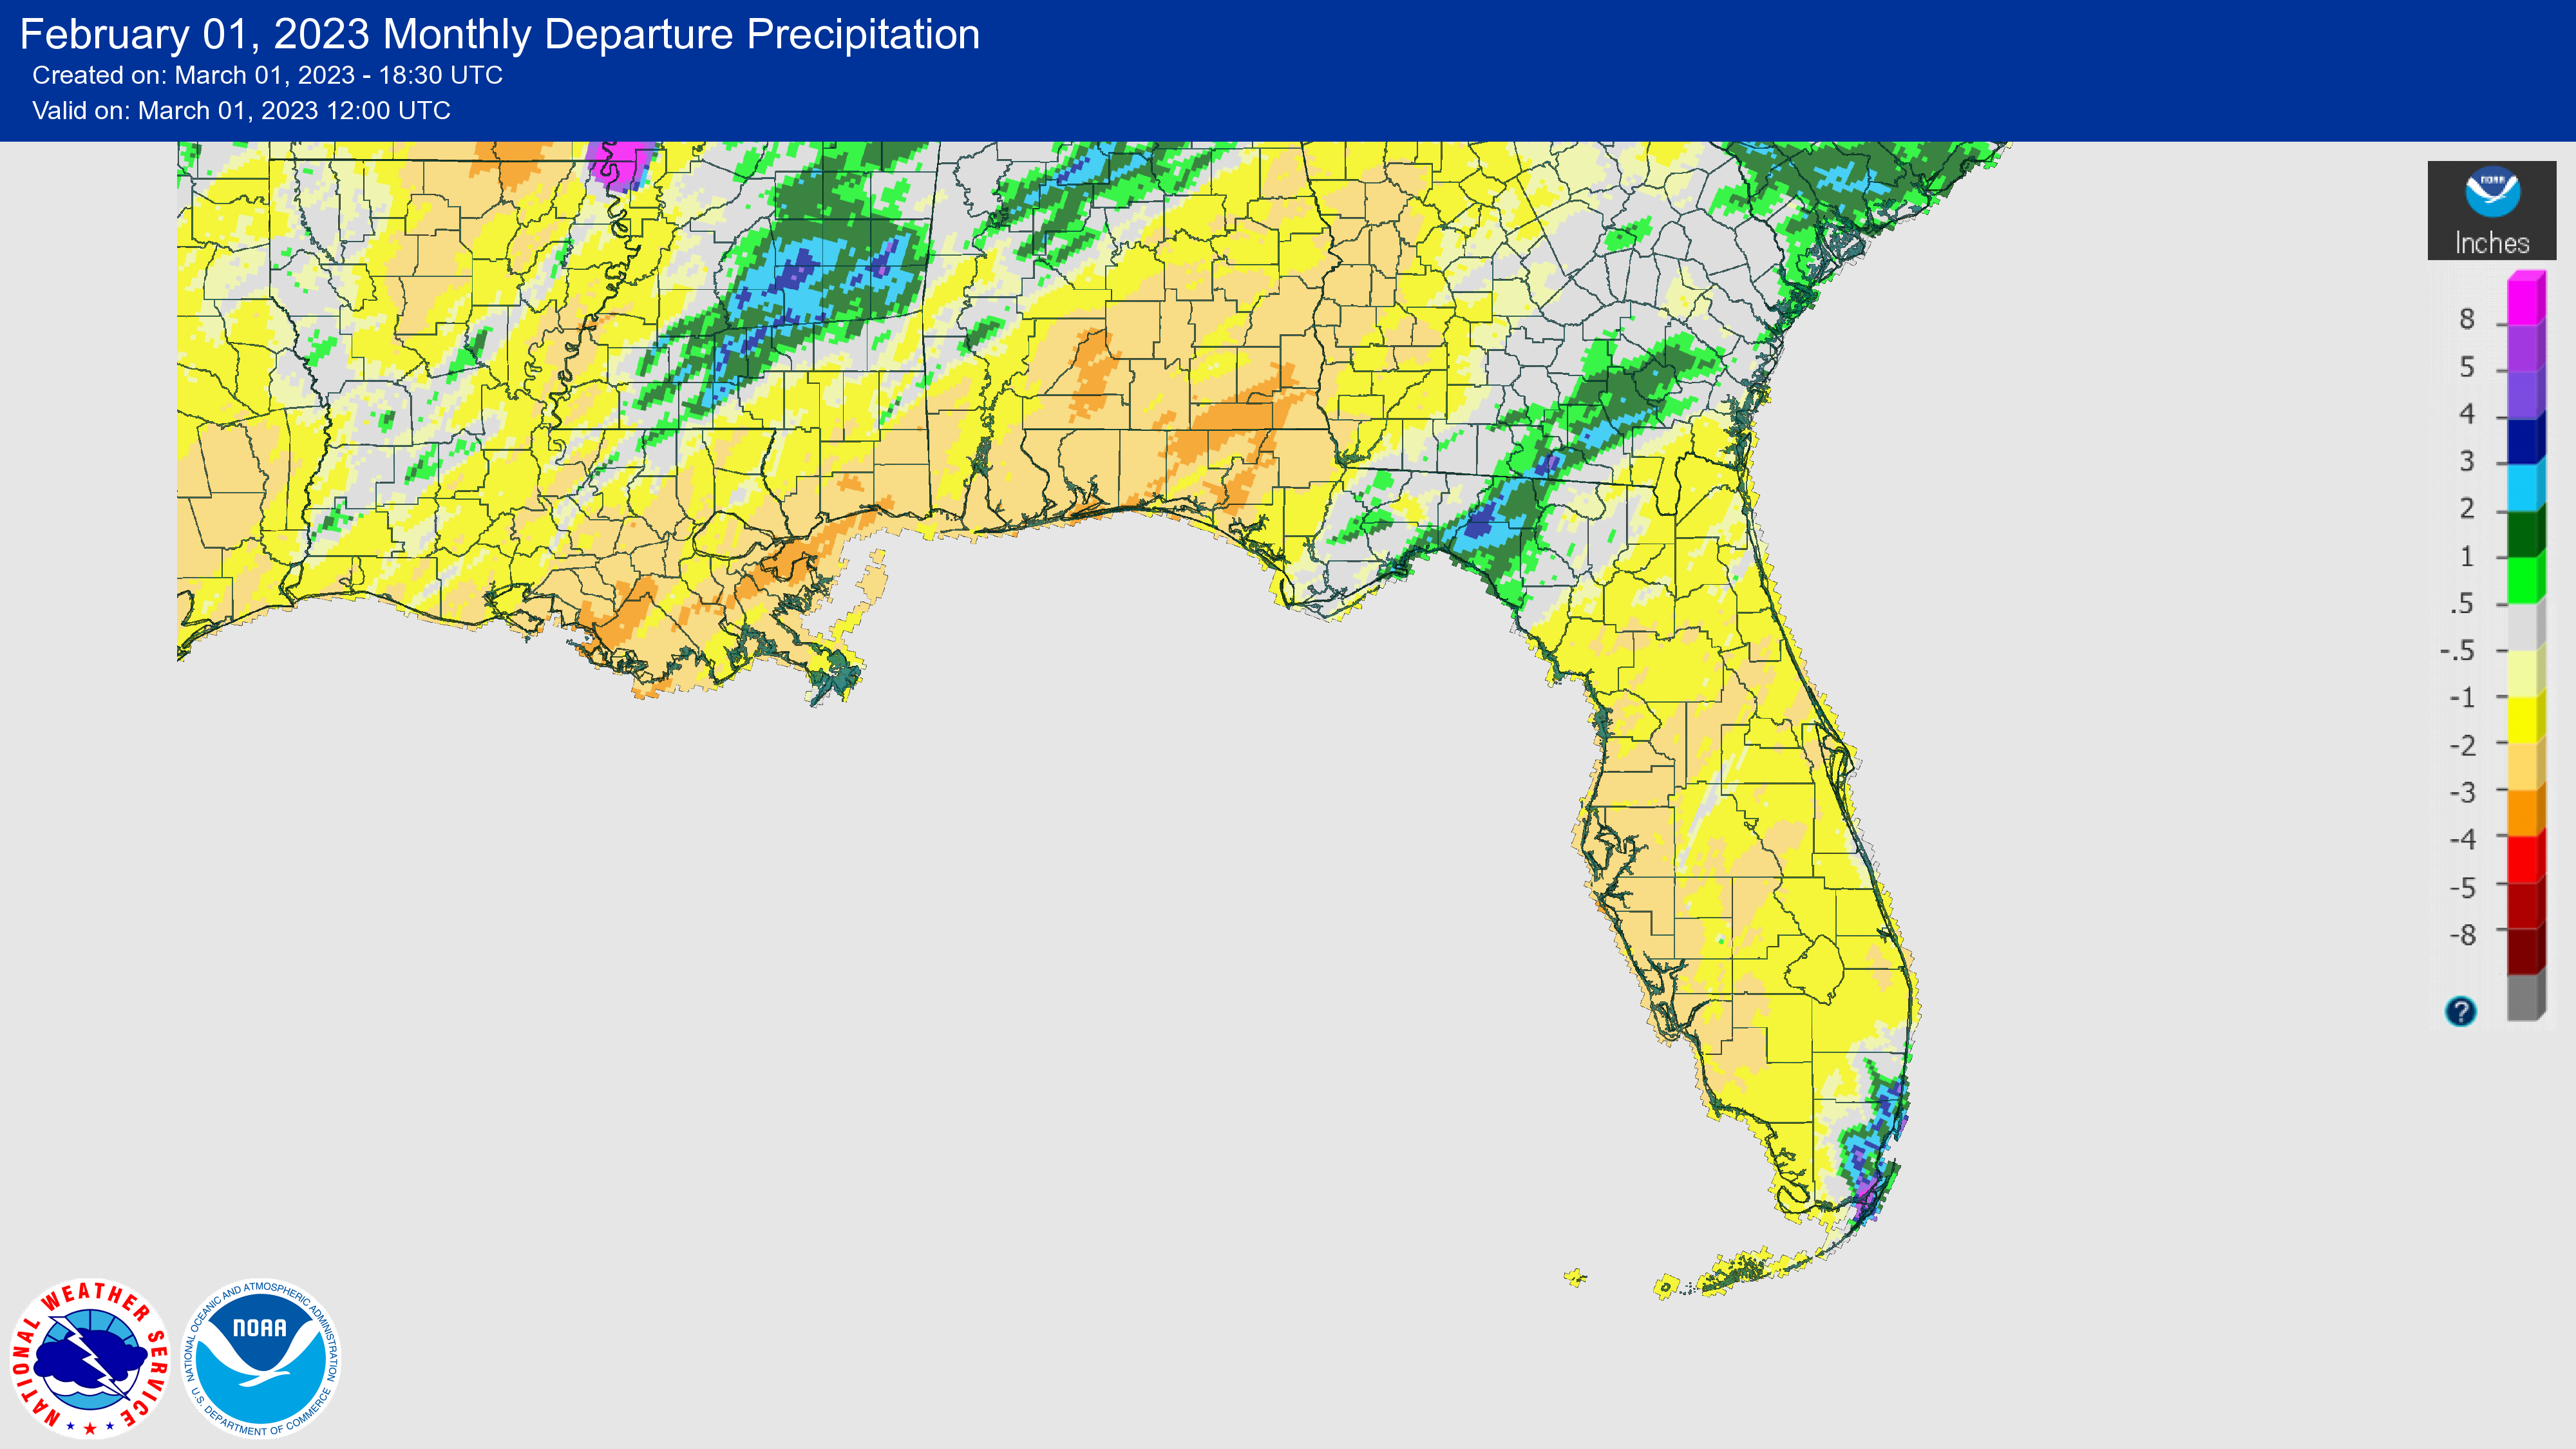
February was dry overall across the state, with monthly rainfall totals below normal except along the southeast coast and a portion of the Big Bend region. The monthly precipitation departures from normal ranged from -2.44 inches in Pensacola to +3.57 inches in Miami (see Table 2 and Appendix 1 for additional locations). While we are in the dry season, the southwest coast was especially dry during the month. Naples recorded no precipitation during February, and Key West received less than a tenth of rainfall during the month, making it the driest February on record in both locations. Only portions of the Big Bend and southeast Florida received above-average monthly rainfall totals, and Miami and Ft. Lauderdale both observed their 4th-wettest February on record. As a result of drier than normal conditions and above-average temperatures, moderate drought expanded across the Peninsula during the month (see below).
Table 2. February precipitation totals and departures from normal (inches) for selected cities.
| Station | Total Rainfall | Departure from Normal |
| Pensacola | 2.33 | -2.44 |
| Tallahassee | 3.89 | -0.39 |
| Jacksonville | 1.42 | -1.44 |
| Orlando | 0.55 | -1.49 |
| Tampa | 0.46 | -2.16 |
| Miami | 5.72 | +3.57 |
| Key West | 0.01 | -1.53 |
Figure 1. A graphical depiction of the monthly rainfall departure from normal (inches) for February (courtesy of NOAA, NWS).
La Niña Weakens with a Transition to ENSO-Neutral Expected.
A weak La Niña was still in place throughout the month with signs of weakening. Sea surface temperatures in the eastern equatorial Pacific Ocean were not as cold as they have been, with the latest Niño index values generally near -0.5°C; sub-surface temperatures warmed too. There is forecaster consensus that La Niña is expected to continue to weaken and transition to ENSO-neutral conditions during spring to early summer, during the March through May period. Models suggest a transition to El Niño conditions during summer, but large uncertainty remains beyond spring.
Hazardous Weather Events in February.
According to the Local Storm Reports issued by the local National Weather Service offices serving Florida, there were 64 individual local reports of hazardous weather events recorded across the state during the month of February (see Table 4 for a breakdown by event type). Unfortunately four fatalities were reported during the month, each as a result of rip currents.
Table 4. Breakdown of storm reports submitted in Florida during the month of February (compiled from Iowa State University/Iowa Environmental Mesonet).
| Report Type | Number of Reports |
| Heavy Rain | 10 |
| Flood | 0 |
| Coastal Flood | 0 |
| Hail | 0 |
| Marine Thunderstorm Wind | 3 |
| Non-Thunderstorm Wind Gust | 30 |
| Non-Thunderstorm Wind Damage | 3 |
| Tornado/Waterspout/Funnel Cloud | 1/2/0 |
| Thunderstorm Wind Damage | 0 |
| Thunderstorm Wind Gust | 11 |
| Rip Currents | 4 |
Daily Record Events in February.
Table 5.Summary of daily records broken or set in Florida in February (source: NCEI Daily Weather Records).
| Category | Number of Records |
| Highest daily max. temp. | 100 |
| Highest daily min. temp. | 58 |
| Lowest daily max. temp. | 0 |
| Lowest daily min. temp. | 0 |
| Highest daily precipitation | 10 |
| Total | 168 |
Weather/Climate Highlight of the Month:
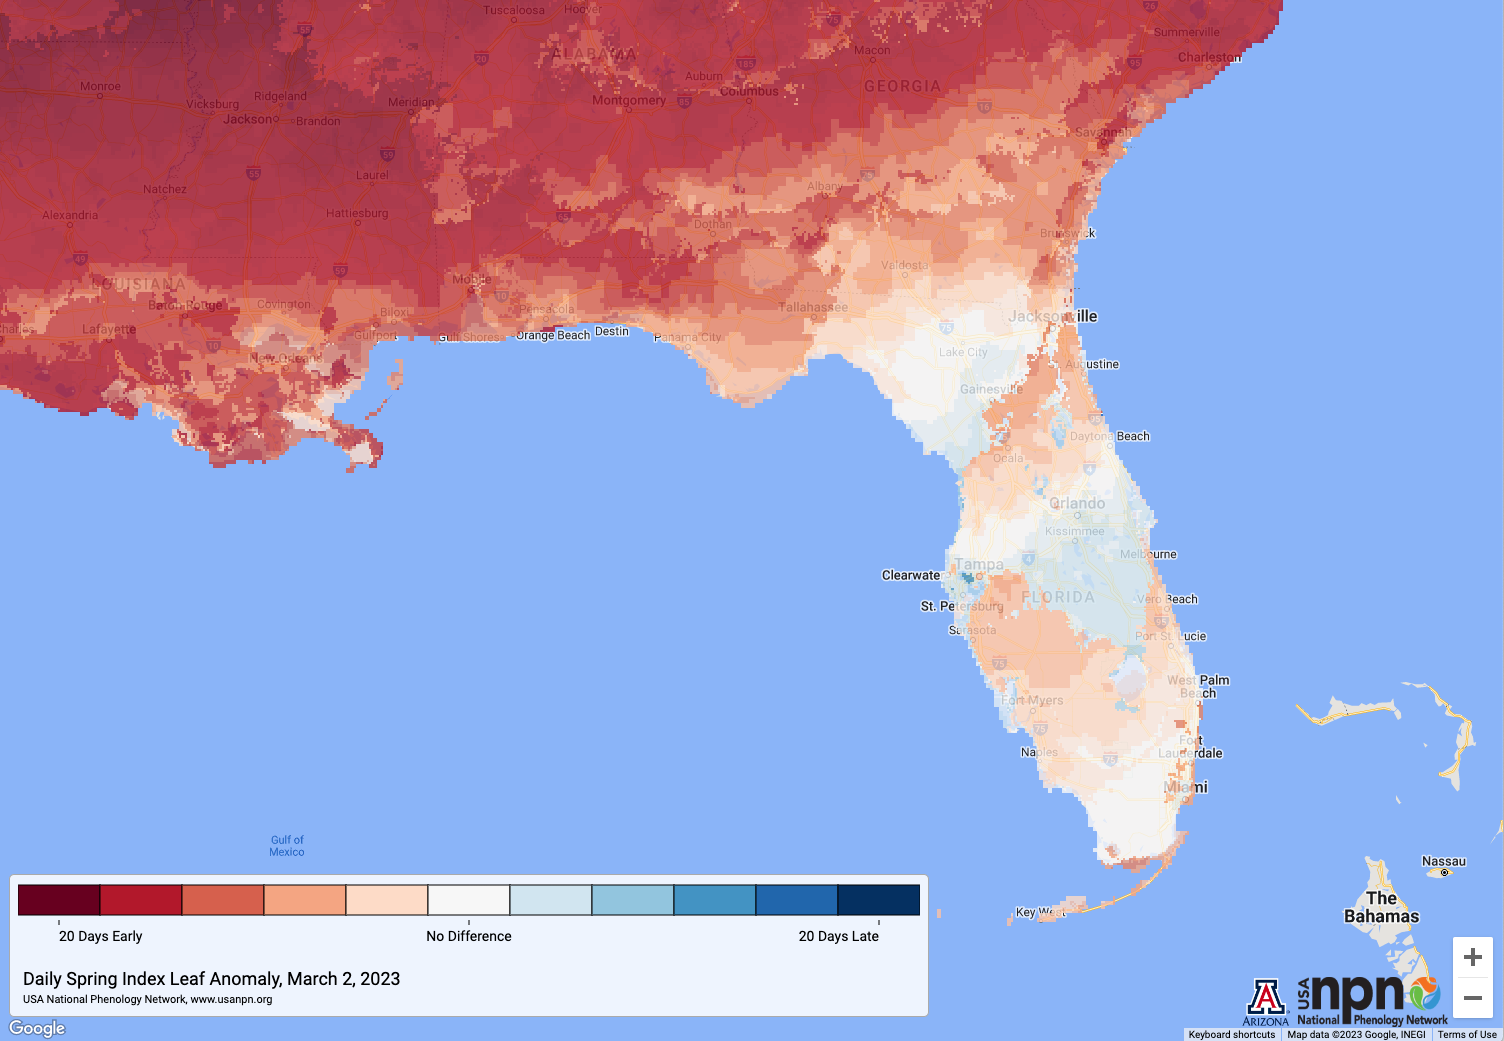
February temperatures were well above average, especially during the second half of the month. As a result of unseasonably warm temperatures, spring leaf out came anomalously early by several weeks in parts of the Southeast U.S., including about a week early in the Florida Panhandle; the Florida Peninsula was close to normal (Figure 2).
Figure 2. Daily spring index leaf anomaly, which shows the difference in days between the current daily spring index and the 30-year average spring index for first leaf, based on data from the National Centers for Environmental Prediction (Source: USA National Phenology Network).
Drought-Related Impacts.
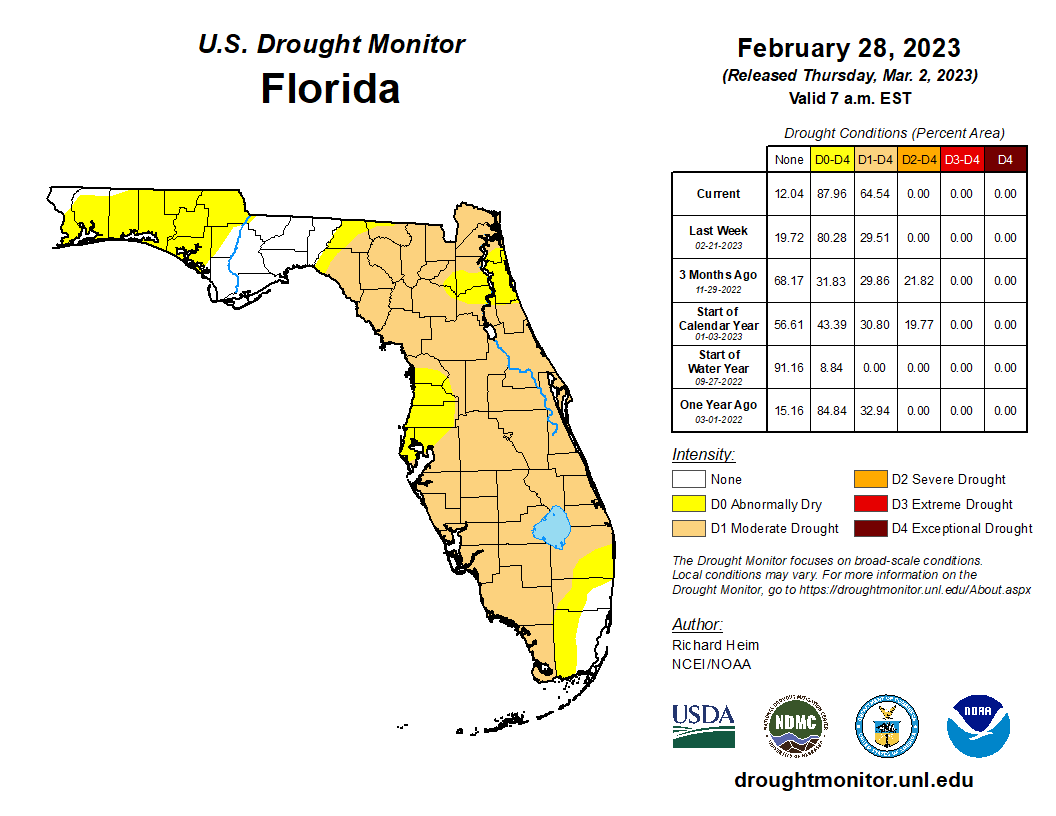
By the middle of February, severe drought (D2) conditions were removed from the Big Bend region, but moderate drought (D1) spread across north-central Florida. About 30% of the state was in moderate drought (D1) and 38% was abnormally dry, according to the U.S. Drought Monitor. By the end of the month, degradation occurred across the Peninsula with the continuation of above-average warmth and drier than normal conditions. As of February 28th, 65% of the state was in moderate drought (D1) and 23% was abnormally dry (Figure 3 below).
As of February 28, the Lake Okeechobee water level was 15.54 ft. above sea level (Feet-NGVD29), which is above average for this time of the year. At the first of the month, the water level was 16.01 ft. above sea level.
Figure 3. A graphical depiction of the latest drought conditions in Florida according to the U.S. Drought Monitor (courtesy of the National Drought Mitigation Center, University of Nebraska-Lincoln).
Agriculture-Related Impacts.
During February, the lack of precipitation and worsening drought conditions across the Peninsula negatively impacted pastures. Pasture conditions were reported as mostly poor to fair. However, the dry weather helped the progress of sugarcane harvesting. Preparations for spring planting of row crops began during the second half of the month. Citrus grove activities continued and included general maintenance and removal of dead trees; dry weather also resulted in increased irrigation for citrus. With unseasonably warm temperatures during February, chill hours for northern Florida and nearby areas are below last year’s accumulation and much less than historical averages. North Florida experienced only 1-2 days with temperatures at or below 32F during the month. The recent warm weather has resulted in early leaf out and the blooming of many fruits across the region. Several fruits and vegetables were planted and harvested during the month, such as green beans, yellow squash, potatoes, strawberries, sweet corn, pepper, and avocadoes. Rice planting began as well. For more information, consult the Crop Progress - State Stories reports, which are produced monthly December through March by the USDA’s National Agricultural Statistics Service.
Appendix 1
Additional February departures from normal data for select Florida locations (Source: NWS).
| Station | Average Temperature (˚F) | Departure from Normal (˚F) | Total Rainfall (in.) | Departure from Normal (in.) |
| Gainesville | 65.6 | +7.2 | 2.46 | -0.21 |
| Sarasota | 69.4 | +4.6 | 0.15 | -1.77 |
| Melbourne | 69.9 | +4.5 | 1.61 | -0.37 |
| Fort Myers | 73.6 | +6.3 | 0.07 | -1.71 |
| West Palm Beach | 74.1 | +5.7 | 1.14 | -1.49 |
Appendix 2
Select daily record high maximum temperatures (°F) broken or tied during February (compiled from NOAA).
| Location | Date | Record | Broken/Tied | Last |
| Hastings | 1 | 85 | Tied | 85 in 2002 |
| Miami | 1 | 85 | Broken | 84 in 1990 |
| Key West | 1 | 89 | Broken | 83 in 2007 |
| Fort Lauderdale | 2 | 84 | Broken | 83 in 2014 |
| Jacksonville Beach | 2 | 84 | Broken | 83 in 1985 |
| Key West | 2 | 89 | Broken | 85 in 2007 |
| Miami | 3 | 88 | Broken | 85 in 1985 |
| Vero Beach | 3 | 87 | Broken | 83 in 2019 |
| West Palm Beach | 3 | 87 | Broken | 86 in 1985 |
| Key West | 3 | 90 | Broken | 85 in 2022 |
| Fort Lauderdale | 4 | 89 | Broken | 87 in 2007 |
| Key West | 6 | 89 | Broken | 85 in 1997 |
| Key West | 7 | 89 | Broken | 83 in 2019 |
| Pensacola | 8 | 77 | Broken | 75 in 1994 |
| Key West | 8 | 90 | Broken | 86 in 2022 |
| Gainesville | 9 | 85 | Broken | 83 in 1990 |
| Key West | 9 | 91 | Broken | 84 in 1994 |
| Usher Tower | 10 | 85 | Broken | 82 in 2018 |
| Key West | 11 | 90 | Broken | 85 in 2020 |
| Crestview | 15 | 80 | Broken | 78 in 2018 |
| Clermont | 17 | 88 | Broken | 86 in 2001 |
| Jacksonville Beach | 17 | 87 | Broken | 83 in 1945 |
| Orlando | 17 | 88 | Broken | 87 in 1990 |
| Daytona Beach | 17 | 87 | Tied | 87 in 1975 |
| Lakeland | 17 | 88 | Broken | 87 in 1990 |
| Jacksonville | 17 | 86 | Broken | 83 in 2022 |
| Melbourne | 18 | 88 | Broken | 86 in 2001 |
| Vero Beach | 20 | 88 | Broken | 86 in 1988 |
| Clermont | 23 | 89 | Broken | 88 in 2018 |
| Jacksonville Beach | 23 | 88 | Broken | 83 in 2012 |
| Naples | 23 | 89 | Tied | 89 in 2019 |
| Miles City | 23 | 92 | Broken | 90 in 2006 |
| Pensacola | 23 | 80 | Broken | 78 in 1975 |
| Key West | 23 | 92 | Broken | 88 in 1997 |
| Pensacola | 23 | 83 | Broken | 79 in 2017 |
| Tallahassee | 23 | 84 | Broken | 83 in 2022 |
| Jacksonville | 23 | 89 | Broken | 84 in 2019 |
| Hastings | 24 | 87 | Broken | 84 in 2022 |
| Tampa | 24 | 88 | Broken | 87 in 2022 |
| Fort Myers | 24 | 90 | Broken | 89 in 2022 |
| Tallahassee | 24 | 86 | Broken | 84 in 1944 |
| Clermont | 25 | 89 | Tied | 89 in 2019 |
| Miles City | 25 | 90 | Broken | 88 in 2022 |
| Pensacola | 25 | 83 | Broken | 82 in 2011 |
| Jacksonville Beach | 26 | 90 | Broken | 84 in 1972 |
| Pensacola | 26 | 79 | Broken | 77 in 2001 |
| Miami | 26 | 87 | Tied | 87 in 2015 |
| Key West | 26 | 88 | Broken | 86 in 2022 |
| Crestview | 26 | 84 | Broken | 82 in 2021 |
| Tallahassee | 26 | 85 | Broken | 83 in 2022 |
| Jacksonville | 26 | 87 | Tied | 87 in 1962 |
| Jacksonville Beach | 27 | 85 | Broken | 84 in 1945 |
| Key West | 27 | 89 | Broken | 86 in 1997 |
| Pensacola | 27 | 81 | Broken | 80 in 1981 |
| Pensacola | 28 | 84 | Broken | 79 in 2021 |