


Prepared by Florida Climate Center
The Florida State University
Tallahassee, FL

Key Points:
- Monthly average temperatures in October were below to near normal across the state.
- Precipitation was below normal across the state and, as we head into the dry season, drought is an increasing concern.
- Drought developed in the western Panhandle during the month; areas of severe drought (D2) spread eastward into parts of Leon and Wakulla Counties as of November 1st. Abnormally dry conditions (D0) spread as far east as Nassau County. Hurricane Ian eliminated drought and dry conditions in southeastern Florida.
- A La Niña advisory continues with a 75% chance of persisting through the winter from December-February.
Average monthly temperatures in October were generally below to near normal across the state. Average temperature departures from normal ranged from -3.1 ̊F in Tallahassee to +0.4 ̊F in Miami for the month (see Table 1 and Appendix 1 for select cities). A ridge of high pressure dominated the weather pattern early in the month, with cooler fall-like temperatures and lower humidity in much of the state. This was followed by a very strong trough across the Southeast U.S., which brought arctic air to northern parts of the state during the middle of the month. Many places in north and central Florida experienced record low temperatures. On the 20th, Tallahassee recorded a daily record low of 31°F and Pensacola recorded a low of 40°F, which was 26°F and 20°F below the normal daily low temperature for this date, respectively. Cross City smashed its record low on the 20th at 31°F, which was previously 42°F set on this date in 2011. Most places across north Florida saw several nights with minimum temperature 15-20°F below normal from the 19th-22nd. The month ended with much warmer than normal temperatures, as daily maximum temperatures climbed to around +10°F above normal across north and central Florida on the 31st. Daily low minimum temperature records tied or broken during the month are provided in Appendix 2.
Table 1. October average temperatures and departures from normal ( ̊F) for selected cities.
| Station | Mean Temperature | Departure from Normal |
| Pensacola | 69.2 | -2.1 |
| Tallahassee | 67.2 | -3.1 |
| Jacksonville | 68.5 | -2.7 |
| Orlando | 75.7 | +0.2 |
| Tampa | 75.7 | -1.7 |
| Miami | 80.5 | +0.4 |
| Key West | 80.1 | -1.2 |
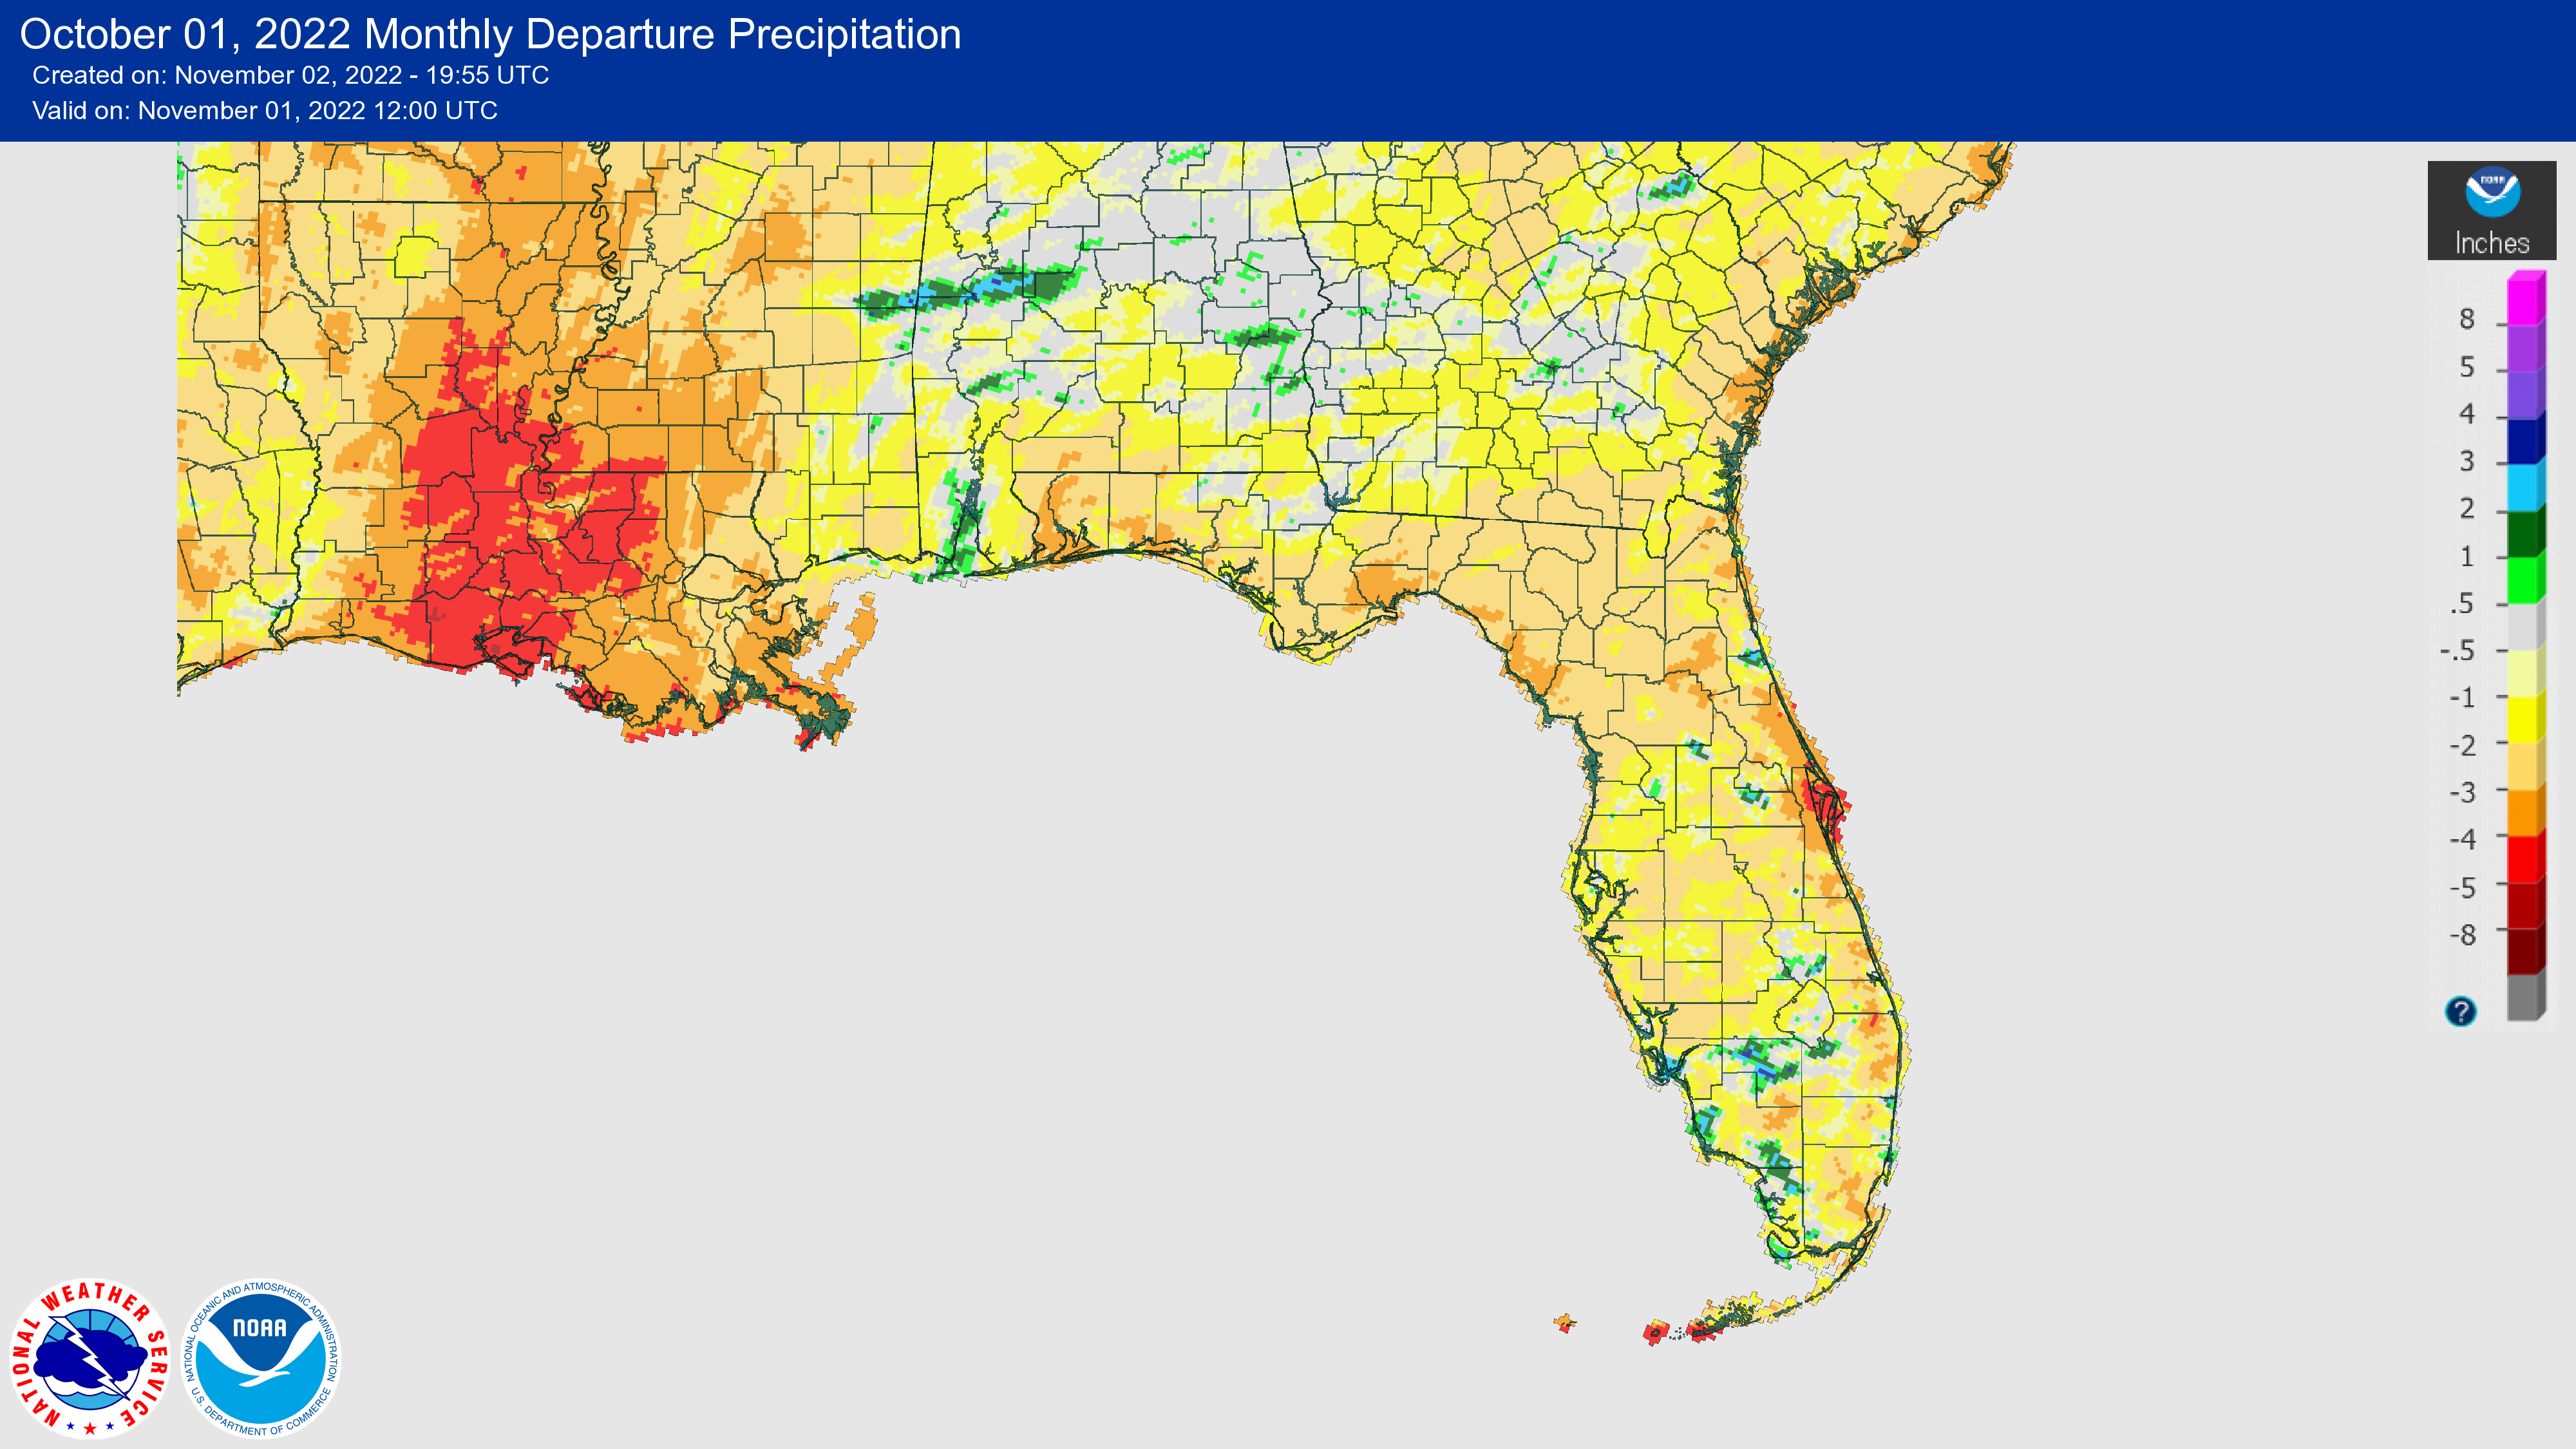
Monthly rainfall totals in October were below normal. The monthly precipitation departures from normal ranged from -3.55 inches in Pensacola to -1.24 inches in Tampa (see Table 2 and Appendix 1 for additional locations). Continued dryness in the Panhandle has led to the development of drought across the region (see drought section below). Annual precipitation surpluses in Pensacola and Tallahassee continue to shrink due to below-normal rainfall over the past couple of months, now at just +2.3 and +2.4 inches above normal for the year, respectively. Areas of the southeast coast are around 10 inches below normal for the year so far, including Vero Beach (-10.8 in.), Stuart (-13.3 in.), West Palm Beach (-10.8 in.), and Ft. Lauderdale (-15.6 in.). A late month system brought some rain but not enough to alleviate drought concerns. Dry conditions are expected to persist into November.
Table 2. October precipitation totals and departures from normal (inches) for selected cities.
| Station | Total Rainfall | Departure from Normal |
| Pensacola | 1.15 | -3.55 |
| Tallahassee | 0.22 | -3.02 |
| Jacksonville | 1.60 | -2.43 |
| Orlando | 2.14 | -1.32 |
| Tampa | 1.10 | -1.24 |
| Miami | 4.85 | -2.80 |
| Key West | 2.78 | -2.89 |
Figure 1. A graphical depiction of the monthly rainfall departure from normal (inches) for October (courtesy of NOAA, NWS).
La Niña Advisory.
La Niña is expected to continue through the Northern Hemisphere winter, with a 75% chance in December-February. There is a 54% chance for a transition to ENSO-neutral conditions during February-April 2023. Below average sea surface temperatures remained in the eastern equatorial Pacific Ocean during September, and overall the coupled ocean-atmosphere system continues to reflect La Niña. There is still some uncertainty over how long La Niña may last. The next ENSO update is scheduled for November 10.
Hazardous Weather Events in October.
According to the Local Storm Reports issued by the local National Weather Service offices serving Florida, there were 56 individual local reports of hazardous weather events recorded across the state during the month of October (see Table 4 for a breakdown by event type). Thunderstorm activity produced isolated heavy rain of several inches during the middle and end of the month in Orange County. There were several small tornadoes during the latter half of the month, but no injuries or fatalities were reported.
Table 4. Breakdown of storm reports submitted in Florida during the month of October (compiled from Iowa State University/Iowa Environmental Mesonet).
| Report Type | Number of Reports |
| Flash Flood | 1 |
| Heavy Rain | 13 |
| Flood | 8 |
| Lightning | 0 |
| Hail | 11 |
| Marine Thunderstorm Wind | 1 |
| Non-Thunderstorm Wind Gust | 0 |
| Non-Thunderstorm Wind Damage | 0 |
| Tornado/Waterspout/Funnel Cloud | 4/6/1 |
| Thunderstorm Wind Damage | 1 |
| Thunderstorm Wind Gust | 10 |
| Wildfire | 0 |
Daily Record Events in October.
Table 5.Summary of daily records broken or set in Florida in October (source: NCEI Daily Weather Records).
| Category | Number of Records |
| Highest daily max. temp. | 9 |
| Highest daily min. temp. | 4 |
| Lowest daily max. temp. | 26 |
| Lowest daily min. temp. | 30 |
| Highest daily precipitation | 7 |
| Total | 76 |
Weather/Climate Highlight of the Month:
Early season cold temperatures affected the Panhandle and North Florida during the middle of the month. Minimum temperatures dipped down to 31°F in Tallahassee and 37°F in Gainesville on the 20th, which was 26°F and 22°F below normal for this day, respectively. In Tallahassee, freezing temperatures in October have occurred 10 times in the past since 1940, most recently in 2008.
Drought-Related Impacts.
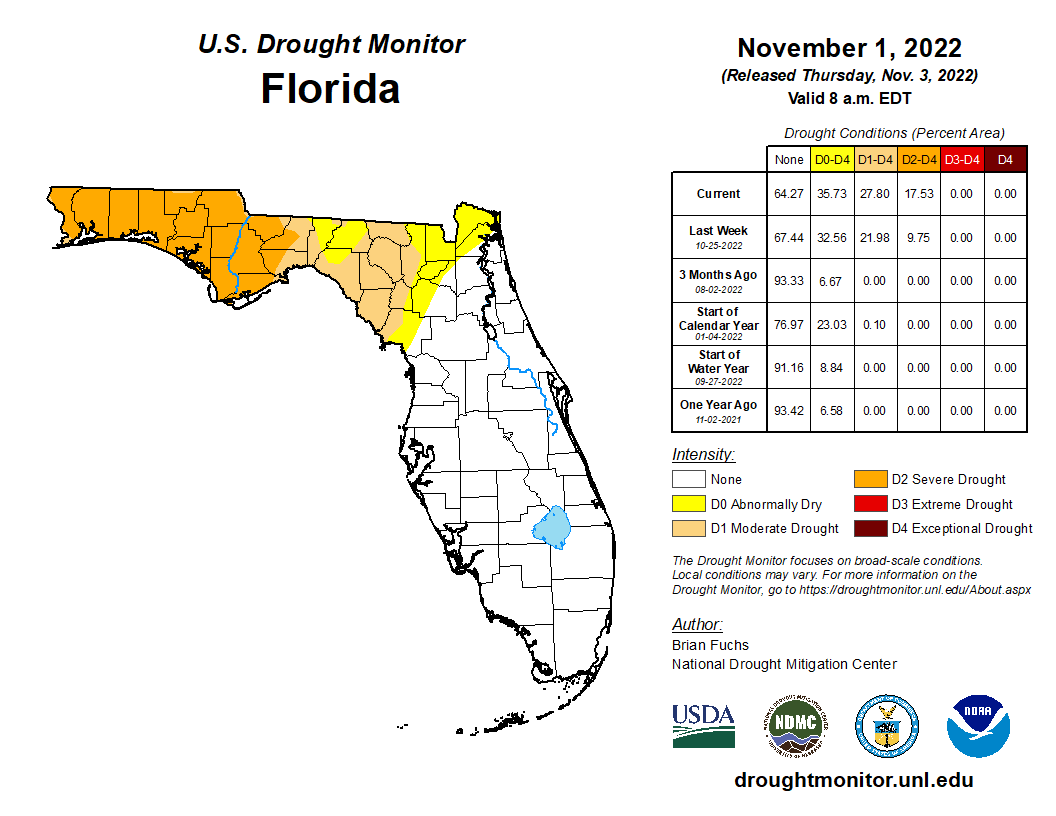
At the beginning of October, abnormally dry conditions expanded and worsened in the western Panhandle. About 7.5% of the area was experiencing abnormally dry conditions (D0) and 4% was in moderate drought (D1), according to the U.S. Drought Monitor. Throughout the month, little rainfall caused drought conditions to expand across the Panhandle and gradually moved east across North Florida. By the end of the month, 17.53% of the state was in severe drought (D2), 10.28% was in moderate drought (D1), and 7.92% was abnormally dry (D0) (Figure 2 below). Local drought impacts are high for grasslands and agriculture, while hydrological impacts remain low except in the Apalachicola-Chattahoochee-Flint (ACF) River Basin and the Big Bend region where streamflows are running much below normal.
As of October 31, the Lake Okeechobee water level was 15.85 ft. above sea level (Feet-NGVD29), which is above average for this time of the year. The water level rose throughout the month and has rebounded by over 2 feet since Hurricane Ian’s passage. At the first of the month, the water level was 13.87 ft. above sea level.
Figure 2. A graphical depiction of the current drought conditions in Florida according to the U.S. Drought Monitor (courtesy of the National Drought Mitigation Center, University of Nebraska-Lincoln).
Agriculture-Related Impacts.
In mid-October, topsoil moisture conditions were adequate in 51% of the state, short in 15%, and very short in 12% of the state, while 22% of the state was in surplus. At the end of October, topsoil moisture levels were adequate in 61% of the state, short in 22%, and very short in 10% of the state; 7% of the state was in surplus. Agricultural losses from Hurricane Ian are estimated to be approximately $417 million - $675 million to citrus, $153 million - $230 million to other fruits and vegetables, $86 to $160 million to field crops, $153 - $297 million to horticultural crops, $337 million - $492 million to animals and animal products, and $33 million to forestry, according to the Florida Department of Agriculture and Consumer Services. For more information, consult the Crop Progress and Conditions report, which is published by the USDA's National Agricultural Statistics Service.
Appendix 1
Additional October departures from normal data for select Florida locations (Source: NWS).
| Station | Average Temperature (˚F) | Departure from Normal (˚F) | Total Rainfall (in.) | Departure from Normal (in.) |
| Gainesville | 69.1 | -2.3 | 0.16 | -2.52 |
| Sarasota | 75.3 | -2.0 | 1.78 | -0.98 |
| Melbourne | 74.8 | -2.7 | 1.88 | -2.98 |
| Fort Myers | 78.1 | +0.1 | 1.59 | -1.49 |
| West Palm Beach | 78.4 | -0.3 | 2.66 | -3.24 |
Appendix 2
Select daily record low minimum temperatures (°F) broken or tied during October (compiled from NOAA).
| Location | Date | Record | Broken/Tied | Last |
| Moore Haven Lock | 1 | 62 | Broken | 64 in 1993 |
| Naples | 2 | 57 | Broken | 58 in 1976 |
| Plant City | 3 | 53 | Broken | 54 in 1929 |
| Cross City | 5 | 45 | Broken | 48 in 2014 |
| Lisbon | 13 | 47 | Broken | 52 in 1980 |
| Apalachicola | 19 | 39 | Broken | 45 in 1996 |
| Jacksonville Beach | 19 | 47 | Broken | 48 in 1967 |
| Jasper | 19 | 36 | Broken | 38 in 2009 |
| Marianna | 19 | 36 | Tied | 36 in 2009 |
| Pensacola | 19 | 37 | Broken | 41 in 1989 |
| Gainesville | 19 | 38 | Broken | 41 in 2009 |
| Cross City | 19 | 37 | Tied | 37 in 2009 |
| Lakeland | 19 | 51 | Broken | 52 in 1955 |
| Crestview | 19 | 33 | Tied | 33 in 2009 |
| Jacksonville | 19 | 42 | Broken | 43 in 2009 |
| Tallahassee | 19 | 33 | Broken | 36 in 2009 |
| Apalachicola | 20 | 36 | Broken | 42 in 1989 |
| Cross City | 20 | 33 | Broken | 34 in 1967 |
| Jasper | 20 | 33 | Broken | 35 in 1967 |
| Lisbon | 20 | 44 | Broken | 45 in 1989 |
| Ocala | 20 | 40 | Tied | 40 in 1981 |
| Perry | 20 | 31 | Broken | 34 in 1989 |
| Usher Tower | 20 | 36 | Broken | 38 in 1967 |
| Marianna | 20 | 34 | Broken | 41 in 2011 |
| Gainesville | 20 | 37 | Broken | 38 in 1989 |
| Cross City | 20 | 31 | Broken | 42 in 2011 |
| Crestview | 20 | 28 | Broken | 31 in 1989 |
| Jacksonville | 20 | 39 | Broken | 40 in 1989 |
| Tallahassee | 20 | 31 | Broken | 34 in 1996 |
| Quincy | 21 | 33 | Tied | 33 in 1989 |
| Marianna | 21 | 38 | Broken | 40 in 2011 |
| Cross City | 21 | 35 | Broken | 37 in 2011 |
| Apalachicola | 22 | 42 | Broken | 44 in 1987 |