


Prepared by Florida Climate Center
The Florida State University
Tallahassee, FL

Key Points:
- Average temperatures in August were near normal in the Panhandle and above normal in Peninsular Florida.
- Abnormally dry conditions expanded in east-central and southeastern Florida during the month, with moderate drought emerging in Brevard and Indian River Counties.
- La Niña is expected to continue through the winter, with chances decreasing to 60% during December-February 2022-23.
- Tropical activity remained quiet and August 2022 became the first time since 1997 with no named storms in the Atlantic basin.
Average temperatures in August were near normal in the Panhandle and above normal in Peninsular Florida. Average temperature departures from normal ranged from -0.6 ̊F in Key West to +2.4 ̊F in West Palm Beach for the month (see Table 1 and Appendix 1 for select cities). Many locations experienced their hottest August on record based on mean monthly temperatures, including Clermont, Tampa, Fort Myers, West Palm Beach, and Hollywood; many other locations recorded one of their top five warmest Augusts on record. Overnight temperatures have been especially warm in south Florida. Summer of 2022 (June-August) has been warmer than normal overall, and most stations in the state had one of their top ten hottest summers on record. Many daily high maximum and high minimum temperature records were set (see appendix 2 for select daily high maximum records).
Table 1. August average temperatures and departures from normal ( ̊F) for selected cities.
| Station | Mean Temperature | Departure from Normal |
| Pensacola | 82.8 | -0.2 |
| Tallahassee | 81.9 | -0.5 |
| Jacksonville | 81.6 | -0.5 |
| Orlando | 84.7 | +2.1 |
| Tampa | 85.6 | +1.6 |
| Miami | 85.6 | +1.4 |
| Key West | 84.9 | -0.6 |
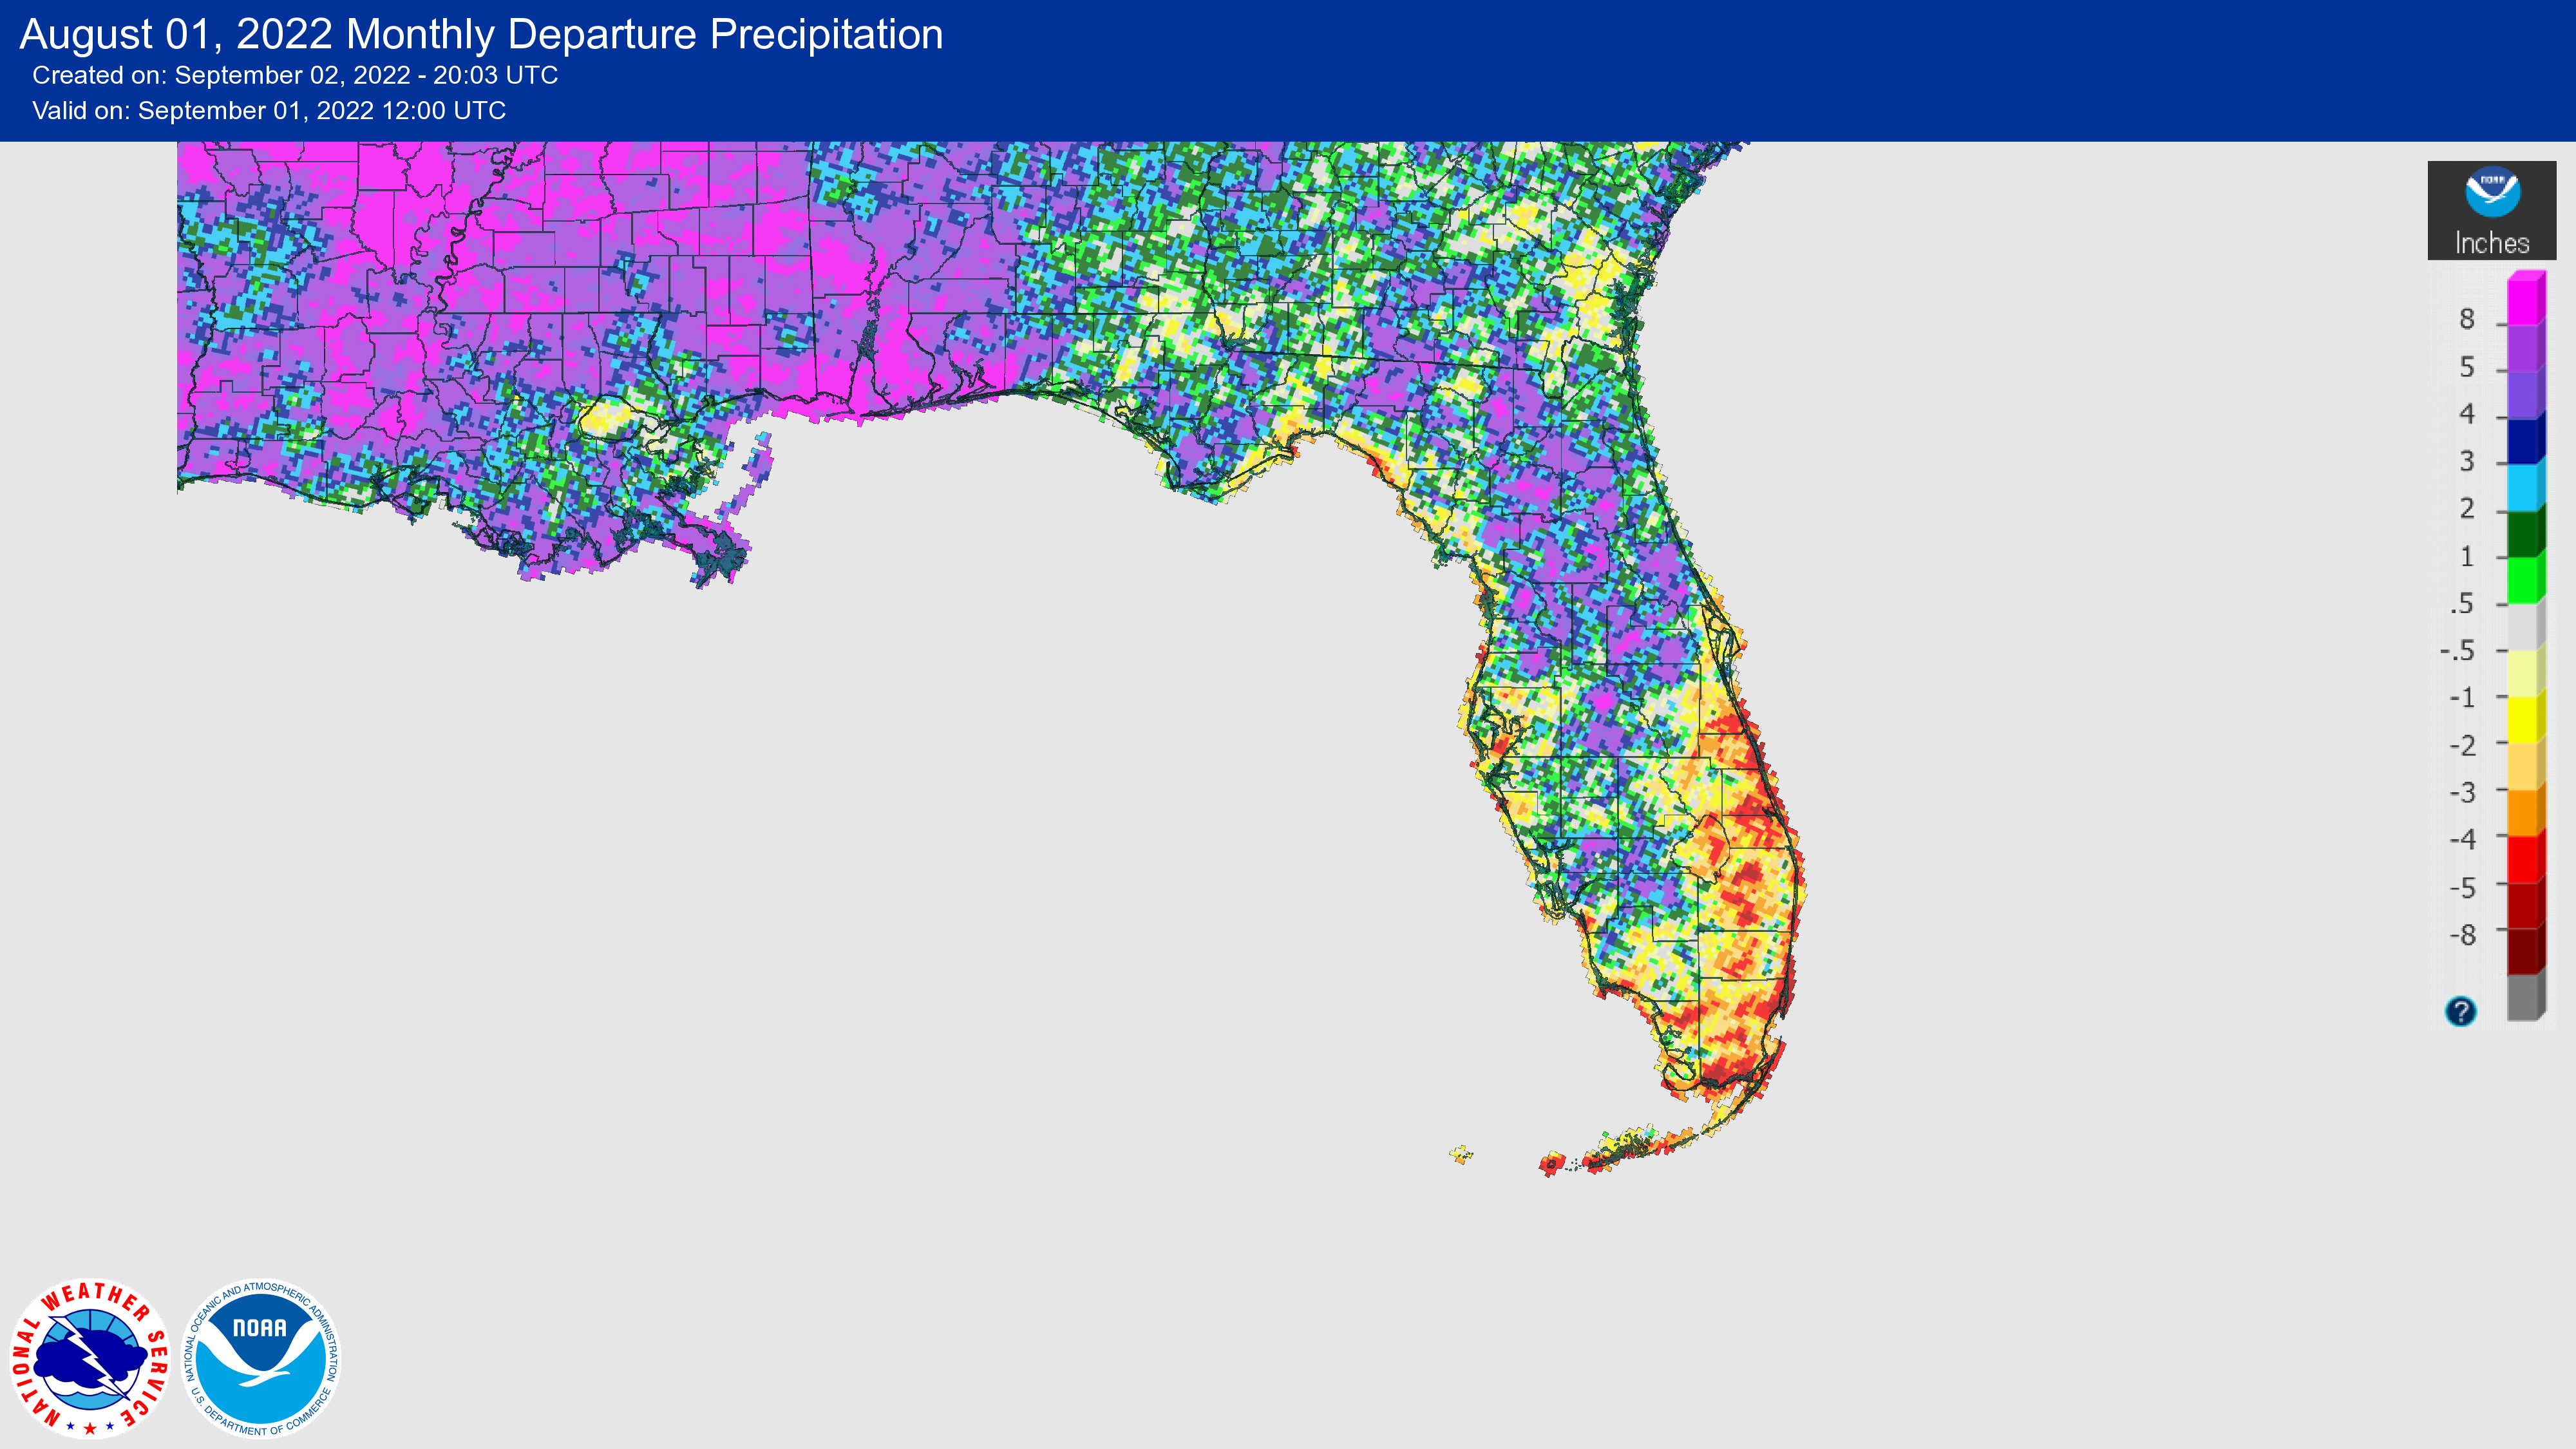
Rainfall totals in August were above normal across north Florida and below normal in central and south Florida. The monthly precipitation departures from normal ranged from -5.56 inches in West Palm Beach to +5.33 inches in Gainesville (Table 2 and Appendix 1). The pattern of unsettled weather continued in August across the Panhandle, with ample rain falling across much of northern Florida. Pensacola set a new daily rainfall record of 4.59 inches on the 11th (39% of its monthly rainfall total). The annual rainfall surplus to date is 10.2 inches in Pensacola, 8.0 inches in Tallahassee, and 9.6 inches in Gainesville. While thunderstorm activity picked up across the Florida Peninsula during the month, some areas continue to see below normal rainfall, especially in southeastern Florida. Year-to-date rainfall deficits include: 12.0 inches in Vero Beach, 13.2 inches in Stuart, 11.4 inches in West Palm Beach, and 5.2 inches in Orlando and Miami.
Table 2. August precipitation totals and departures from normal (inches) for selected cities.
| Station | Total Rainfall | Departure from Normal |
| Pensacola | 11.76 | +4.26 |
| Tallahassee | 8.47 | +0.87 |
| Jacksonville | 10.40 | +3.52 |
| Orlando | 7.88 | +0.19 |
| Tampa | 6.51 | +2.52 |
| Miami | 5.17 | -4.41 |
| Key West | 2.33 | -3.04 |
Figure 1. A graphical depiction of the monthly rainfall departure from normal (inches) for August (courtesy of NOAA, NWS).
La Niña Advisory.
La Niña is expected to continue through the winter, with chances decreasing to 60% during December-February 2022-23. Below average sea surface temperatures expanded across the central-eastern equatorial Pacific Ocean during the past month, and overall the coupled ocean-atmosphere system remained consistent with an ongoing La Niña. Looking ahead, La Niña is projected to be the most likely outcome during fall and winter, while most models suggest a transition to ENSO-neutral conditions in January-March 2023, though much uncertainty remains that far out.
Hazardous Weather Events in August.
According to the Local Storm Reports issued by the local National Weather Service offices serving Florida, there were 432 individual local reports of hazardous weather events recorded across the state during the month of August (see Table 4 for a breakdown by event type). Thunderstorms and locally heavy rainfall occurred throughout the month, with many locations reporting 3-5 inches of daily rainfall. Reports of 5.26 inches and 6.45 inches of rain in 2 hours were reported on the 14th in Gadsden County. Several waterspouts were reported, as well as two tornadoes, during the month.
Table 4. Breakdown of storm reports submitted in Florida during the month of August (compiled from Iowa State University/Iowa Environmental Mesonet).
| Report Type | Number of Reports |
| Flash Flood | 5 |
| Heavy Rain | 55 |
| Flood | 28 |
| Hail | 41 |
| Lightning | 20 |
| Marine Thunderstorm Wind | 60 |
| Non-Thunderstorm Wind Gust | 11 |
| Non-Thunderstorm Wind Damage | 0 |
| Tornado/Waterspout/Funnel Cloud | 2/28/11 |
| Thunderstorm Wind Damage | 55 |
| Thunderstorm Wind Gust | 115 |
| Wildfire | 1 |
Daily Record Events in August.
Table 5.Summary of daily records broken or set in Florida in August (source: NCEI Daily Weather Records).
| Category | Number of Records |
| Highest daily max. temp. | 42 |
| Highest daily min. temp. | 34 |
| Lowest daily max. temp. | 8 |
| Lowest daily min. temp. | 11 |
| Highest daily precipitation | 11 |
| Total | 106 |
Weather/Climate Highlight of the Month.
The tropics remained quiet with no named storms in August. This is the first time since 1997 with no named storms in the Atlantic basin in August, and only the third time since record keeping began.
Drought-Related Impacts.
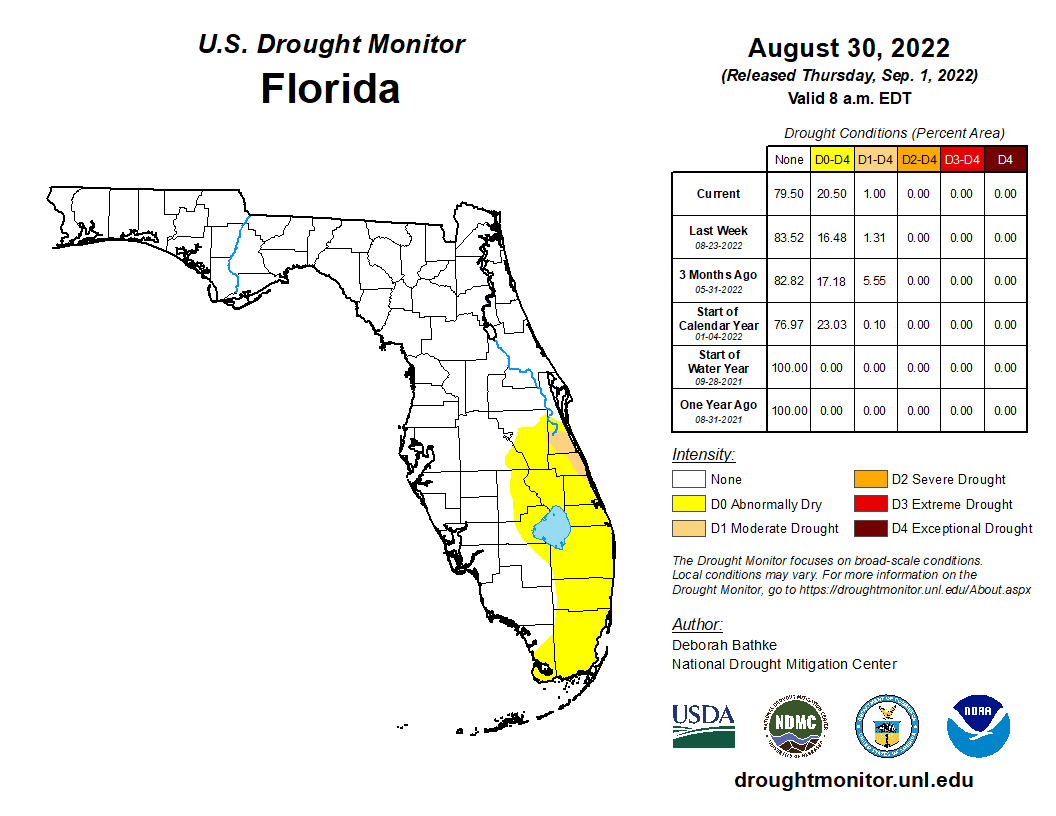
At the beginning of August, small pockets of abnormally dry conditions (D0) impacted parts of the state. As of August 2, approximately 6.7% of the state had abnormally dry conditions, according to the U.S. Drought Monitor. Abnormally dry conditions expanded throughout the month across the eastern Florida Peninsula and southeast Florida and a small area of moderate drought (D1) emerged. As of August 30, 19.5% of the state was in abnormally dry conditions and 1% was in moderate drought (Figure 2 below).
As of August 31, the Lake Okeechobee water level was 12.57 ft. above sea level (Feet-NGVD29), which is below average for this time of the year and is approaching water shortage management levels. At the first of the month, the water level was 12.94 ft. above sea level.
Figure 2. A graphical depiction of the current drought conditions in Florida according to the U.S. Drought Monitor (courtesy of the National Drought Mitigation Center, University of Nebraska-Lincoln).
Agriculture-Related Impacts.
In mid-August, topsoil moisture conditions were adequate in 79% of the state, short in 13%, and very short in 3% of the state, while 5% of the state had surplus topsoil moisture conditions. Near the end of August, topsoil moisture had slightly improved with levels adequate in 78% of the state, short in 7%, and very short in 1% of the state; 14% of the state was in surplus. Warm overnight temperatures in South Florida affected some crops during the month, like corn. For more information, consult the Crop Progress and Conditions report, which is published by the USDA's National Agricultural Statistics Service.
Appendix 1
Additional August departures from normal data for select Florida locations (Source: NWS).
| Station | Average Temperature (˚F) | Departure from Normal (˚F) | Total Rainfall (in.) | Departure from Normal (in.) |
| Gainesville | 82.1 | +0.8 | 11.73 | +5.33 |
| Sarasota | 82.9 | -0.5 | 8.91 | -0.20 |
| Melbourne | 83.5 | +0.1 | 4.87 | -1.80 |
| Fort Myers | 85.2 | +1.8 | 10.52 | +0.09 |
| West Palm Beach | 85.6 | +2.4 | 3.12 | -5.56 |
Appendix 2
Select daily record high maximum temperatures broken or tied during August (compiled from NOAA).
| Location | Date | Record (˚F) | Broken/Tied | Last |
| Bradenton | 1 | 96 | Broken | 95 in 2010 |
| Plant City | 1 | 99 | Broken | 98 in 1961 |
| Orlando | 1 | 98 | Broken | 97 in 2010 |
| Key West | 1 | 96 | Broken | 94 in 2021 |
| Clermont | 2 | 99 | Broken | 97 in 2016 |
| Plant City | 2 | 100 | Broken | 97 in 2020 |
| Miles City | 2 | 97 | Tied | 97 in 2006 |
| Tampa | 2 | 96 | Broken | 95 in 2005 |
| Clermont | 3 | 99 | Broken | 97 in 2016 |
| Plant City | 3 | 100 | Broken | 96 in 2020 |
| Key West | 3 | 96 | Broken | 94 in 2021 |
| Plant City | 4 | 99 | Broken | 98 in 1899 |
| Key West | 4 | 96 | Broken | 94 in 2020 |
| Clermont | 5 | 98 | Broken | 97 in 1972 |
| Tampa | 5 | 96 | Broken | 95 in 1993 |
| Key West | 5 | 95 | Tied | 95 in 2011 |
| Tampa | 6 | 95 | Tied | 95 in 1987 |
| Key West | 6 | 95 | Broken | 94 in 2019 |
| Plant City | 7 | 98 | Tied | 98 in 2021 |
| Tarpon Springs | 7 | 97 | Broken | 96 in 2017 |
| Jacksonville Beach | 16 | 97 | Broken | 95 in 2020 |
| Vero Beach | 16 | 96 | Tied | 96 in 1945 |
| Clermont | 17 | 98 | Tied | 98 in 1951 |
| Miami | 17 | 96 | Broken | 95 in 1991 |
| Vero Beach | 17 | 98 | Broken | 95 in 1987 |
| Key West | 17 | 95 | Broken | 94 in 2020 |
| Vero Beach | 18 | 96 | Broken | 94 in 1984 |
| Plant City | 18 | 99 | Broken | 98 in 1896 |
| Miami | 18 | 96 | Broken | 95 in 2017 |
| Fort Lauderdale | 19 | 95 | Broken | 93 in 1964 |
| Tampa | 20 | 97 | Broken | 96 in 2007 |
| Gainesville | 20 | 95 | Tied | 95 in 2021 |
| Fort Myers | 20 | 98 | Tied | 98 in 1987 |
| Key West | 20 | 97 | Broken | 95 in 2010 |
| Clermont | 21 | 99 | Broken | 98 in 2021 |
| Key West | 21 | 97 | Broken | 93 in 2021 |
| Plant City | 23 | 100 | Broken | 98 in 2021 |
| Key West | 23 | 95 | Broken | 94 in 2020 |
| Key West | 24 | 96 | Broken | 94 in 2021 |
| Plant City | 26 | 99 | Broken | 97 in 1914 |
| Key West | 26 | 96 | Broken | 94 in 2007 |
| Key West | 30 | 95 | Broken | 93 in 2020 |
| Plant City | 31 | 100 | Tied | 100 in 2017 |