


Prepared by Florida Climate Center
The Florida State University
Tallahassee, FL

Key Points:
- Average temperatures in Florida were generally near to above normal in June; extreme heat with triple digit temperatures affected many locations during mid and late June.
- Rainfall totals for the month were variable, with south Florida receiving above normal rainfall.
- Tropical Storm Alex formed in the Atlantic Ocean on June 5 after passing over south Florida on June 4. The storm generated heavy rainfall and flash flooding; it passed quickly over Florida and eastward out over the Atlantic Ocean.
- La Niña conditions are still favored to continue into early fall, with a 60% chance in July-September 2022; the chances of La Niña increase into early winter to 62-66%.
Average temperatures in June were generally near to above normal. Based on average temperatures for the month, this June was the 7th-warmest June on record for Florida, with a statewide average temperature +2.4 ̊F above normal for the month. Average temperature departures from normal ranged from -1.5 ̊F in Key West to +2.9 ̊F in Tallahassee for the month (see Table 1 and Appendix 1 for select cities). June was warm particularly across northern and central Florida. Pensacola observed its second warmest June on record based on average temperatures, just 2 ̊F shy of the record warmest June which occurred in 1952, and it had its record warmest month based on average minimum temperatures. Many locations recorded triple digit temperatures mid to late June. Several daily high maximum and minimum temperature records were tied or broken throughout the month (see appendix 2 for select daily high maximum records).
Table 1. June average temperatures and departures from normal ( ̊F) for selected cities.
| Station | Mean Temperature | Departure from Normal |
| Pensacola | 84.4 | +2.7 |
| Tallahassee | 83.7 | +2.9 |
| Jacksonville | 80.7 | +0.4 |
| Orlando | 83.5 | +2.3 |
| Tampa | 85.2 | +2.3 |
| Miami | 82.4 | -0.4 |
| Key West | 82.6 | -1.5 |
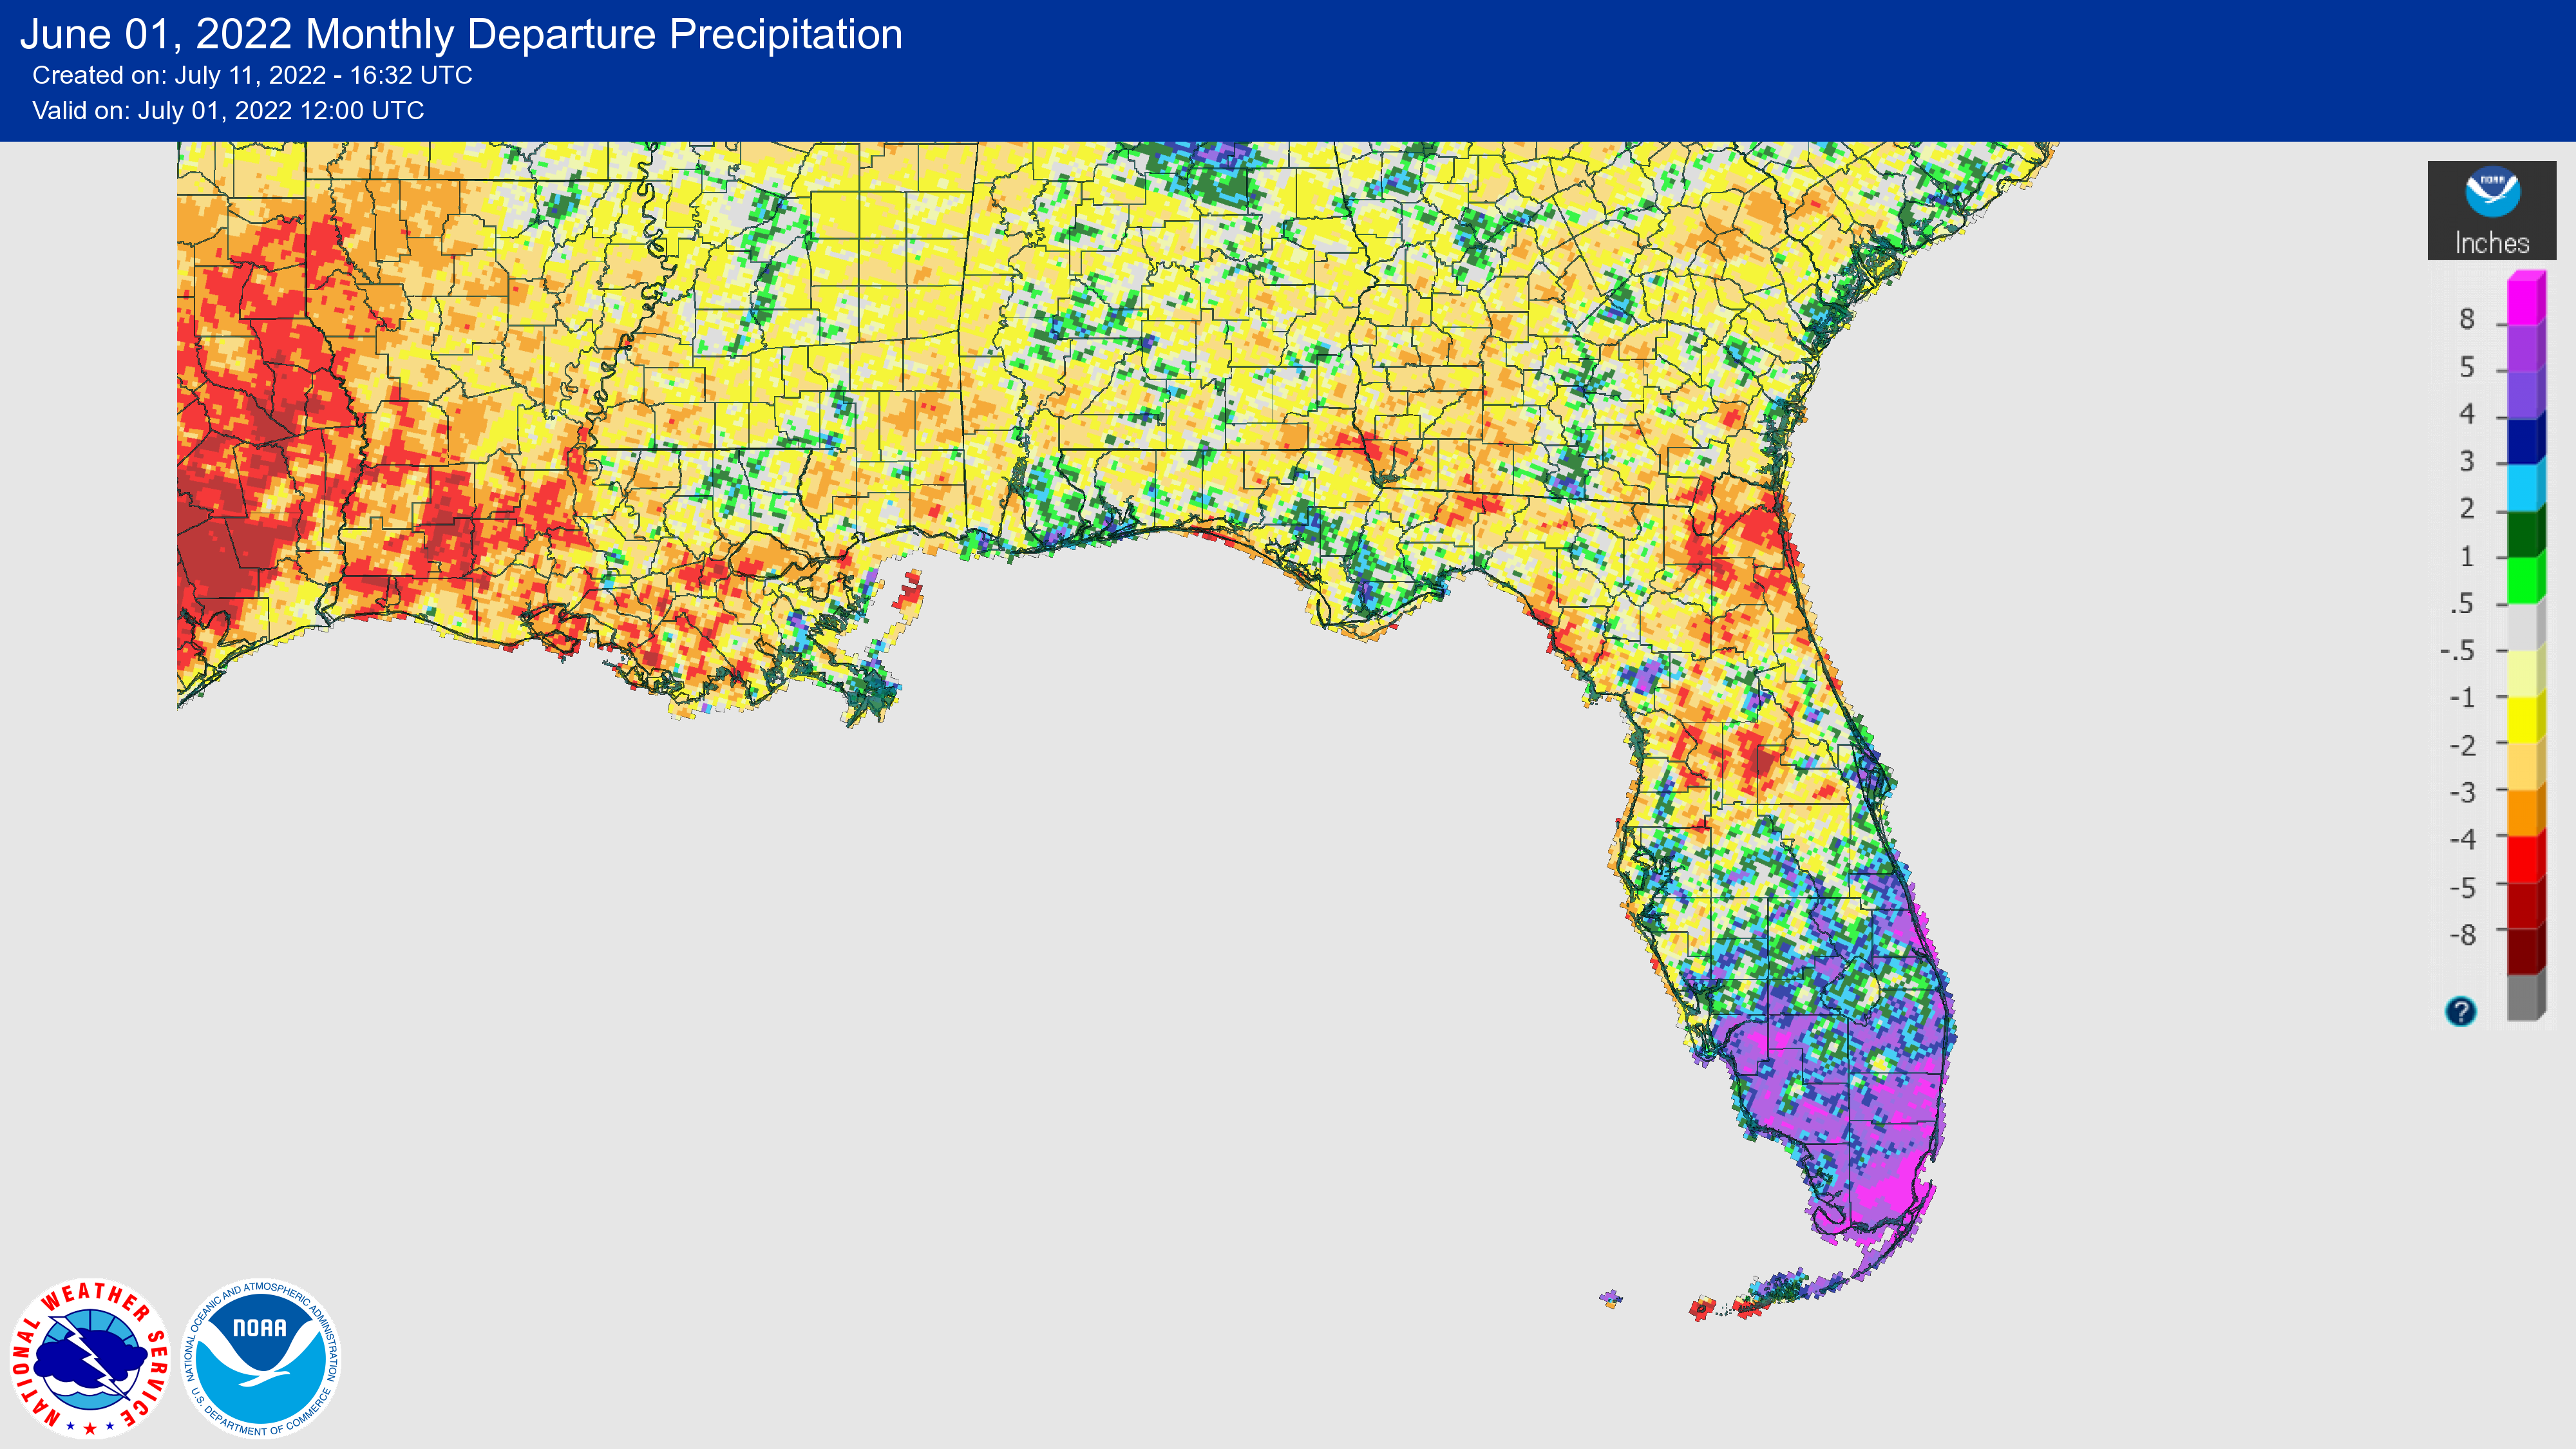
Rainfall totals in June were generally below normal in northern Florida, while south Florida was wetter than normal. Overall, June 2022 was the 62nd wettest June on record for the state. The monthly precipitation departures from normal ranged from -6.43 inches in Jacksonville to +5.10 inches in Miami (Table 2 and Appendix 1). Jacksonville had its driest June on record (based on a 75-year record), and Clermont had its second-driest June on record. Above normal rainfall in south Florida, including from Tropical Storm Alex, helped to alleviate drought in that area. Two-day rainfall totals from TS Alex, which passed over South Florida on June 4th, were as much as 14.85 inches in Hollywood, and 14.79 inches near Pompano Beach; Biscayne Park recorded 12.72 inches and Miami had over 11 inches.
Table 2. June precipitation totals and departures from normal (inches) for selected cities.
| Station | Total Rainfall | Departure from Normal |
| Pensacola | 7.39 | +0.07 |
| Tallahassee | 9.50 | +1.74 |
| Jacksonville | 1.17 | -6.43 |
| Orlando | 4.61 | -3.44 |
| Tampa | 8.07 | +0.70 |
| Miami | 15.61 | +5.10 |
| Key West | 6.61 | +2.38 |
Figure 1. A graphical depiction of the monthly rainfall departure from normal (inches) for June (courtesy of NOAA, NWS).
La Niña Advisory.
La Niña conditions in the equatorial Pacific Ocean continued in June. La Niña is now favored to continue into the late Northern Hemisphere summer (60% chance in July-September 2022), and it is expected to persist into the Northern Hemisphere winter 2022-23. The chances for La Niña to continue into the Northern Hemisphere fall and early winter have increased to a 62-66% chance. This will be the third year in a row with La Niña, which has only happened twice in the past ~70 years.
Hazardous Weather Events in June.
According to the Local Storm Reports issued by the local National Weather Service offices serving Florida, there were 483 individual local reports of hazardous weather events recorded across the state during the month of June (see Table 4 for a breakdown by event type). In early June, Tropical Storm Alex became the first named storm of the Atlantic hurricane season. The storm brought heavy rainfall and localized flash flooding to many parts of south Florida, including in Miami-Dade, Broward, Lee, and Collier counties. 2022 is expected to be the 7th year in a row with above normal hurricane activity in the Atlantic basin. The second named storm of the Atlantic Basin hurricane season occurs, on average, in mid-July.
Table 4. Breakdown of storm reports submitted in Florida during the month of June (compiled from Iowa State University/Iowa Environmental Mesonet).
| Report Type | Number of Reports |
| Flash Flood | 18 |
| Heavy Rain | 33 |
| Flood | 30 |
| Hail | 43 |
| Lightning | 5 |
| Marine Thunderstorm Wind | 49 |
| Non-Thunderstorm Wind Gust | 5 |
| Non-Thunderstorm Wind Damage | 0 |
| Tornado/Waterspout/Funnel Cloud | 4/18/5 |
| Thunderstorm Wind Damage | 95 |
| Thunderstorm Wind Gust | 145 |
| Rip Currents | 4 |
| Wildfire | 1 |
| High Sustained Winds | 1 |
| Tropical Storm | 27 |
Daily Record Events in June.
Table 5.Summary of daily records broken or set in Florida in June (source: NCEI Daily Weather Records).
| Category | Number of Records |
| Highest daily max. temp. | 40 |
| Highest daily min. temp. | 43 |
| Lowest daily max. temp. | 12 |
| Lowest daily min. temp. | 7 |
| Highest daily precipitation | 18 |
| Total | 120 |
Weather/Climate Highlight of the Month: Extreme Heat.
The state saw its first triple digit temperatures of the season in June. Clermont recorded a maximum temperature of 101 ̊F on the 16th, followed by Pensacola with a temperature of 100 ̊F on the 18th. Record heat affected the Panhandle and central Florida again from the 22nd-25th. The highest maximum temperature observed during the month was 104 ̊F in Crestview and Tallahassee on the 23rd and 24th, respectively, setting new daily records at both locations.
Drought-Related Impacts.
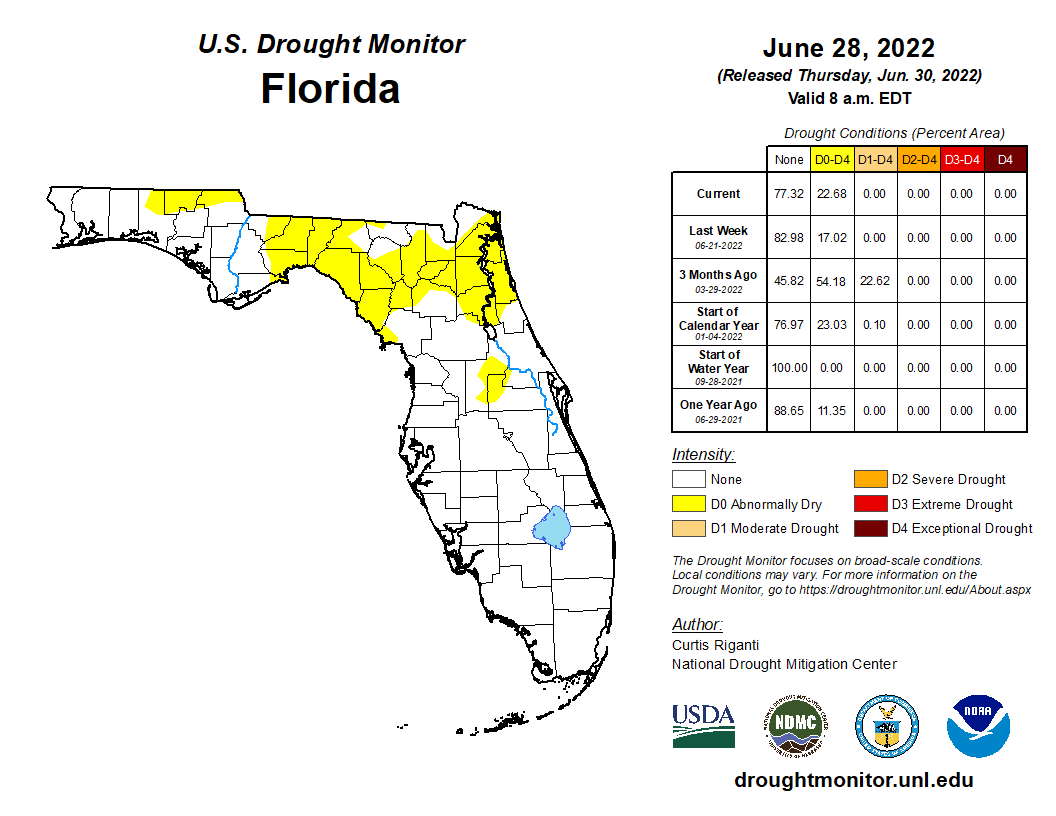
At the beginning of June, approximately 18% of the state was experiencing abnormally dry conditions (D0), and nearly 1% of the state was in moderate drought (D1), according to the U.S. Drought Monitor. As of June 28, moderate drought conditions had improved but about 23% of the state was in abnormally dry conditions (Figure 2 below).
As of June 30, the Lake Okeechobee water level was 12.92 ft. above sea level (Feet-NGVD29), which is below average for this time of the year. The water level remained below average throughout the month, though it did increase through mid-month to just below average levels before declining again. At the first of the month, the water level was 12.57 ft. above sea level.
Figure 2. A graphical depiction of the current drought conditions in Florida according to the U.S. Drought Monitor (courtesy of the National Drought Mitigation Center, University of Nebraska-Lincoln).
Agriculture-Related Impacts.
During mid-June, topsoil moisture conditions were adequate in 85% of the state, short in 12%, and very short in 2% of the state, while just 1% of the state had surplus moisture conditions. Near the end of June, topsoil moisture had declined somewhat with levels adequate in 68% of the state, short in 20%, and very short in 4% of the state; 8% of the state was in surplus. For more information, consult the Crop Progress and Conditions report, which is published by the USDA's National Agricultural Statistics Service.
Appendix 1
Additional June departures from normal data for select Florida locations (Source: NWS).
| Station | Average Temperature (˚F) | Departure from Normal (˚F) | Total Rainfall (in.) | Departure from Normal (in.) |
| Gainesville | 81.9 | +2.0 | 3.29 | -4.27 |
| Sarasota | 82.2 | +0.4 | 8.10 | +1.05 |
| Melbourne | 81.3 | +0.5 | 5.66 | -1.44 |
| Fort Myers | 82.8 | +0.5 | 14.08 | +4.42 |
| West Palm Beach | 82.1 | +0.4 | 9.02 | +0.54 |
Appendix 2
Select daily record high maximum temperatures broken or tied during June (compiled from NOAA).
| Location | Date | Record (˚F) | Broken/Tied | Last |
| Key West | 6 | 92 | Broken | 91 in 2020 |
| Orlando | 7 | 96 | Tied | 96 in 1993 |
| Clermont | 8 | 97 | Tied | 97 in 1951 |
| Jacksonville Beach | 8 | 98 | Broken | 97 in 1948 |
| Jacksonville Beach | 9 | 99 | Broken | 98 in 1981 |
| Key West | 13 | 95 | Broken | 94 in 2013 |
| Clermont | 15 | 98 | Tied | 98 in 1981 |
| Tampa | 15 | 95 | Tied | 95 in 2015 |
| Clermont | 16 | 101 | Tied | 101 in 1981 |
| Crestview | 16 | 99 | Broken | 98 in 2009 |
| Perry | 17 | 99 | Broken | 98 in 2010 |
| Tampa | 17 | 97 | Broken | 96 in 2009 |
| Pensacola | 18 | 100 | Broken | 99 in 1953 |
| Tampa | 18 | 98 | Broken | 96 in 2009 |
| Pensacola | 18 | 100 | Tied | 100 in 1953 |
| Clermont | 20 | 98 | Tied | 98 in 2000 |
| Key West | 21 | 95 | Broken | 93 in 1969 |
| Crestview | 22 | 103 | Broken | 102 in 2009 |
| Jacksonville Beach | 23 | 102 | Broken | 95 in 2020 |
| Marianna | 23 | 102 | Broken | 100 in 2009 |
| Mayport | 23 | 103 | Broken | 97 in 1991 |
| Orlando | 23 | 99 | Broken | 97 in 2011 |
| Cross City | 23 | 101 | Broken | 98 in 1998 |
| Daytona Beach | 23 | 101 | Broken | 100 in 1944 |
| Crestview | 23 | 104 | Broken | 101 in 2015 |
| Jacksonville | 23 | 100 | Broken | 99 in 1998 |
| Tallahassee | 23 | 103 | Tied | 103 in 1944 |
| Jacksonville | 23 | 103 | Broken | 102 in 1998 |
| Chipley | 24 | 100 | Tied | 100 in 2006 |
| Clermont | 24 | 100 | Broken | 99 in 1977 |
| Jacksonville Beach | 24 | 102 | Broken | 96 in 1950 |
| Plant City | 24 | 100 | Tied | 100 in 2020 |
| Quincy | 24 | 99 | Broken | 96 in 2000 |
| Marianna | 24 | 100 | Broken | 99 in 2010 |
| Orlando | 24 | 99 | Broken | 97 in 1998 |
| Gainesville | 24 | 98 | Broken | 97 in 2018 |
| Crestview | 24 | 103 | Broken | 99 in 2006 |
| Pensacola | 24 | 98 | Broken | 97 in 1998 |
| Tallahassee | 24 | 104 | Broken | 103 in 1944 |
| Chipley | 25 | 101 | Broken | 98 in 2010 |
| Clermont | 25 | 100 | Tied | 100 in 2016 |
| Lisbon | 25 | 98 | Tied | 98 in 1991 |
| Perry | 25 | 101 | Broken | 98 in 1996 |
| Wewahitchka | 25 | 101 | Broken | 98 in 1998 |
| Lisbon | 26 | 98 | Broken | 96 in 2020 |
| Key West | 29 | 94 | Broken | 93 in 2020 |