


Prepared by Florida Climate Center
The Florida State University
Tallahassee, FL

Key Points:
- Monthly average temperatures in May were near to above normal across the state.
- Rainfall totals for the month were above normal for many areas, particularly in the Panhandle and southwest regions.
- As of May 24, severe drought (D2) has been removed for most places, while moderate drought (D1) and abnormally dry (D0) conditions continue to impact parts of the state.
- La Niña conditions are favored to continue into the summer and fall, with a 58% chance in August-October 2022. The chances of La Nina occurring this fall and into early winter have increased to 61%.
Average temperatures in May continued to be near to above normal across the state. Average temperature departures from normal ranged from 0.0 ̊F in Key West to +2.5 ̊F in Orlando for the month (see Table 1 and Appendix 1 for select cities). Many stations across Florida recorded one of their top 5 warmest Mays on record, including Tampa (2nd-warmest), Jacksonville Beach (2nd-warmest), Orlando (3rd-warmest), Pensacola (4th-warmest), and Miami (5th-warmest). Several daily high maximum temperature records were tied or broken throughout the month, though more daily high minimum temperature records were set (see appendix 2).
Table 1. May average temperatures and departures from normal ( ̊F) for selected cities.
| Station | Mean Temperature | Departure from Normal |
| Pensacola | 78.2 | +2.2 |
| Tallahassee | 76.5 | +1.3 |
| Jacksonville | 75.5 | +0.6 |
| Orlando | 79.8 | +2.5 |
| Tampa | 81.6 | +2.1 |
| Miami | 81.6 | +1.5 |
| Key West | 81.1 | 0.0 |
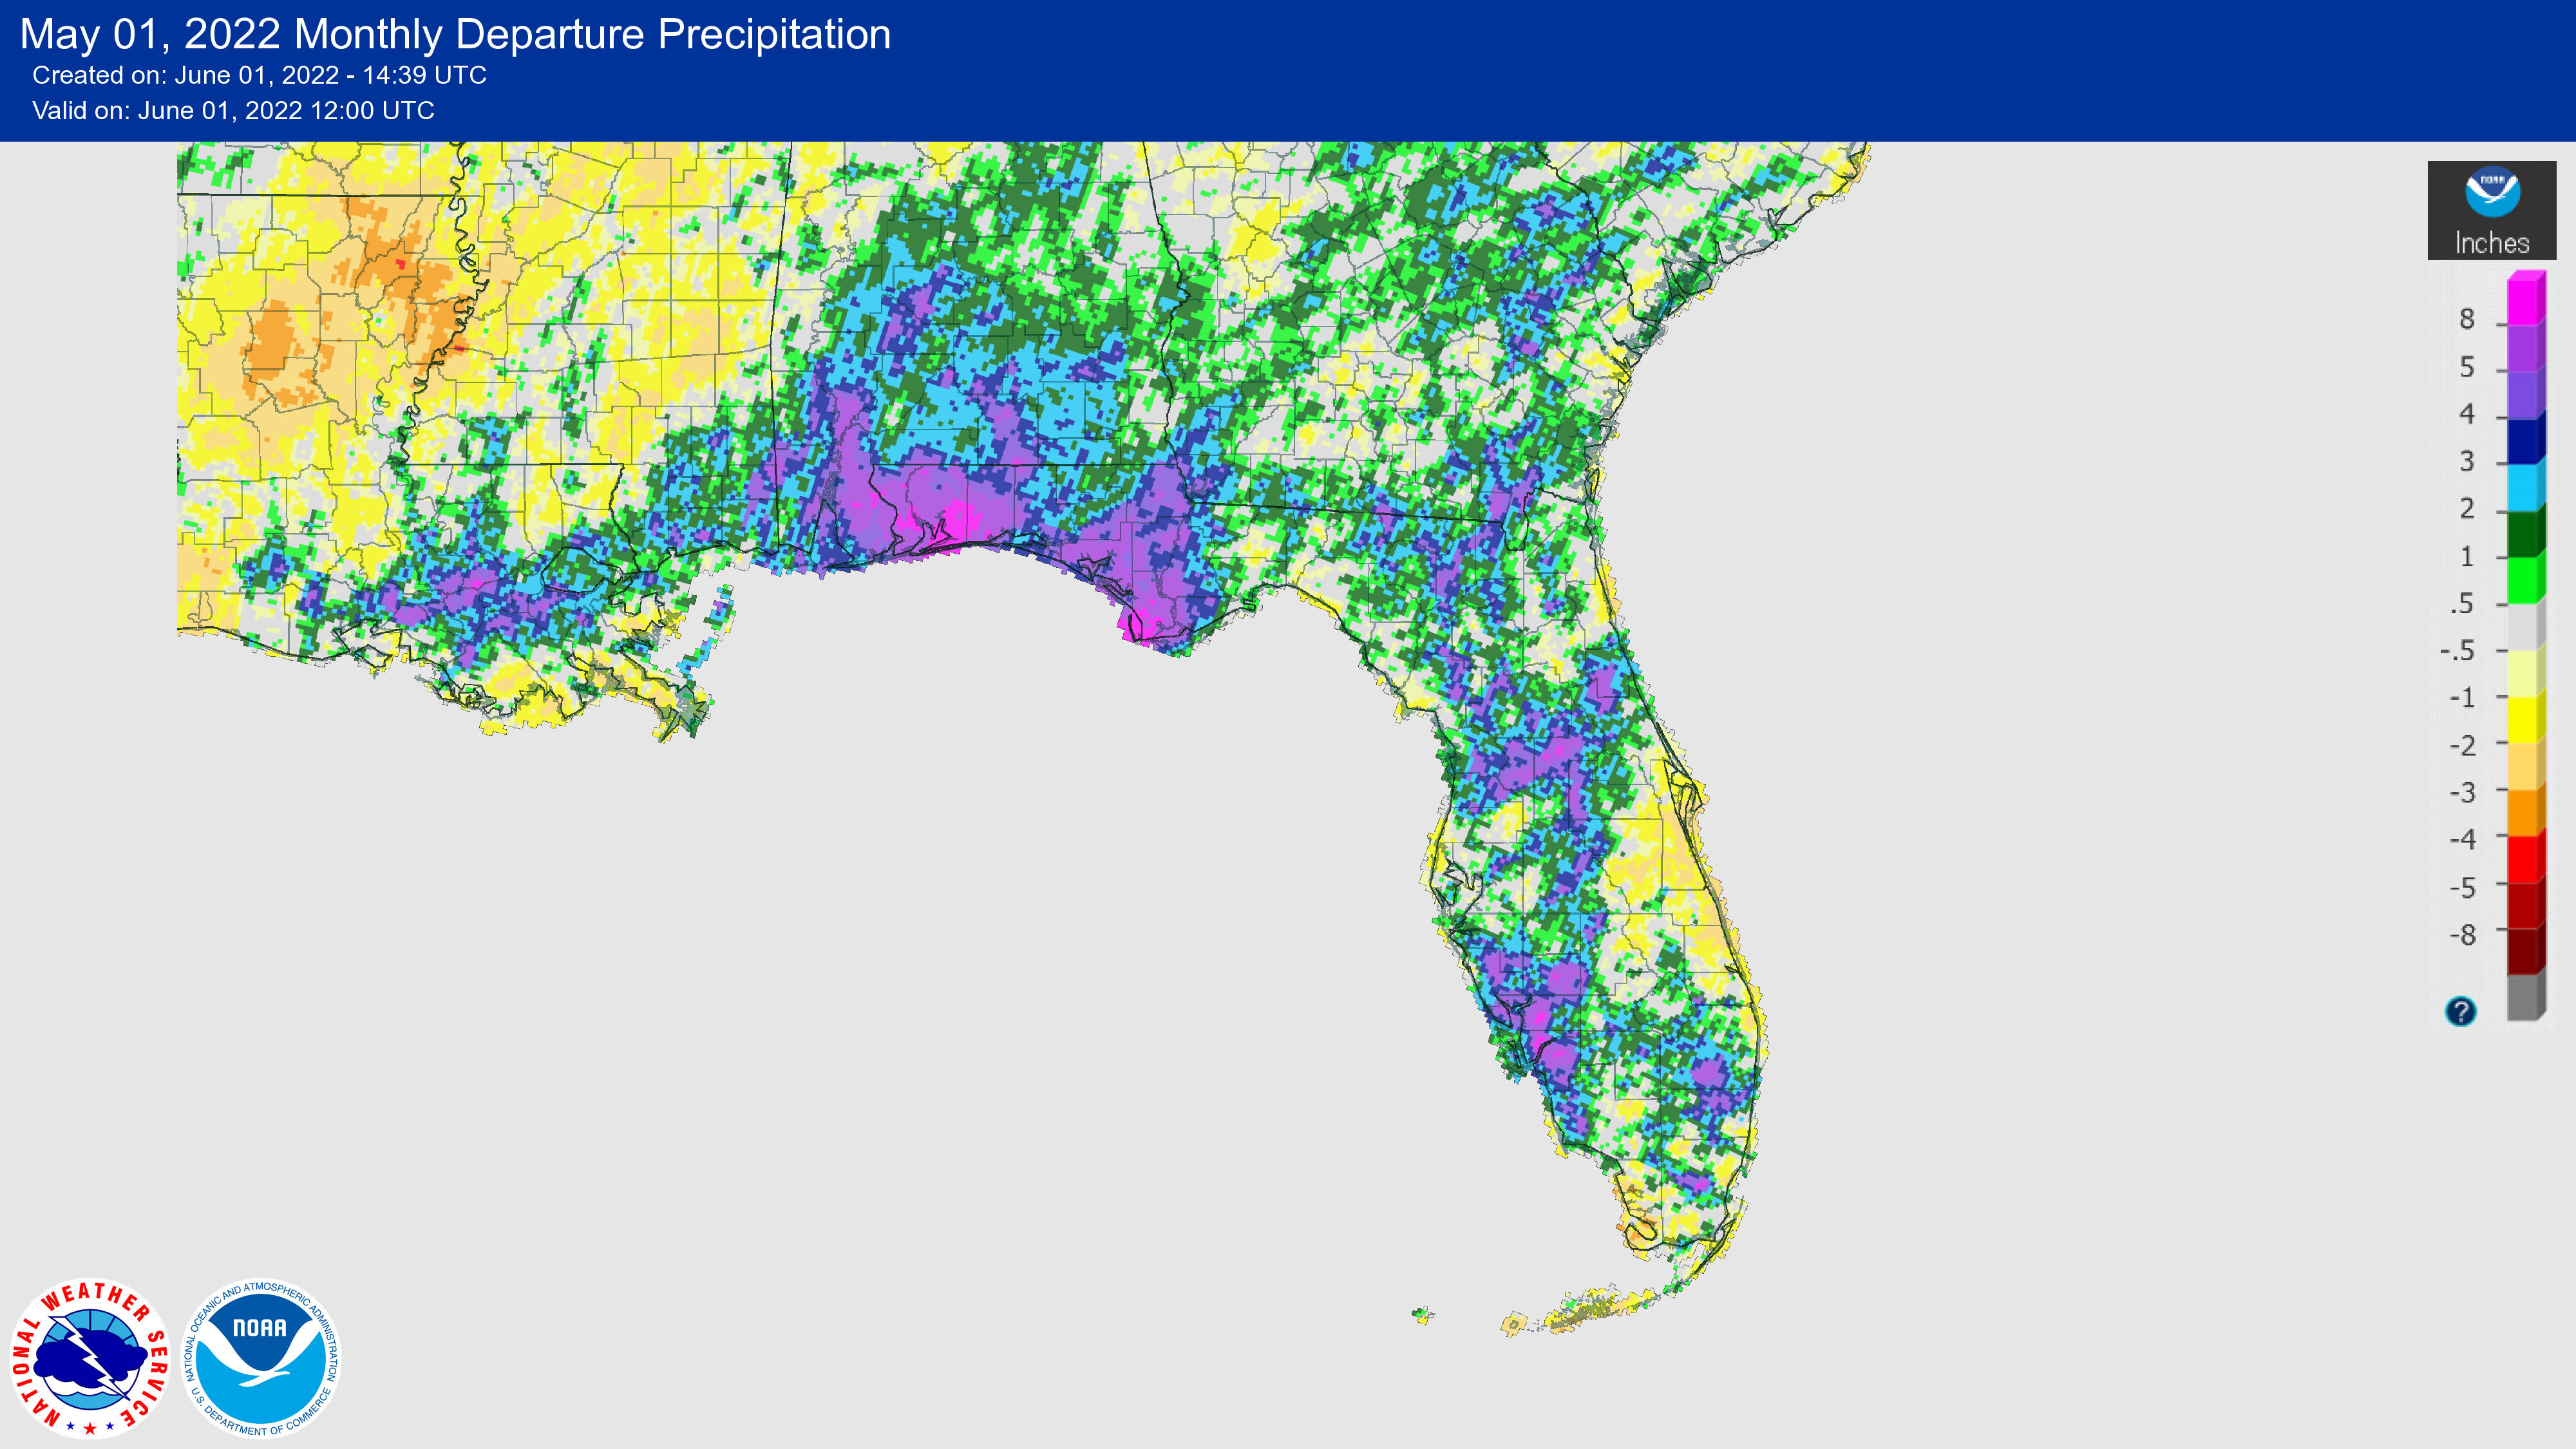
Rainfall totals in May were above normal across much of the state, particularly the western Panhandle, as well as parts of the Peninsula. The monthly precipitation departures from normal ranged from -1.87 inches in Orlando to +8.15 inches in Pensacola (Table 2 and Appendix 1). Pensacola recorded its wettest May on record at 12.05 inches (based on a 74-year record from the Pensacola Regional Airport station). The surplus of rainfall across the western Panhandle brought Pensacola out of deficit for the year, with a year-to-date departure from normal of +2.6 inches. However, several locations continue to see rainfall deficits for the year, including Venice at -3.5 inches of rainfall to date and Vero Beach at -7.8 inches to date. Ample rainfall during May helped to alleviate drought in some areas of southwest Florida, though abnormally dry conditions and moderate drought persist in some areas (see below).
Table 2. May precipitation totals and departures from normal (inches) for selected cities.
| Station | Total Rainfall | Departure from Normal |
| Pensacola | 12.05 | +8.15 |
| Tallahassee | 3.29 | -0.07 |
| Jacksonville | 4.88 | +1.46 |
| Orlando | 2.15 | -1.87 |
| Tampa | 2.71 | +0.11 |
| Miami | 4.47 | -1.85 |
| Key West | 1.72 | -1.40 |
Figure 1. A graphical depiction of the monthly rainfall departure from normal (inches) for May (courtesy of NOAA, NWS).
La Niña Advisory.
Chances for La Niña, the cool phase of the ENSO climate pattern, to return this fall and early winter for a third year in a row have increased (61% chance). La Niña is still favored to continue into the late Northern Hemisphere summer (58% chance in August-October 2022). Over the past month, the Niño index values ranged from -1.1°C and -1.5°C, and subsurface temperature anomalies remained negative reflecting a large area of below-average temperatures from the surface down to ~100m depth across the central and eastern equatorial Pacific Ocean. Overall, the coupled ocean-atmosphere system continues to reflect the presence of La Niña.
Hazardous Weather Events in May.
According to the Local Storm Reports issued by the local National Weather Service offices serving Florida, there were 399 individual local reports of hazardous weather events recorded across the state during the month of May (see Table 4 for a breakdown by event type). Severe storms with high wind gusts, hail, and localized heavy rain affected many areas throughout the month. A severe storm on May 6th produced straight line winds that were reported at 80-90 mph in Taylor County, resulting in damages to trees and structures in the vicinity. Heavy rain was reported across Gulf County on the 24th-26th, with rainfall totals as much as 13.6 inches over the three-day period. There was no tropical cyclone development in May, the first time in seven years since 2015, though Invest 90L came close on the 22nd as it formed in the Gulf of Mexico just before moving inland near Pensacola.
Table 4. Breakdown of storm reports submitted in Florida during the month of May (compiled from Iowa State University/Iowa Environmental Mesonet).
| Report Type | Number of Reports |
| Flash Flood | 6 |
| Heavy Rain | 15 |
| Flood | 11 |
| Hail | 106 |
| Lightning | 5 |
| Marine Thunderstorm Wind | 59 |
| Non-Thunderstorm Wind Gust | 1 |
| Non-Thunderstorm Wind Damage | 0 |
| Tornado/Waterspout/Funnel Cloud | 9/33/6 |
| Thunderstorm Wind Damage | 48 |
| Thunderstorm Wind Gust | 91 |
| Rip Currents | 1 |
| Wildfire | 7 |
Drought-Related Impacts.
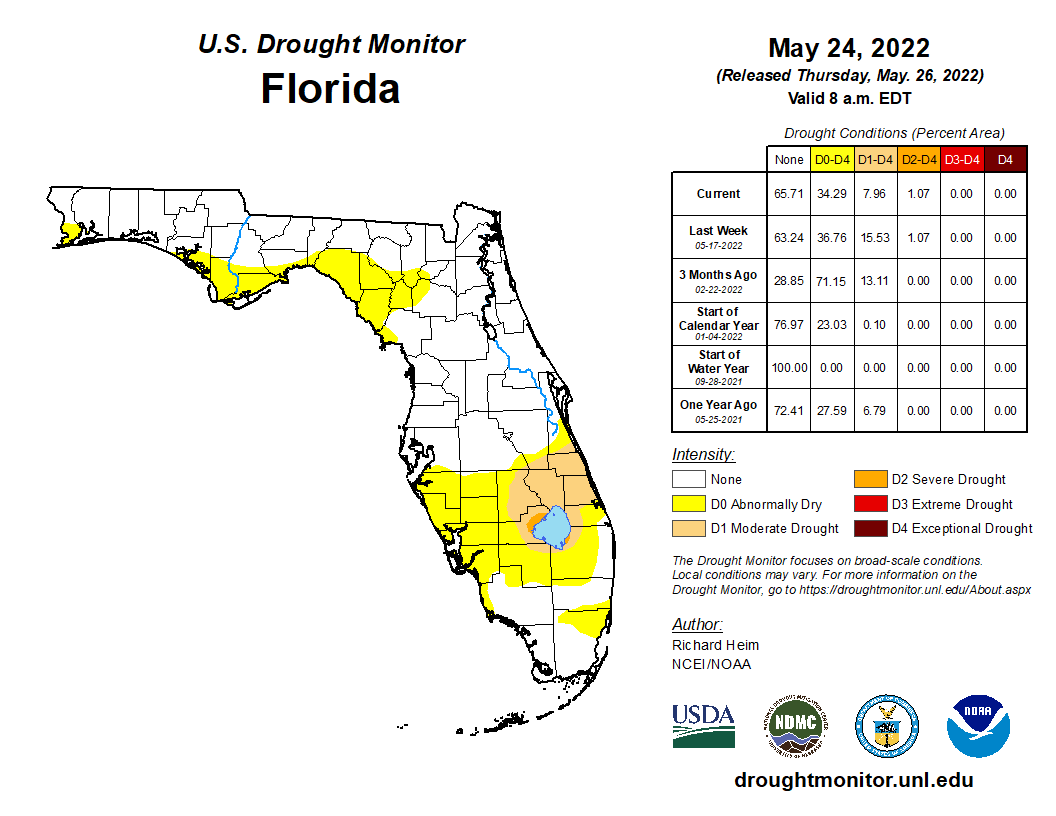
At the beginning of May, nearly 4% of the state was in severe drought (D2), 14% was in moderate drought (D1), and 20% was abnormally dry (D0), according to the U.S. Drought Monitor. As of May 24, drought conditions had improved with only 1% of the state in severe drought (D2), roughly 7% in moderate drought (D1), and 26% of the state was experiencing abnormally dry conditions. Moderate drought and abnormally dry conditions continue to impact areas of the south-central Peninsula, and abnormally dry conditions exist in the coastal Panhandle and Big Bend regions (Figure 2 below).
As of May 31, the Lake Okeechobee water level was 12.60 ft. above sea level (Feet-NGVD29), which is below average for this time of the year. The water level declined throughout the month but remains well above the water shortage management threshold. At the first of the month, the water level was around 12.98 ft. above sea level.
Figure 2. A graphical depiction of the current drought conditions in Florida according to the U.S. Drought Monitor (courtesy of the National Drought Mitigation Center, University of Nebraska-Lincoln).
Agriculture-Related Impacts.
During mid-May, topsoil moisture conditions were adequate in 55% of the state, short in 32%, and very short in 10% of the state, while just 3% of the state had surplus moisture conditions. By the end of May, topsoil moisture had improved with levels adequate in 70% of the state, short in 15%, and very short in 2% of the state; 13% of the state was in surplus. For more information, consult the Crop Progress and Conditions report, which is published by the USDA's National Agricultural Statistics Service.
Appendix 1
Additional May departures from normal data for select Florida locations (Source: NWS).
| Station | Average Temperature (˚F) | Departure from Normal (˚F) | Total Rainfall (in.) | Departure from Normal (in.) |
| Gainesville | 76.0 | +1.0 | 3.77 | +0.69 |
| Sarasota | 78.8 | +1.0 | 4.26 | +1.68 |
| Melbourne | 78.5 | +0.4 | 0.78 | -2.75 |
| Fort Myers | 80.3 | +1.0 | 8.67 | +5.21 |
| West Palm Beach | 80.1 | +1.4 | 1.88 | -3.03 |
Appendix 2
Select daily record high minimum temperatures broken or tied during May (compiled from NOAA).
| Location | Date | Record (˚F) | Broken/Tied | Last |
| Key West | 6 | 83 | Broken | 82 in 1967 |
| Orlando | 7 | 75 | Broken | 74 in 1984 |
| Key West | 7 | 84 | Broken | 80 in 1978 |
| Lakeland | 7 | 71 | Broken | 70 in 1995 |
| Key West | 9 | 83 | Broken | 81 in 2019 |
| Orlando | 18 | 74 | Broken | 73 in 2003 |
| Tampa | 19 | 77 | Broken | 76 in 2016 |
| Pensacola | 19 | 76 | Tied | 76 in 2017 |
| Jacksonville Beach | 20 | 79 | Broken | 77 in 2017 |
| Melbourne | 20 | 75 | Broken | 74 in 1985 |
| Pensacola | 20 | 78 | Broken | 75 in 1957 |
| Niceville | 21 | 76 | Broken | 75 in 1938 |
| Perrine | 21 | 78 | Broken | 73 in 2021 |
| Wewahitchka | 21 | 73 | Broken | 72 in 1990 |
| Marianna | 21 | 74 | Broken | 73 in 2008 |
| Miami | 21 | 82 | Broken | 80 in 1991 |
| West Palm Beach | 21 | 79 | Tied | 79 in 1991 |
| Pensacola | 21 | 78 | Broken | 77 in 1957 |
| Fort Lauderdale | 22 | 79 | Broken | 77 in 2018 |
| Hialeah | 22 | 80 | Broken | 79 in 2001 |
| Perrine | 22 | 79 | Broken | 75 in 2018 |
| Royal Palm (RS) | 22 | 77 | Broken | 73 in 2018 |
| Stuart | 22 | 79 | Broken | 78 in 1957 |
| Ochopee | 22 | 76 | Broken | 73 in 2016 |
| Fort Myers | 22 | 78 | Broken | 75 in 2008 |
| Miami | 22 | 81 | Broken | 79 in 2011 |
| Vero Beach | 22 | 77 | Broken | 75 in 1964 |
| West Palm Beach | 22 | 80 | Broken | 78 in 2011 |
| Clermmont | 23 | 74 | Broken | 72 in 2017 |
| Fort Lauderdale | 23 | 79 | Broken | 78 in 1957 |
| Kissimmee | 23 | 76 | Broken | 74 in 2015 |
| Titusville | 23 | 77 | Broken | 76 in 2001 |
| Vero Beach | 23 | 77 | Broken | 76 in 2020 |
| Daytona Beach | 23 | 75 | Broken | 74 in 1997 |
| Fort Lauderdale | 24 | 79 | Broken | 78 in 1915 |
| Hastings | 24 | 72 | Broken | 71 in 1991 |
| Inverness | 24 | 75 | Broken | 74 in 2017 |
| Tampa | 24 | 79 | Broken | 78 in 2020 |
| West Palm Beach | 24 | 79 | Broken | 78 in 2019 |
| Key West | 25 | 85 | Broken | 81 in 1961 |
| Tampa | 26 | 74 | Broken | 72 in 2020 |
| Key West | 26 | 85 | Broken | 82 in 2020 |
| Orlando | 27 | 77 | Broken | 76 in 2000 |