


Prepared by Florida Climate Center
The Florida State University
Tallahassee, FL

February Key Points:
- Warmer weather returned in February, with average temperatures above normal in Florida.
- February was dry for much of Florida, with below normal monthly rainfall totals across the state.
- The La Niña advisory remains in effect and is expected to continue through May 2022 (77% chance).
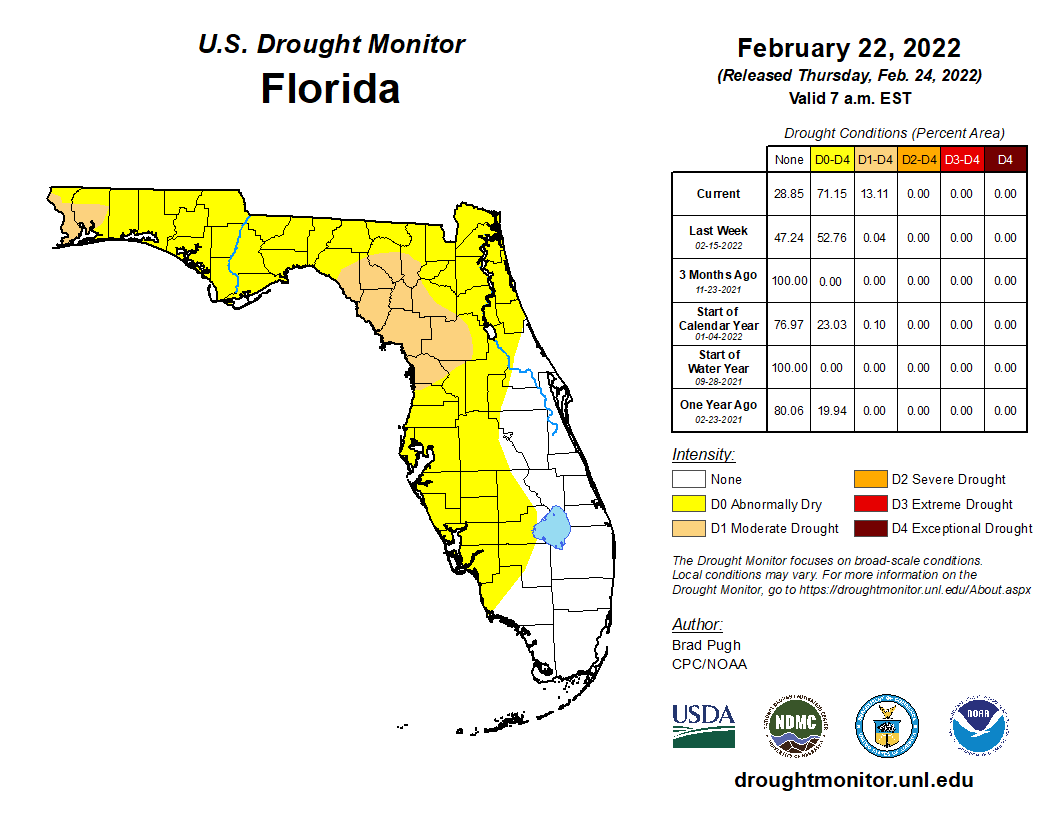
- As of February 22, about 13% of the state is in moderate drought (D1) and 58% is experiencing abnormally dry conditions (D0), according to the U.S. Drought Monitor.
Average temperatures in February were above normal in Florida. Average temperature departures from normal ranged from +0.2 ̊F in Key West to +3.9 ̊F in Tampa for the month (see Table 1 and Appendix 1 for select cities). Several stations recorded one of their top ten warmest months of February on record, including Jacksonville Beach (5th-warmest), Orlando (7th-warmest), Fort Myers (8th-warmest), and Fort Lauderdale (8th-warmest). Several daily temperature records were tied or broken throughout the month, including daily high maximum and high minimum temperatures (see appendices 2 and 3).
Table 1. February average temperatures and departures from normal ( ̊F) for selected cities.
| Station | Mean Temperature | Departure from Normal |
| Pensacola | 57.4 | +0.6 |
| Tallahassee | 56.3 | +0.7 |
| Jacksonville | 58.8 | +1.3 |
| Orlando | 67.0 | +3.4 |
| Tampa | 68.6 | +3.9 |
| Miami | 73.5 | +2.8 |
| Key West | 72.5 | +0.2 |
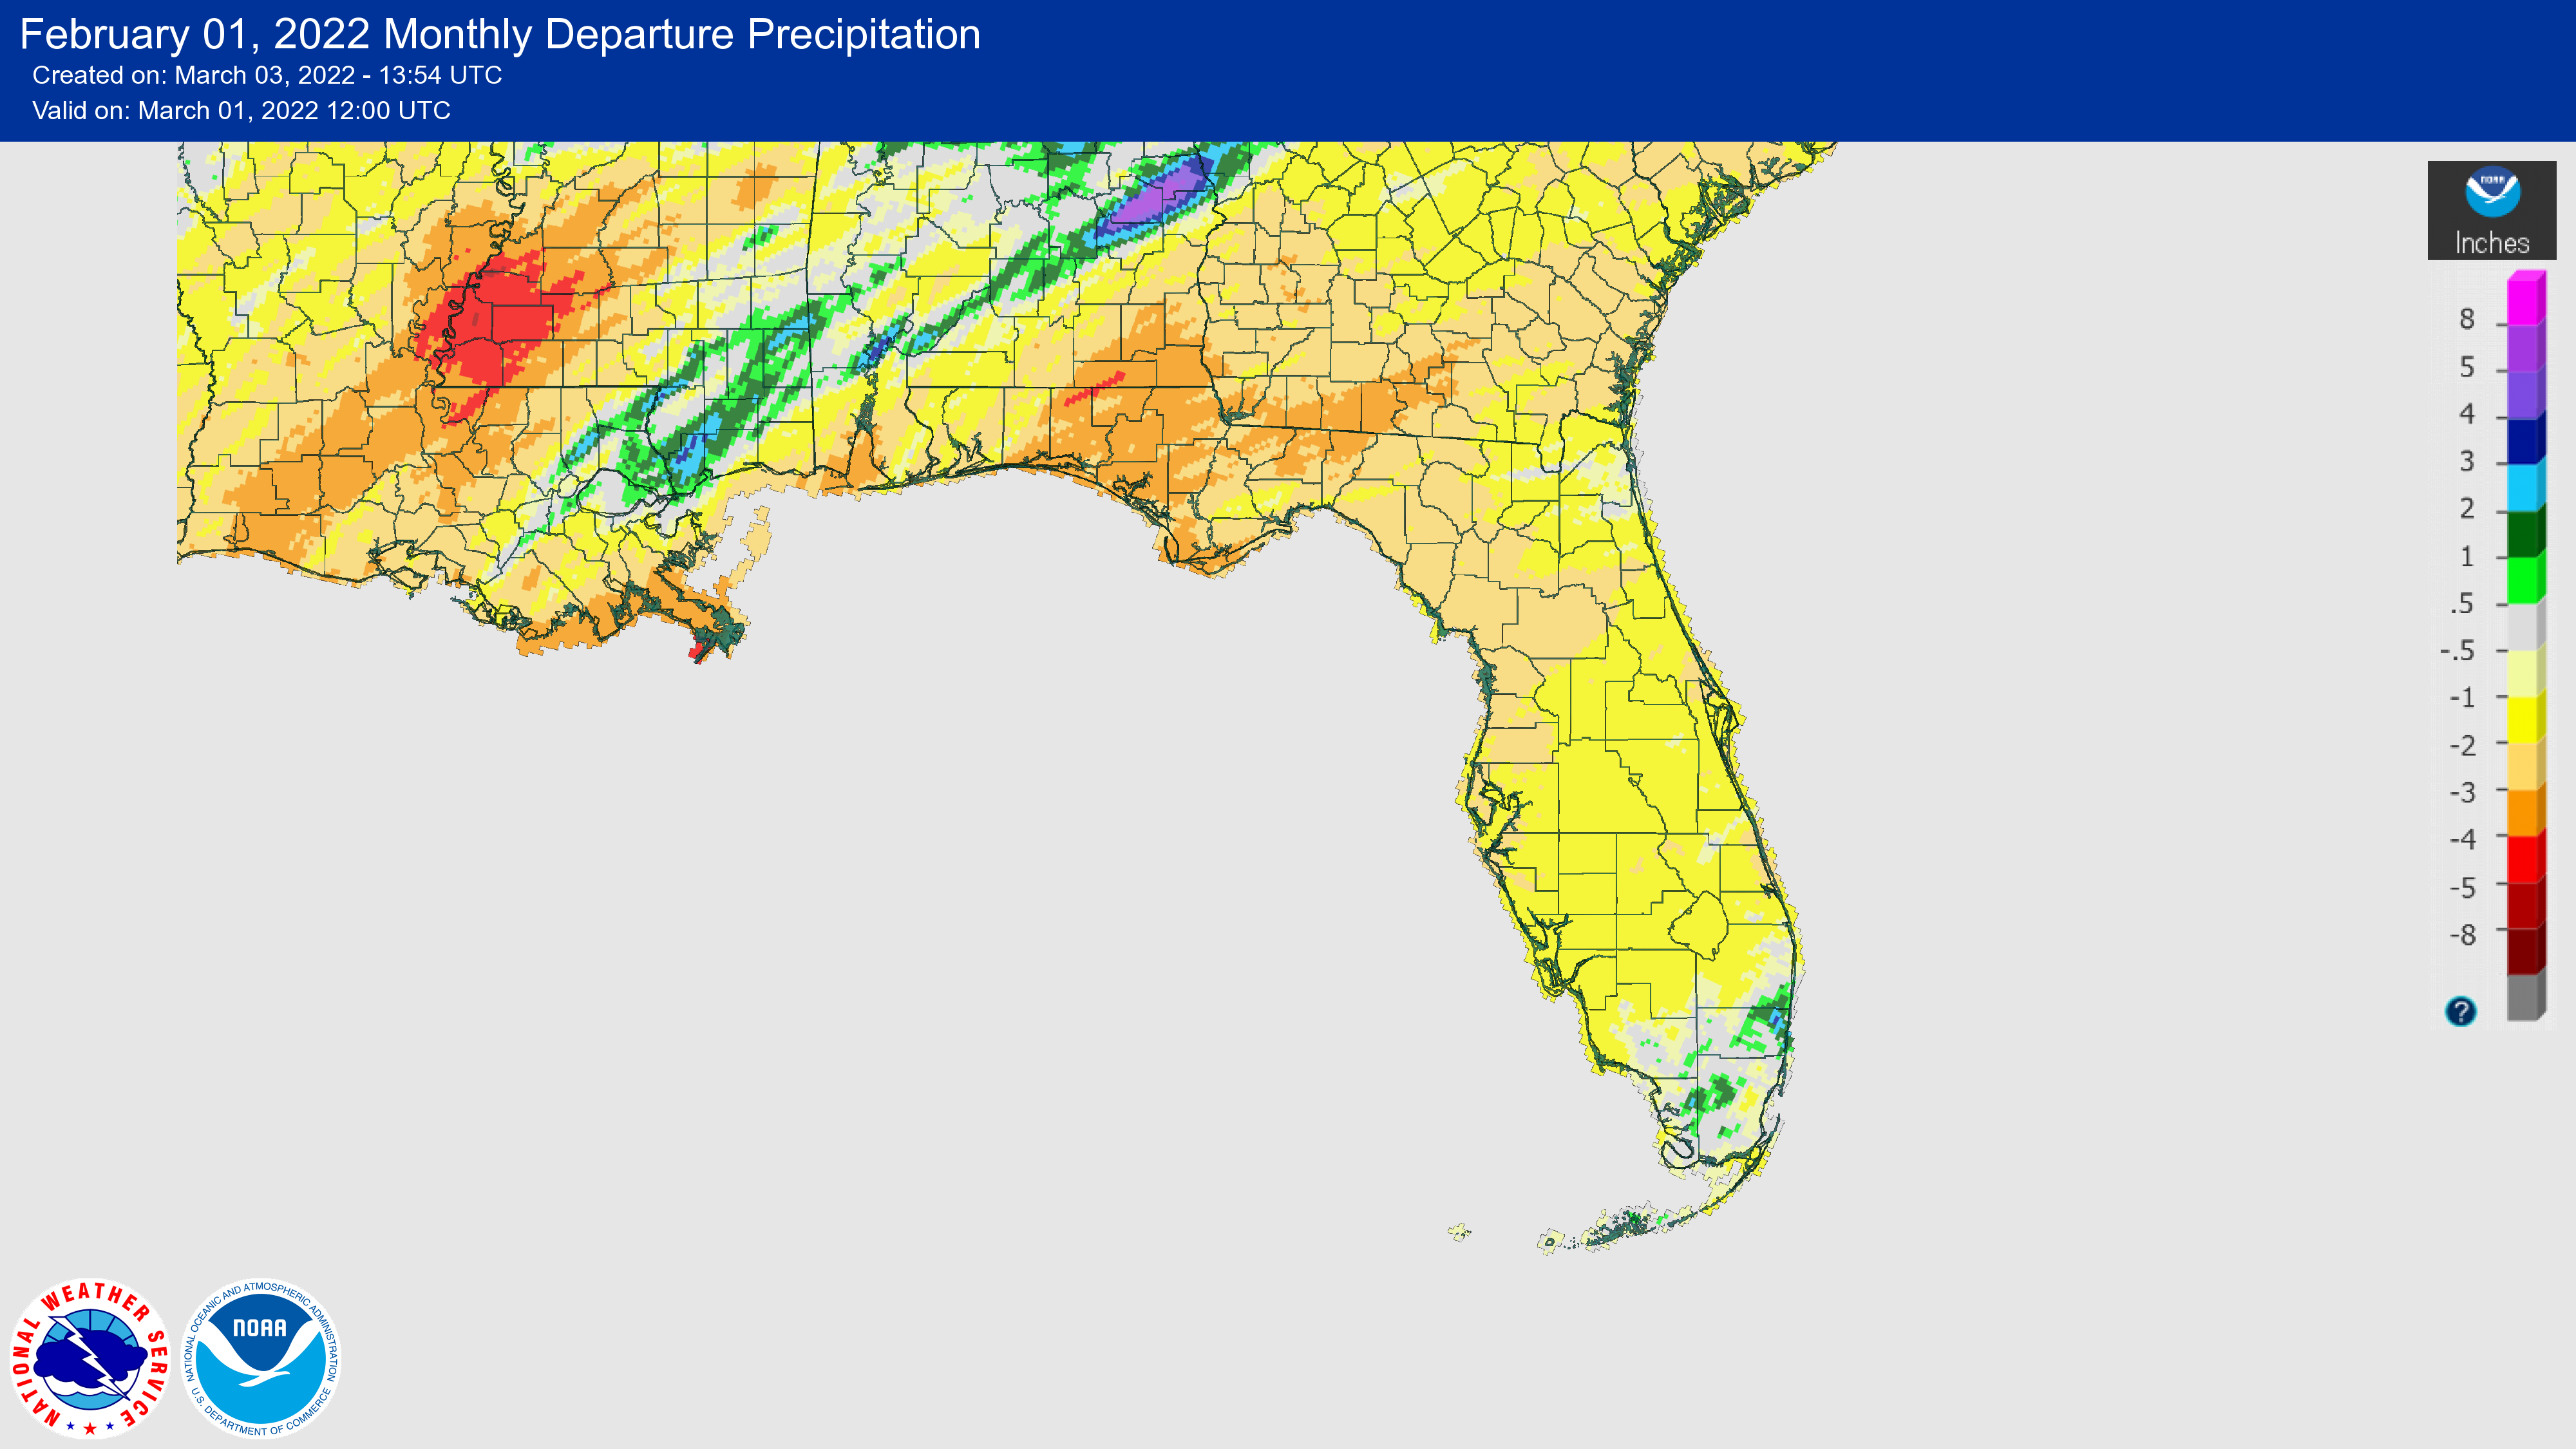
Rainfall totals in February were below normal across the state. The monthly precipitation departures from normal ranged from -0.55 inches in Miami to -3.00 inches in Tallahassee (Table 2 and Appendix 1). Most places across the state recorded a precipitation deficit for the month, except for just a few places in south Florida (Figure 1). Crestview had its second driest February on record, and both Ocala and Apalachicola recorded their 4th-driest February on record. Rainfall deficits have resulted in abnormally dry conditions and the emergence of moderate drought conditions in parts of the western Peninsula (drought information below).
Table 2. February precipitation totals and departures from normal (inches) for selected cities.
| Station | Total Rainfall | Departure from Normal |
| Pensacola | 2.78 | -1.99 |
| Tallahassee | 1.28 | -3.00 |
| Jacksonville | 2.09 | -0.77 |
| Orlando | 0.71 | -1.33 |
| Tampa | 0.62 | -2.00 |
| Miami | 1.60 | -0.55 |
| Key West | 1.35 | -0.19 |
Figure 1. A graphical depiction of the monthly rainfall departure from normal (inches) for February (courtesy of NOAA, NWS).
La Niña Advisory Continues.
La Niña conditions, the cool phase of the ENSO climate pattern, continued in the tropical Pacific Ocean in February. Below-average sea surface temperatures weakened during January, but most of the weekly ENSO indices remained between -0.5 ̊ C and -1.0 ̊ C. Overall, the coupled ocean-atmosphere system reflected a weakening La Niña. According to the latest official NWS update, La Niña is likely to continue into the Northern Hemisphere spring, with a 77% chance of persisting through May 2022. It is likely to then transition to ENSO-neutral in late spring or summer (56% chance during May-July 2022).
Hazardous Weather Events in February.
According to the Local Storm Reports issued by the local National Weather Service offices serving Florida, there were 21 individual local reports of hazardous weather events recorded across the state during the month of February 2022 (see Table 4 for a breakdown by event type). Though there were few severe weather events during the month, several fatalities occurred. Strong rip currents at Fort Lauderdale Beach led to two injuries and one fatality on the 7th. Later in the month, dense fog led to three fatalities resulting from two car accidents in Flagler County on the 25th.
Table 4. Breakdown of storm reports submitted in Florida during the month of February (compiled from Iowa State University/Iowa Environmental Mesonet).
| Report Type | Number of Reports |
| Flash Flood | 0 |
| Heavy Rain | 0 |
| Dense Fog | 1 |
| Marine Thunderstorm Wind | 3 |
| Non-Thunderstorm Wind Gust | 10 |
| Non-Thunderstorm Wind Damage | 0 |
| Tornado/Waterspout/Funnel Cloud | 0/1/0 |
| Thunderstorm Wind Damage | 0 |
| Thunderstorm Wind Gust | 4 |
| Rip Currents | 2 |
Drought-Related Impacts.
By mid-February, abnormally dry conditions (D0) were affecting 53% of the state, according to the U.S. Drought Monitor. Affected areas included the central and western Panhandle and Big Bend regions, as well as much of northern and western Florida. This was an increase from 17% of the state in abnormally dry conditions and 1.4% of the western Panhandle in moderate drought at the beginning of the month. Near the end of the month, moderate drought (D1) emerged across the north-west portions of the Peninsula and re-emerged in the extreme western Panhandle (13% area total), while 58% of the state was abnormally dry (Figure 2).
As of February 28, the Lake Okeechobee water level was 14.58 ft. above sea level (Feet-NGVD29), which is about average for this time of the year. The water level remained above average but declined throughout the month. At the first of the month, the water level was around 14.91 ft. above sea level.
Agriculture-Related Impacts.
During the month of February, damage to crops and pasture were seen early in the month due to frosts. Pasture conditions were degraded to mostly poor and fair conditions. However, cattle remained in mostly good condition due to supplemental feedings. Sugarcane crop exhibited signs of leaf burn. Strawberry harvest continued, and several citrus and vegetable crops were marketed including white and red grapefruit, tangerines, tomatoes, peppers, eggplant, sweet corn, green beans, avocadoes, and others. For more information, consult the Crop Progress - State Stories reports, which are produced monthly December through March.
Appendix 1
Additional February departures from normal data for select Florida locations (Source: NWS).
| Station | Average Temperature (˚F) | Departure from Normal (˚F) | Total Rainfall (in.) | Departure from Normal (in.) |
| Gainesville | 60.3 | +1.9 | 1.56 | -1.11 |
| Sarasota | 66.4 | +1.6 | 0.71 | -1.21 |
| Melbourne | 66.2 | +0.8 | 0.79 | -1.19 |
| Fort Myers | 71.1 | +3.8 | 0.48 | -1.30 |
| West Palm Beach | 72.1 | +3.7 | 1.97 | -0.66 |
Appendix 2
Select daily record high maximum temperatures broken or tied during February (compiled from NOAA).
| Location | Date | Record (˚F) | Broken/Tied | Last |
| Tampa | 3 | 85 | Broken | 84 in 2016 |
| Gainesville | 4 | 83 | Broken | 82 in 2014 |
| Orlando | 4 | 87 | Broken | 86 in 2014 |
| Key West | 4 | 85 | Broken | 83 in 2020 |
| Lakeland | 4 | 86 | Broken | 85 in 1989 |
| Clermont | 5 | 87 | Broken | 86 in 2014 |
| Jacksonville Beach | 5 | 82 | Broken | 80 in 1997 |
| Key West | 8 | 86 | Broken | 83 in 2014 |
| Tampa | 16 | 84 | Tied | 84 in 1989 |
| Tarpon Springs | 17 | 85 | Tied | 85 in 2019 |
| Tampa | 17 | 86 | Broken | 83 in 1995 |
| Clermont | 18 | 88 | Tied | 88 in 2019 |
| Perry | 18 | 83 | Broken | 82 in 1995 |
| Orlando | 18 | 87 | Tied | 87 in 2021 |
| Tarpon Springs | 22 | 87 | Broken | 86 in 1997 |
| Key West | 22 | 86 | Broken | 85 in 2019 |
| Fort Myers | 23 | 89 | Tied | 89 in 1962 |
| Tallahassee | 23 | 83 | Tied | 83 in 2019 |
| Tampa | 24 | 86 | Broken | 85 in 2001 |
| Key West | 24 | 88 | Broken | 86 in 2019 |
| Jacksonville Beach | 25 | 87 | Broken | 82 in 2017 |
| Miles City | 25 | 88 | Tied | 88 in 2018 |
| Gainesville | 25 | 87 | Broken | 85 in 2018 |
| Daytona Beach | 25 | 87 | Broken | 86 in 2001 |
| Fort Myers | 26 | 89 | Broken | 87 in 1971 |
Appendix 3
Select daily record high minimum temperatures broken or tied during February (compiled from NOAA).
| Location | Date | Record (˚F) | Broken/Tied | Last |
| Jacksonville Beach | 4 | 68 | Broken | 64 in 1990 |
| Quincy | 4 | 64 | Broken | 61 in 2014 |
| Wewahitchka | 4 | 65 | Broken | 64 in 1990 |
| Key West | 4 | 77 | Broken | 76 in 2014 |
| Fort Pierce | 17 | 69 | Tied | 69 in 1981 |
| Stuart | 17 | 70 | Tied | 70 in 1984 |
| Miami | 17 | 72 | Tied | 72 in 2021 |
| Key West | 17 | 76 | Tied | 76 in 1975 |
| Daytona Beach | 18 | 67 | Broken | 66 in 2019 |
| Mayport | 18 | 63 | Broken | 62 in 2019 |
| Orlando | 18 | 68 | Broken | 65 in 2021 |
| Daytona Beach | 18 | 69 | Broken | 66 in 1990 |
| Orlando | 18 | 70 | Broken | 67 in 2019 |
| Jacksonville | 18 | 66 | Broken | 65 in 2019 |
| Clermont | 19 | 70 | Broken | 66 in 1992 |
| Sanford | 19 | 68 | Broken | 65 in 2012 |
| Fort Pierce | 23 | 71 | Tied | 71 in 2018 |
| Jacksonville Beach | 23 | 68 | Broken | 66 in 2013 |
| Tampa | 23 | 70 | Broken | 69 in 2019 |
| Jacksonville Beach | 24 | 69 | Broken | 67 in 2012 |
| Pensacola | 24 | 65 | Broken | 64 in 1949 |
| Jacksonville Beach | 25 | 70 | Broken | 62 in 2011 |
| Jacksonville Beach | 26 | 67 | Broken | 64 in 1992 |
| Fort Lauderdale Beach | 27 | 72 | Tied | 72 in 2013 |
| Jacksonville Beach | 27 | 68 | Broken | 64 in 1971 |