Prepared by Florida Climate Center
The Florida State University
Tallahassee, FL
March Key Points:
- Temperatures were above normal, while rainfall was below normal across Florida.
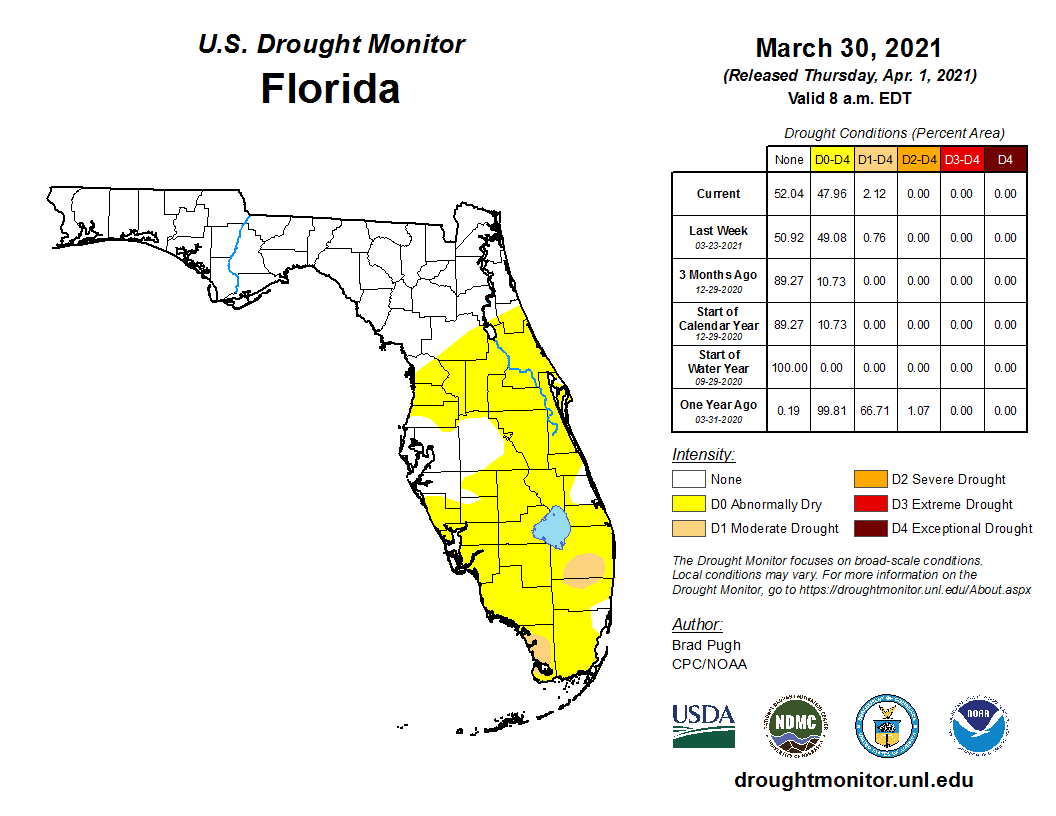
- Abnormally dry conditions developed over peninsular Florida, and moderate drought developed in parts of the southern Peninsula by the end of the month.
- La Niña Advisory continues but appears to be weakening.
- CPC seasonal forecast favors above normal temperatures and equal chances of rainfall for spring.
- Drought development continues to be a risk as temperatures warm during spring with seasonal reduction in rainfall, especially over peninsular Florida.
Average temperatures in March were above normal across the state. Average temperatures ranged from +1.7 ̊F to +4.8 ̊F above normal for the month (see Table 1 and Appendix 1 for select cities). Temperatures were especially warm during the middle and latter parts of the month, with summer-like temperatures observed in many locations. For instance, in Pensacola daily high temperatures averaged 8.8 ̊F above normal and daily low temperatures averaged 12.2 ̊F above normal from March 12-17. Jacksonville Beach observed its fifth warmest March on record, and Pensacola observed its seventh warmest March on record. Many daily high maximum and high minimum temperature records were set during the month (see Appendices 2 and 3).
Table 1. March average temperatures and departures from normal ( ̊F) for selected cities.
| Station | Mean Temperature | Departure from Normal |
| Pensacola | 65.2 | +4.8 |
| Tallahassee | 63.9 | +3.5 |
| Jacksonville | 63.6 | +1.9 |
| Orlando | 69.4 | +2.5 |
| Tampa | 70.9 | +3.6 |
| Miami | 74.5 | +1.9 |
| Key West | 76.0 | +2.8 |
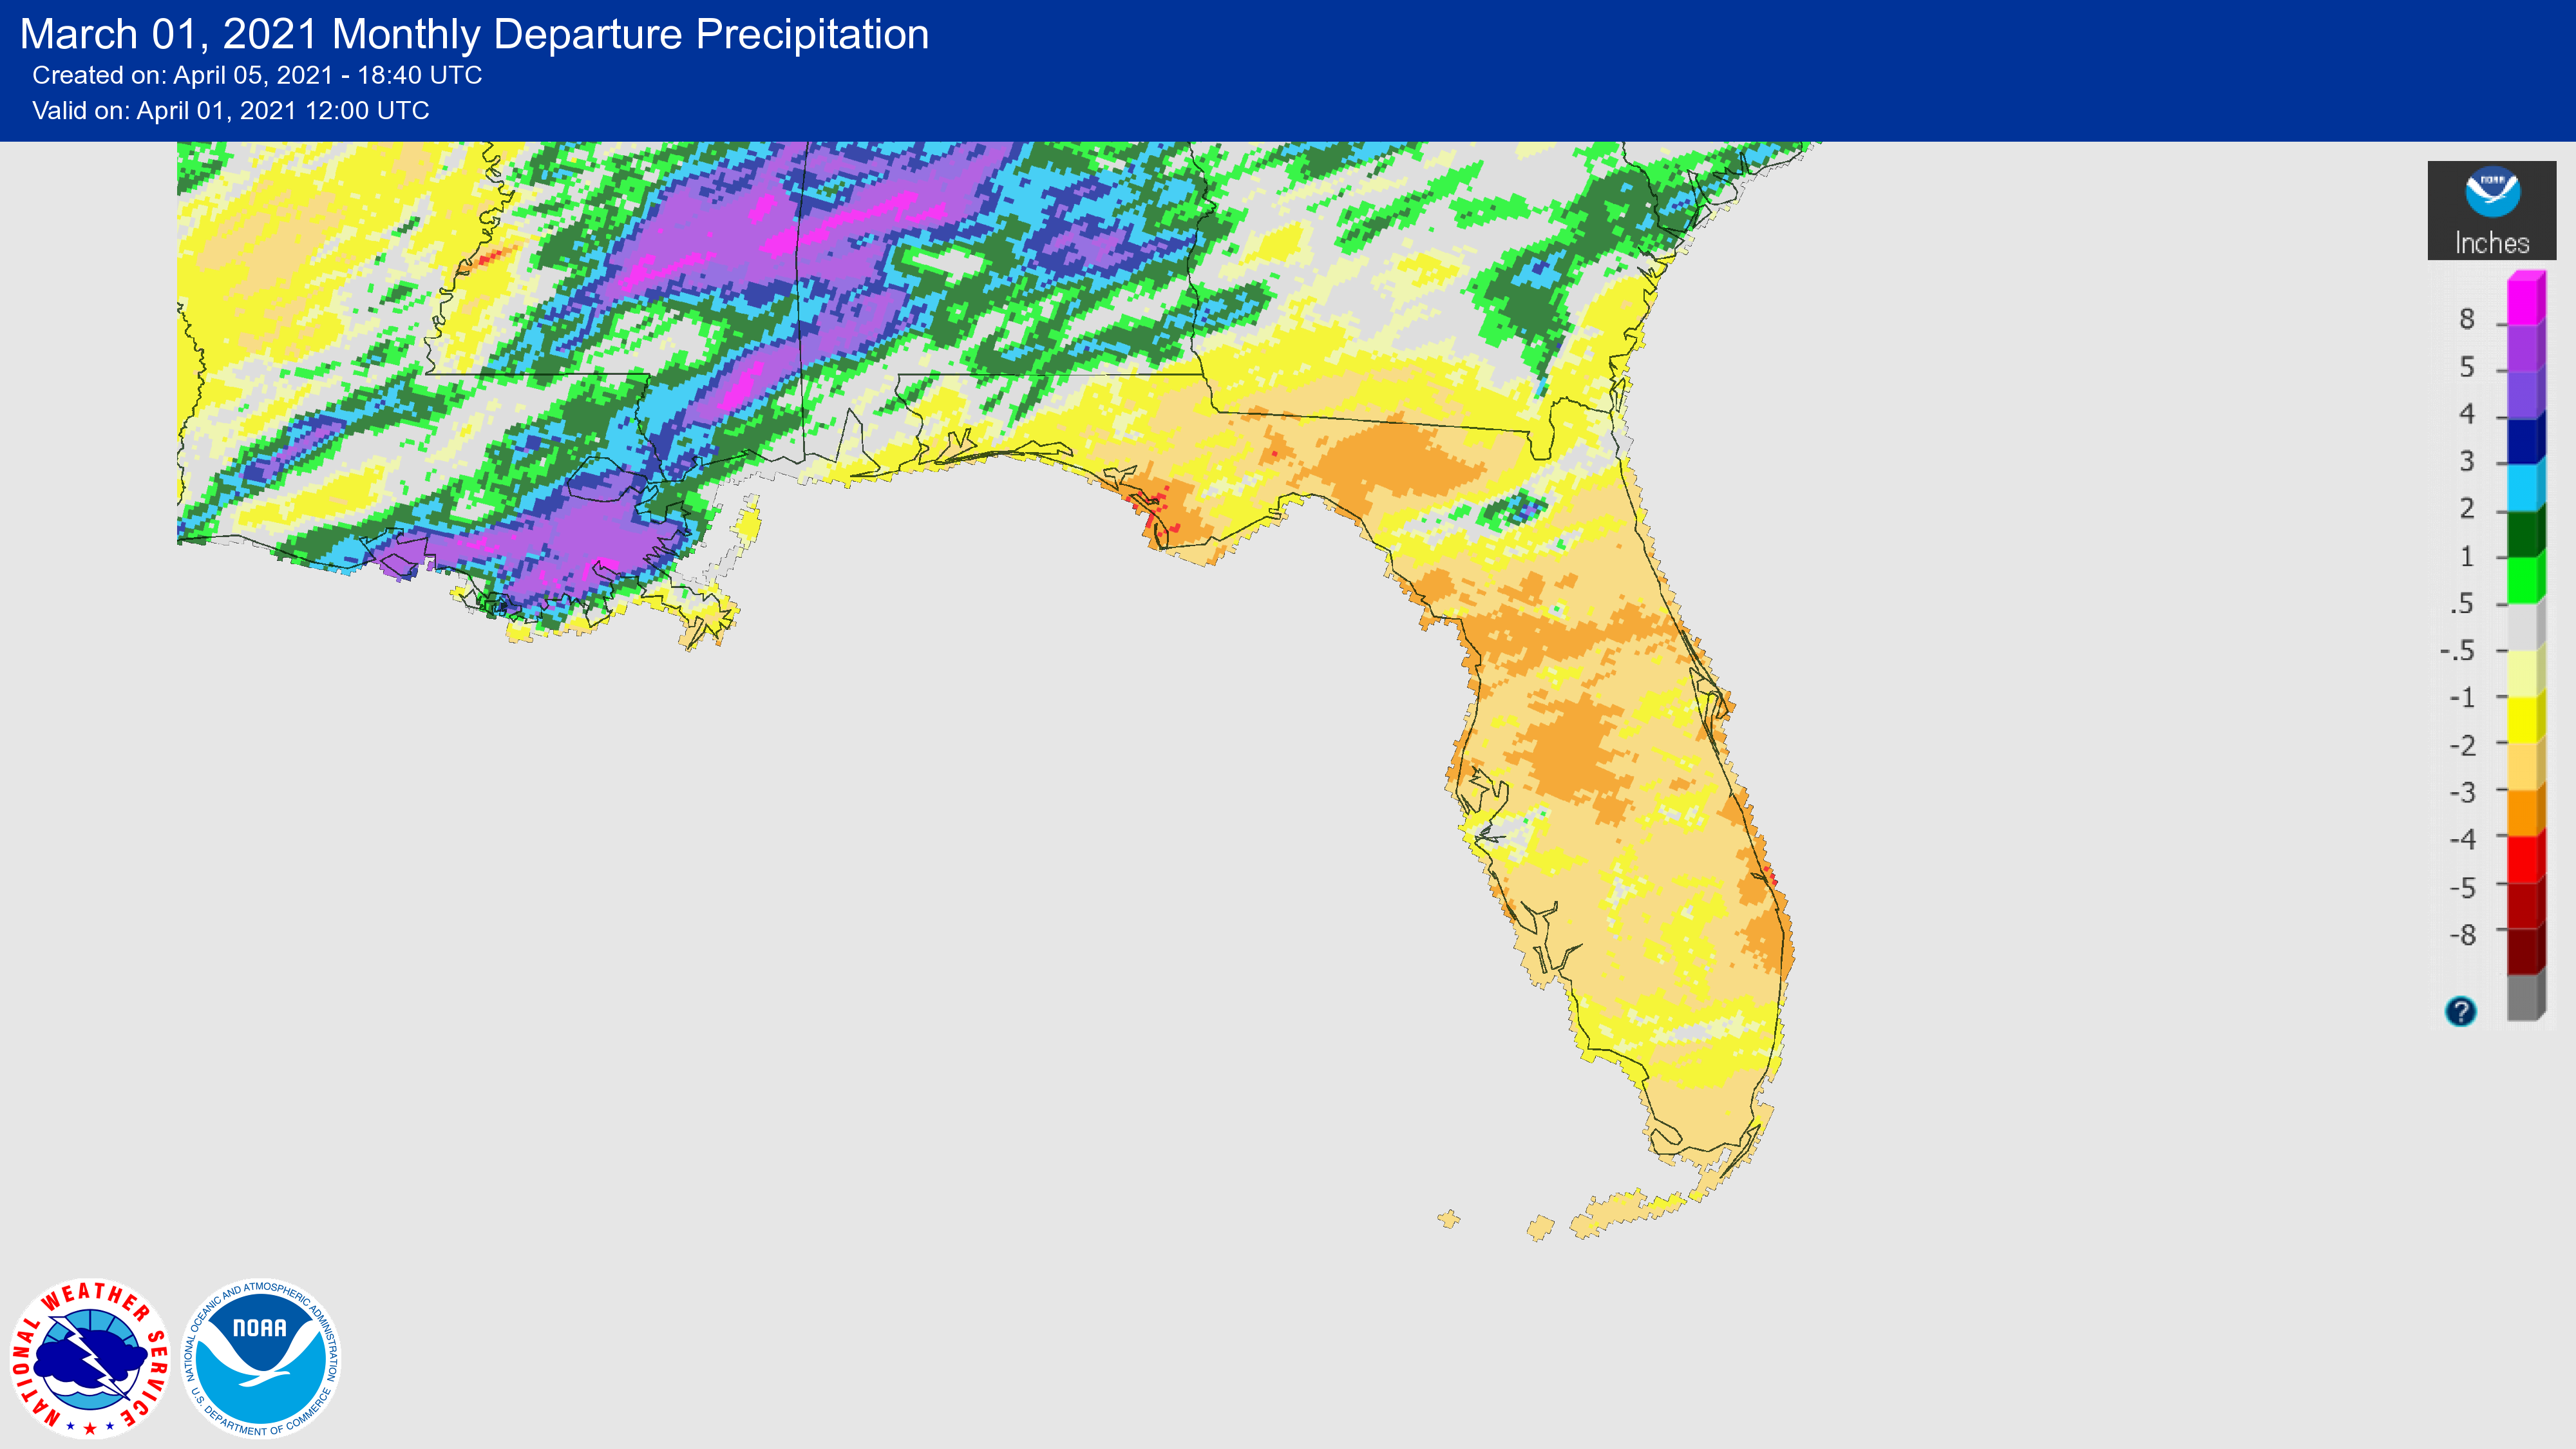
Rainfall totals in March were below normal across the state. Most of the Panhandle and peninsular Florida had below normal rainfall, with the exception of a few isolated locations in the western Panhandle and north central Florida (Figure 1). Monthly departures from normal ranged from -1.13 inches in Miami to -4.11 inches in Tallahassee (Table 2 and Appendix 1). Homestead observed its driest March on record, with a recorded 0.07 inches of rainfall during the month. Lakeland had its second driest March on record, and Key West had its third driest March on record.
Table 2. March precipitation totals and departures from normal (inches) for selected cities.
| Station | Total Rainfall | Departure from Normal |
| Pensacola | 4.55 | -1.26 |
| Tallahassee | 1.83 | -4.11 |
| Jacksonville | 2.82 | -1.13 |
| Orlando | 2.03 | -1.74 |
| Tampa | 1.07 | -1.96 |
| Miami | 1.87 | -1.13 |
| Key West | 0.05 | -2.0 |
Figure 1. A graphical depiction of the monthly rainfall departure from normal (inches) for March (courtesy of NOAA, NWS).

La Niña Conditions in the Pacific Continue but Weaken.
La Niña conditions continued during March but it has weakened recently, and forecasters estimate a shift to ENSO-neutral conditions this spring (~60% chance for April-June). ENSO-neutral conditions are then expected to continue at least through the Northern Hemisphere summer. La Niña conditions have returned with above-average temperatures and drier than average conditions across much of the southern tier of the U.S.
Hazardous Weather Events in March.
According to the Local Storm Reports issued by the local National Weather Service offices serving Florida, there were 127 individual local reports of hazardous weather events recorded across the state during the month of March (see Table 4 for a breakdown by event type). A wildfire was reported on March 16th in Big Cypress National Preserve, with portions of the preserve closed to the public and smoke possibly causing issues on HWY 41 and SR 29. Strong rip currents at Miramar Beach and Miami Beach resulted in multiple rescues and three fatalities during the month.
Table 4. Breakdown of storm reports submitted in Florida during the month of March (compiled from Iowa State University/Iowa Environmental Mesonet).
| Report Type | Number of Reports |
| Marine Thunderstorm Wind | 6 |
| Non-Thunderstorm Wind Damage | 2 |
| Non-Thunderstorm Wind Gust | 42 |
| Tornado/Waterspout/Funnel Cloud | 6/4/0 |
| Thunderstorm Wind Damage | 14 |
| Thunderstorm Wind Gust | 17 |
| Hail | 15 |
| Flood/FLash Flood | 1/0 |
| Heavy Rain | 17 |
| Rip Currents | 2 |
| Wildfire | 1 |
Drought-Related Impacts.
By the end of March 2021, abnormally dry conditions were widespread across the Florida Peninsula and parts of the southern Peninsula were in moderate drought. In early to mid-March, abnormally dry conditions existed across much of the Florida Peninsula and the western Panhandle regions. By the end of the month, pockets of moderate drought had formed in extreme southwestern Florida and southeast Florida. According to the U.S. Drought Monitor, 46 percent of the state was in abnormally dry conditions (D0) and 2 percent in moderate drought (D1) by the end of the month. Dry conditions are expected to continue, and the seasonal drought outlook indicates that drought development is likely through the spring across the Peninsula.
As of March 31, the Lake Okeechobee water level was at 14.44 ft. above sea level (Feet-NGVD29), which is right about average for this time of the year. At the first of the month, the water level was 15.32 ft. above sea level.

Agriculture-Related Impacts.
For the month of March, the Crop Progress - State Stories, produced monthly December through March, for Florida indicates that some pastures dried out by the end of the month due to warmer temperatures and a lack of rainfall. Cattle conditions remained mostly good during the month, and sugarcane harvesting continued. As temperatures rose during the month, Whiteflies and pest pressure were noted on vegetable crops in the southern part of the state. Many citrus fruits were harvested, including white and red grapefruit, Valencia oranges, and Honey, Tango and Royal tangerines. Field corn was planted and land was prepared for peanut and cotton crops in the Panhandle and northern parts of the state.
Appendix 1
Additional March departures from normal data for select Florida locations (Source: NWS).
| Station | Average Temperature (˚F) | Departure from Normal (˚F) | Total Rainfall (in.) | Departure from Normal (in.) |
| Gainesville | 64.9 | +2.6 | 3.24 | -1.09 |
| Sarasota | 69.1 | +2.5 | 1.84 | -2.02 |
| Melbourne | 69.7 | +3.8 | 0.87 | -2.41 |
| Fort Myers | 71.6 | +1.7 | 0.40 | -2.48 |
| West Palm Beach | 74.4 | +3.9 | 0.96 | -3.63 |
Appendix 2
Select daily record high maximum temperatures tied or broken during March (compiled from NOAA).
| Location | Date | Record (˚F) | Broken/Tied | Last |
| Clermont | 1 | 91 | Broken | 89 in 2017 |
| Sanford | 1 | 89 | Broken | 87 in 1997 |
| Lakeland | 1 | 88 | Broken | 86 in 1991 |
| Plant City | 2 | 89 | Tied | 89 in 2019 |
| Vero Beach | 17 | 89 | Broken | 87 in 1990 |
| Orlando | 17 | 89 | Broken | 88 in 2016 |
| Punta Gorda | 18 | 89 | Tied | 89 in 2015 |
| Fort Pierce | 19 | 90 | Tied | 90 in 1965 |
| Clermont | 26 | 94 | Broken | 90 in 1954 |
| Hastings | 26 | 87 | Broken | 86 in 2002 |
| Lisbon | 26 | 88 | Broken | 87 in 1965 |
| Plant City | 26 | 94 | Broken | 91 in 1974 |
| Sanford | 26 | 92 | Broken | 89 in 1974 |
| Gainesville | 26 | 89 | Broken | 87 in 2020 |
| Jacksonville | 26 | 90 | Broken | 88 in 1965 |
| Marianna | 27 | 88 | Tied | 88 in 2020 |
| Tampa | 27 | 90 | Broken | 89 in 2020 |
| Clermont | 28 | 94 | Broken | 91 in 2016 |
| West Palm Beach | 28 | 88 | Tied | 88 in 2016 |
| Pensacola | 28 | 86 | Broken | 84 in 2020 |
| Daytona Beach | 29 | 89 | Broken | 87 in 1961 |
| Stuart | 29 | 90 | Broken | 89 in 1996 |
| Tarpon Springs | 30 | 90 | Broken | 89 in 1997 |
| Tampa | 30 | 88 | Broken | 87 in 2020 |
| Naples | 31 | 90 | Broken | 88 in 2008 |
| Punta Gorda | 31 | 92 | Broken | 90 in 1981 |
Appendix 3
Select daily record high minimum temperatures tied or broken during March (compiled from NOAA).
| Location | Date | Record (˚F) | Broken/Tied | Last |
| Daytona Beach | 1 | 71 | Broken | 68 in 2003 |
| Hastings | 1 | 64 | Broken | 62 in 1998 |
| Melbourne | 1 | 69 | Tied | 69 in 1997 |
| Mountain Lake | 1 | 81 | Broken | 69 in 2003 |
| Daytona Beach | 1 | 69 | Broken | 66 in 2017 |
| Orlando | 1 | 72 | Broken | 68 in 2018 |
| Tampa | 1 | 71 | Broken | 70 in 2017 |
| Punta Gorda | 2 | 76 | Broken | 71 in 2007 |
| Lakeland | 2 | 69 | Tied | 69 in 1991 |
| Pensacola | 16 | 70 | Broken | 67 in 2016 |
| Marianna | 17 | 67 | Broken | 65 in 2002 |
| Pensacola | 17 | 72 | Broken | 69 in 1982 |
| Tallahassee | 17 | 67 | Broken | 66 in 2016 |
| Chipley | 18 | 71 | Broken | 67 in 1982 |
| Fort Lauderdale Beach | 18 | 74 | Tied | 74 in 2014 |
| Key West | 18 | 77 | Tied | 77 in 1986 |
| Orlando | 18 | 69 | Broken | 68 in 1943 |
| West Palm Beach | 18 | 74 | Broken | 73 in 2020 |
| Mountain Lake | 26 | 79 | Broken | 73 in 2015 |
| Perrine | 26 | 72 | Broken | 70 in 2016 |
| Marianna | 26 | 73 | Broken | 64 in 2017 |
| Daytona Beach | 26 | 70 | Broken | 67 in 1949 |
| West Palm Beach | 26 | 76 | Broken | 74 in 2005 |
| Orlando | 26 | 71 | Broken | 69 in 2020 |
| Pensacola | 26 | 72 | Broken | 68 in 2020 |
| Tallahassee | 26 | 69 | Broken | 66 in 2005 |
| Chipley | 27 | 72 | Broken | 67 in 1959 |
| Fort Lauderdale Beach | 27 | 75 | Tied | 75 in 2005 |
| Jasper | 27 | 66 | Broken | 64 in 2005 |
| Perry | 27 | 71 | Broken | 67 in 2011 |
| Wewahitchka | 27 | 69 | Broken | 67 in 1984 |
| Hastings | 29 | 67 | Broken | 65 in 2009 |
| Sanford | 29 | 70 | Broken | 69 in 2016 |
| Tampa | 29 | 73 | Broken | 72 in 2020 |
| Key West | 30 | 77 | Tied | 77 in 2020 |
| Vero Beach | 30 | 73 | Tied | 73 in 1990 |
| Fort Pierce | 31 | 75 | Broken | 73 in 1929 |
| Perrine | 31 | 73 | Broken | 71 in 2011 |
| Vero Beach | 31 | 74 | Broken | 72 in 1980 |
| Lakeland | 31 | 71 | Broken | 70 in 1975 |


