


The Florida Climate Center serves as the primary resource for climate data, information, and services in the state of Florida.

The Florida Climate Center achieves its mission by providing climate monitoring, research, and expertise to be applied by the people, institutions, and businesses of Florida and the surrounding region.
We provide direct service by fulfilling requests for climate and weather data and information in a variety of formats.
We perform research that advances the understanding of the climate variability and changes of Florida and the surrounding region.
We provide outreach in presentations and at events aimed at a variety of groups, interests, and ages.
Prepared by Lydia Stefanova, Daniel J. Brouillette, and David F. Zierden.
Florida Climate Center
The Florida State University
Tallahassee, FL

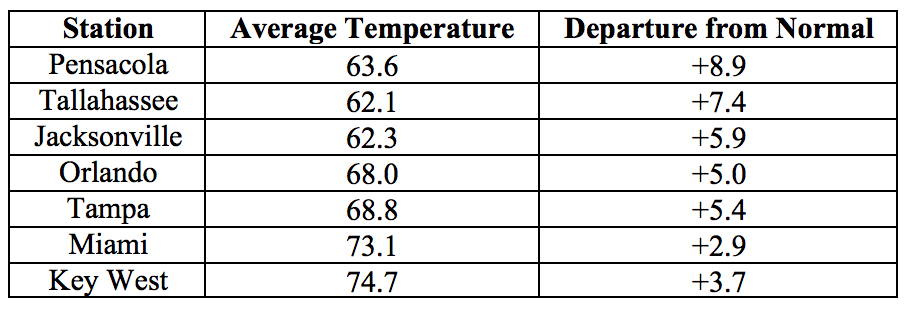
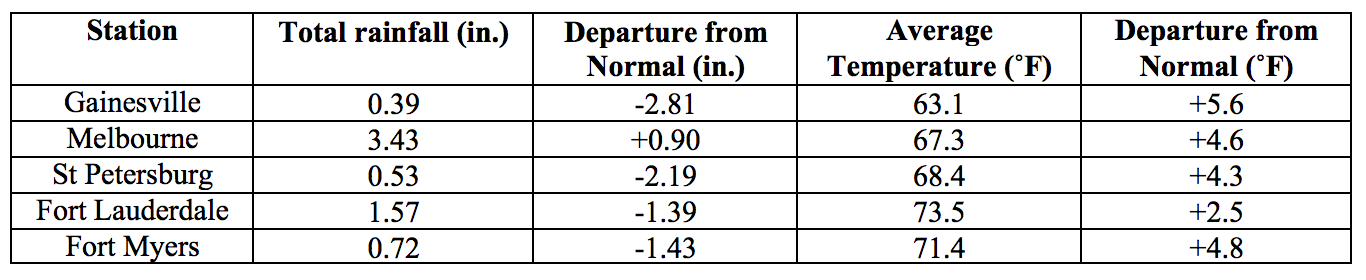
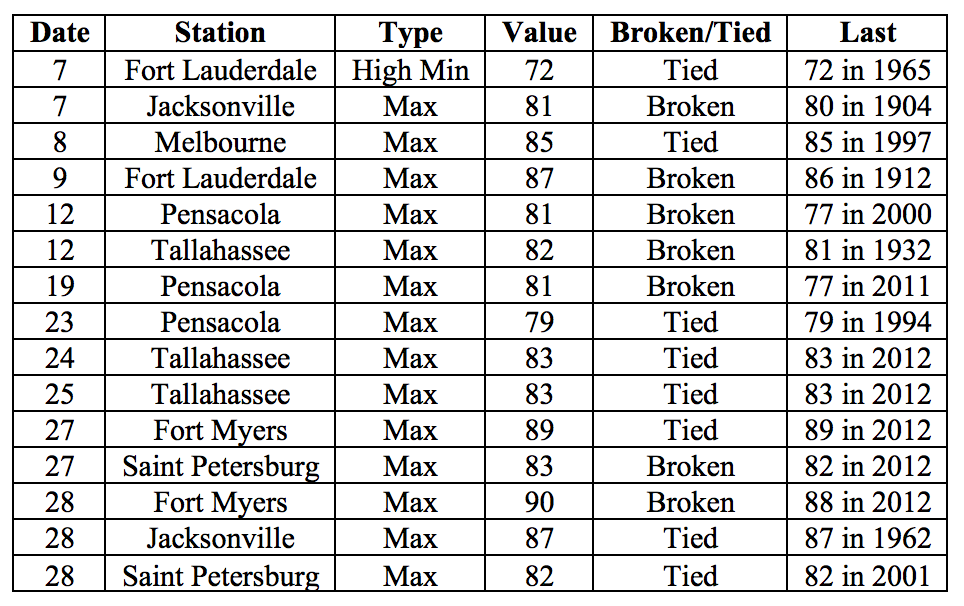
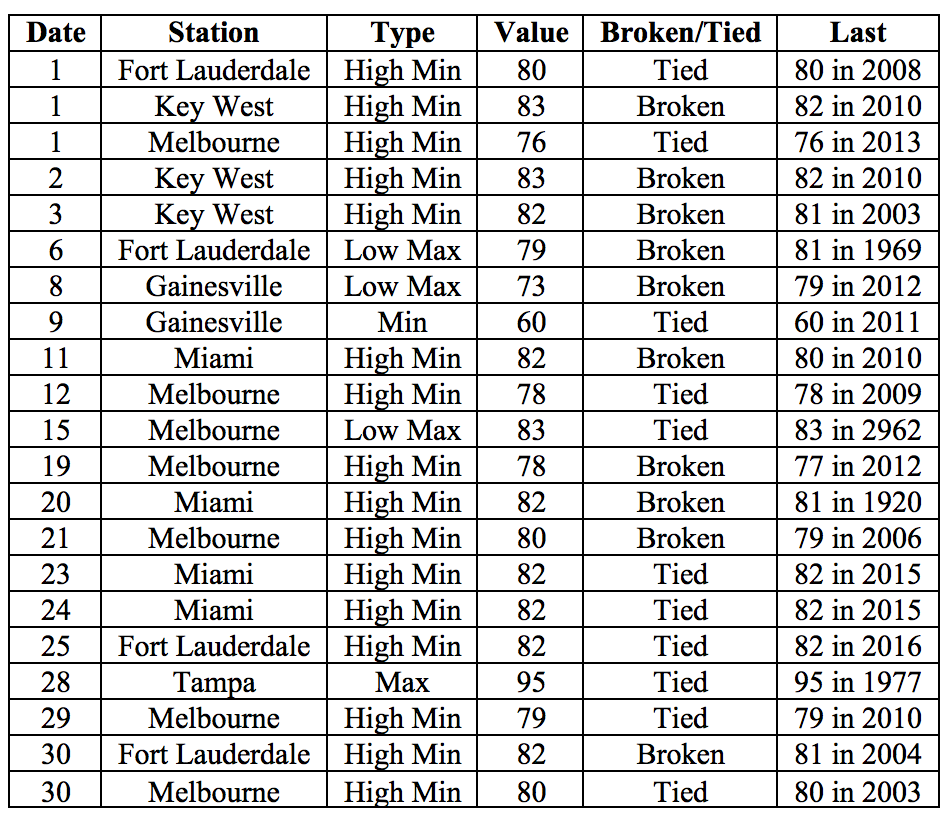
Average temperatures were above normal across the state in February. The departures from average temperatures in February 2017 were above normal across the entire state, ranging from +2.5˚F in Fort Lauderdale to 8.9˚F in Tallahassee (Table 1 and Appendix 1). Despite the warm average temperatures across the state, North Florida stations saw up to five nights with minimum temperatures in the 30s. A few major stations registered maximum temperatures at or above 90˚F on the last day of the month. February 2017 was the 2nd warmest in Pensacola, 3rd warmest in Fort Myers, and 5th warmest in Tallahassee and Tampa. Several high temperature records were tied or broken across the state (Appendix 2).
Table 1: February average temperatures and departures from normal (˚F) for selected cities.
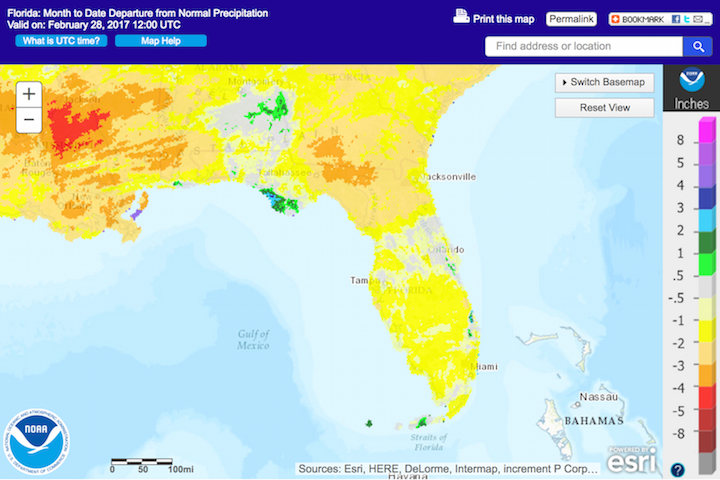
Rainfall totals in February were below normal for most of the state. Rainfall totals in February 2017 were below normal across the state except for small pockets in a few coastal areas (Figure 1). Departures from normal roughly ranged from -2.81” in Gainesville to +0.90” in Melbourne (Table 2 and Appendix 1), though localized parts of the state saw rainfall totals that were as much as 4.00” below normal to over 3.00” above normal (Figure 1). A few 24-hour precipitation records broken for the month (Table 3).
Table 2: February precipitation totals and departures from normal (inches) for select cities.
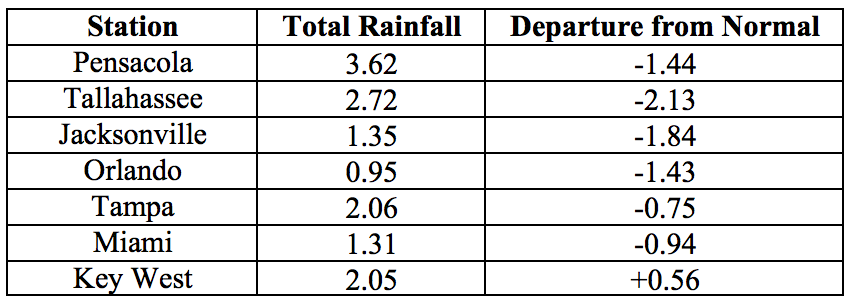
Table 3: Select daily rainfall records (inches) broken during February. (Compiled from NOAA, NWS).
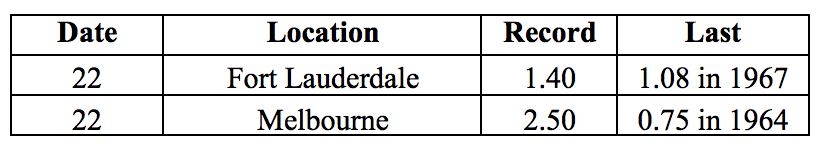
Figure 1: A graphical depiction of the monthly rainfall departure from normal (inches) for February is given in the figure below (courtesy of NOAA, NWS).
ENSO-neutral conditions are Present in the Pacific
Based on current data and forecast models, the Climate Prediction Center (CPC) has issued a Final La Niña Advisory. ENSO-neutral conditions are currently present, with sea surface temperatures (SST) near normal across the central and east-central Pacific Ocean, and above normal in the eastern Pacific Ocean. ENSO-neutral conditions are favored until mid-2017, with a possibility of El Niño by November 2017. The CPC seasonal outlook favors above-normal temperatures and near-normal precipitation through May 2017.
Hazardous Weather Events in January.
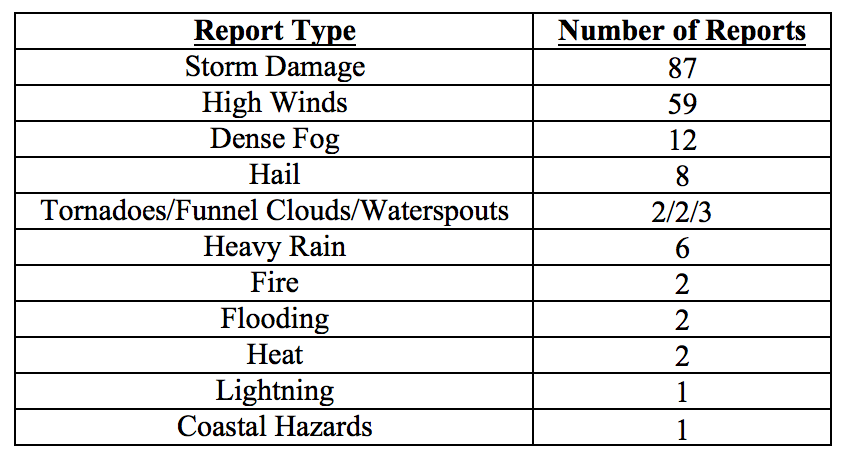
There were 187 hazardous weather reports issued in Florida in February 2017. A large proportion of these events (117, or over 60% of the total) were made on just one day, the 7th, when a deep upper level trough and enhanced southerly flow bringing moisture from the Gulf led to the development of a large complex of thunderstorms and severe weather across the North Florida. A number of thunderstorms were accompanied by hail, particularly in Alachua, Levy, and Columbia Counties. Severe weather that day included a weak tornado touchdown in Bradford County that caused damage to a local school and downed trees and power lines. An EF1 tornado with peak winds near 100mph, track length 0.6 miles, and track width of 0.1 miles was confirmed in St. Johns County. Thunderstorm wind gusts in excess of 40 mph and up to 60mph were reported in Columbia, Alachua, Clay, Duval, St. Johns, Brevard, and Volusia Counties. Gusts of 87mph were recorded in Okaloosa County. Uprooted trees caused several injuries in Okaloosa and Clay Counties, and a fatality in Calhoun County. Numerous storm damage reports of downed trees and powerlines, trees fallen on homes and vehicles or blocking roads, and damage to roofs and building structures came from Santa Rosa, Okaloosa, Walton, Holmes, Washington, Bay, Jackson, Calhoun, Gulf, Gadsden, Liberty, Leon, Wakulla, Jefferson, Madison, Taylor, La Fayette, Columbia, Gilchrist, Levy, Union, Bradford, Alachua, Nassau, Duval, Clay, and St Johns Counties. Lightning strike damage to a building was reported in Santa Rosa County.
On February 15th a passing cold front brought strong winds to the northeastern portion of the state. Non-thunderstorm wind gusts in excess of 40mph were recorded in Alachua, Duval, Marion, St. Johns, Columbia, Osceola, and Volusia Counties. A funnel cloud was spotted in Sumter County but did not touch down. Nickel-size hail was reported in Volusia County.
Dense fog was reported in the South Florida area on the 9th, with very low visibility causing dangerous driving conditions in Broward, Miami-Dade, Glades, and Hendry County, and problems at Miami International Airport and Fort Lauderdale International Airport. Dense fog was also reported on the 15th in Glades and Palm Beach County roads. Low visibility because of a wildfire smoke caused in several traffic accidents and prompted road closures in Polk County on the 17th. The fire consumed more than 4000 acres and destroyed nine mobile homes, two single-family dwellings, and several vehicles; over 800 homes were briefly ordered to evacuate.
Despite the overall dry weather for the month, there were several isolated heavy rain events throughout the month. Observers recorded daily totals of up to 3.6 inches in Brevard County on the 22nd, and up to 5.8 inches in Martin County on the 28th.
Two heat-related fatalities were reported this month, both involving young children left in a vehicle. An additional weather-related fatality resulted from rough surf and rip currents.
Table 4: Breakdown of storm reports submitted in Florida during the month of February (Compiled from Southeast Regional Climate Center.)
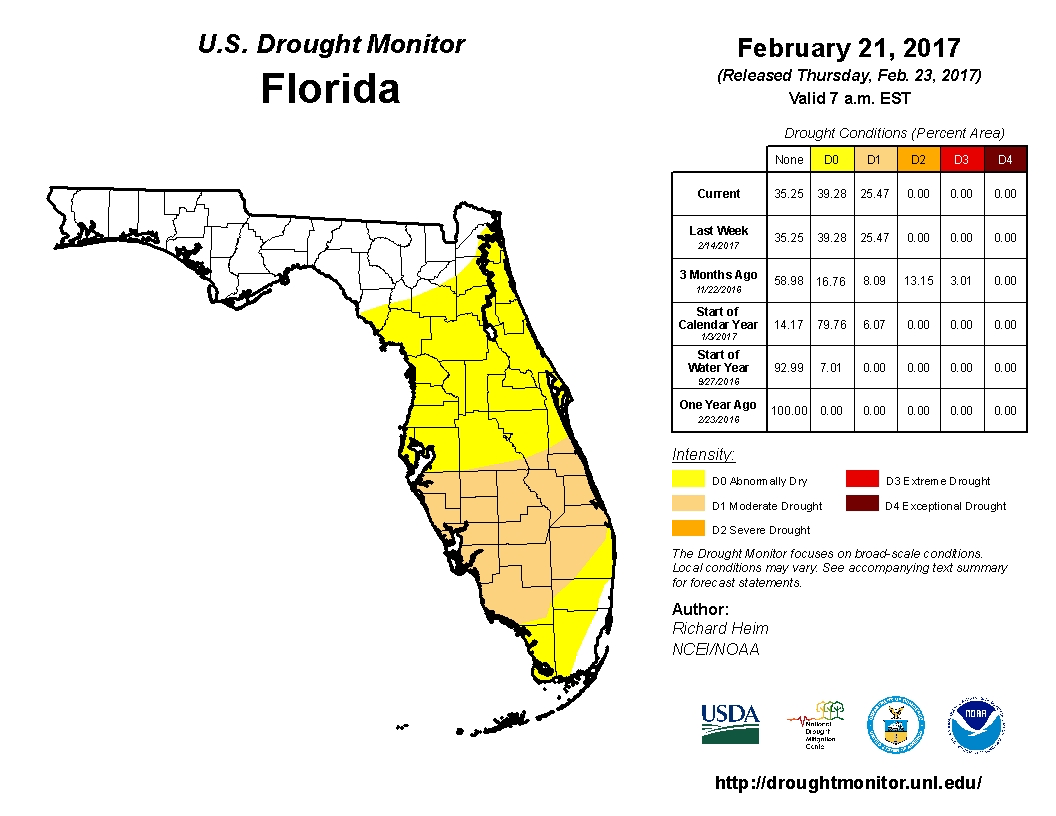
Drought-Related Impacts.
TAt the end of January, approximately 38% of the state, including the entire Panhandle, was drought free. The remaining 62%, constituting most of Peninsular Florida, were affected by abnormally dry (D0) conditions. By mid-month, much of South Central and parts of South Florida (including Manatee, Hardee, the southern portions of Polk, Osceola, and Brevard, Sarasota, De Soto, Highlands, Okeechobee, Indian River, Charlotte, Glades, Saint Lucie, Martin, Lee, Hendry, Collier, Palm Beach, and northwestern Broward County) had transitioned from D0 to moderate drought (D1) conditions. This remains the situation as of the latest Drought Monitor Report, issued on February 23, with approximately 35% of the state drought-free, nearly 40% under D0, and 25% under D1 conditions. Based on census data, roughly 3.8 million Florida citizens are currently impacted by drought. Due to the dry conditions, burn bans are in effect in Okeechobee, Glades, and Hendry Counties. Lake Okeechobee water levels at the end of the month were at 13.45 ft., which is below average for this time of the year.
Agriculture-Related Impacts.
Topsoil moisture levels at the beginning of the month were mostly adequate (46%) to short (39%). Some very short (10%) and surplus (5%) values were also reported. Most of peninsular Florida has been experiencing abnormally dry or moderate drought conditions, and temperatures have been mostly above normal.
Citrus groves have been heavy irrigated to compensate for the prolonged dry conditions, despite brief showers over portions of the citrus growing region. Ditches and canals are running low. Grapefruit harvest has continued at a steady pace, while tangerine harvest has been increasing, despite overall amounts being relatively low. The early orange harvest has continuously decreased throughout the month. Blooming is widespread and at various stages.
Pasture quality has continued its seasonal decline. Pastures in many parts of the state have been brown due to dry conditions across much of the states, and most ranchers are providing supplemental feed. There have been reports of improving pasture conditions in Indian River and Brevard Counties where cattle have had access to good grazing. Overall, most cattle remain in fair to good condition.
Fruit and vegetable growers saw some damage from high winds. Unseasonably warm temperatures have caused early maturing and underweight harvest for some cool weather crops in Palm Beach County. Some producers in Dixie and Gilchrist are planting melons earlier than usual.
Spring field crop planting activities have begun in Suwannee, Washington, Flagler and Putnam Counties. Sugarcane harvesting continues on schedule in Broward, Glades, Hendry and Palm Beach Counties.
Appendix 1: Additional February departures from normal data for Florida locations.
Appendix 2: Select daily maximum and minimum temperature records (° F) broken during February (compiled from NOAA, NWS).
Prepared by Lydia Stefanova, Daniel J. Brouillette, and David F. Zierden.
Florida Climate Center
The Florida State University
Tallahassee, FL
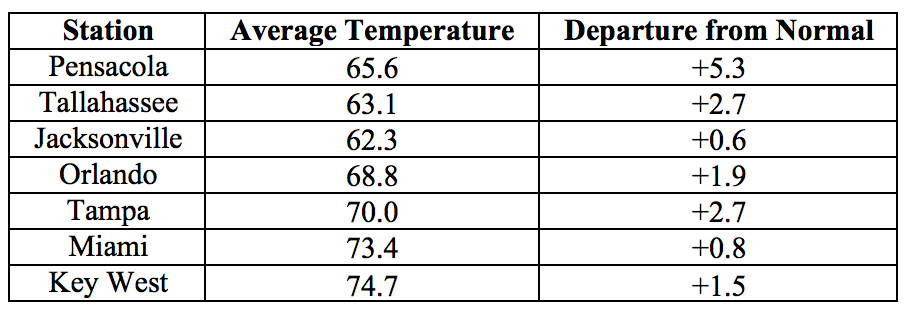
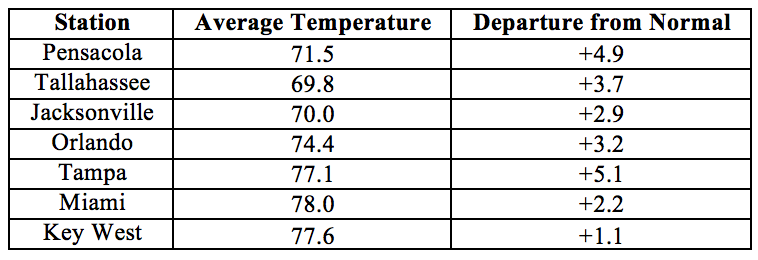
Average temperatures in March were mostly above normal for the state. The departures from average temperatures in March 2017 were above normal for most of the state, with some the exception of a few slightly below-normal values in the peninsular portion. Departures from normal at major reporting stations ranged from -0.2˚F in Fort Myers to +5.3˚F in Pensacola. Despite the overall warm temperatures, most of north Florida experienced a hard freeze after a mid-month strong cold front. The temperature fell to 21˚F at Cecil Field in Jacksonville on March 16th – the lowest temperature of the 2016-17 cold season statewide. Unofficially, this was the latest date in the spring when a temperature this low has ever been recorded in Florida. Throughout the month, some high and low temperature records were tied or broken across the state (Appendix 2). March 2017 was the 10rd warmest in Pensacola.
Table 1: March average temperatures and departures from normal (˚F) for selected cities.
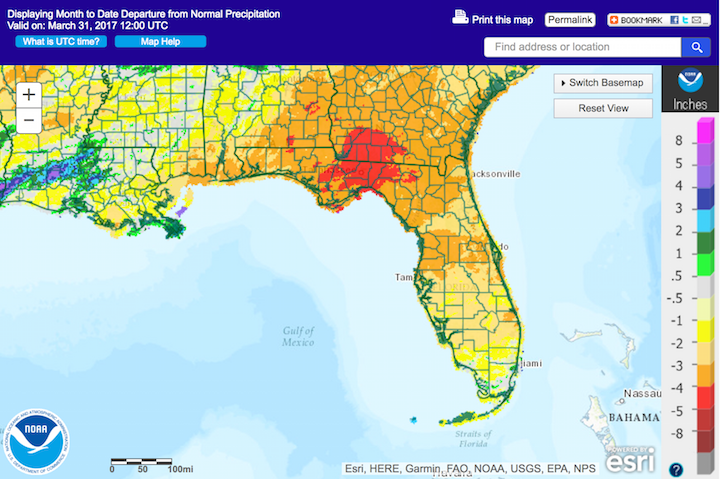
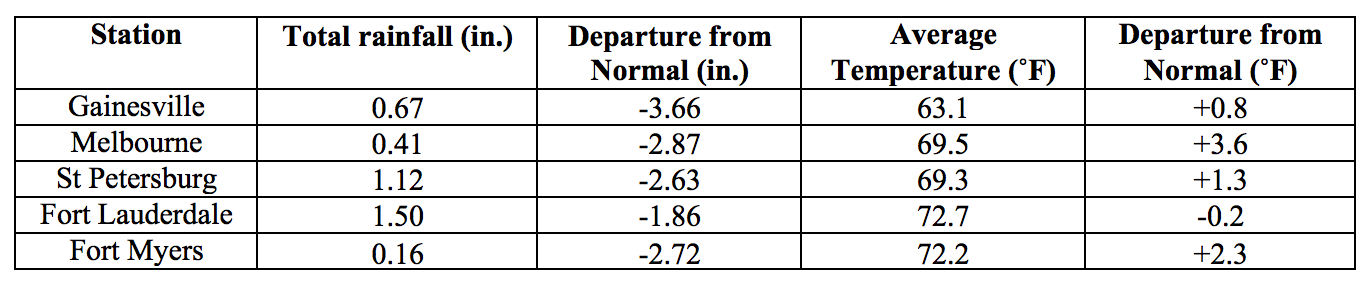
Rainfall totals in March were below normal for most of the state. Rainfall totals in March 2017 were below everywhere in the state except for parts of southeast Florida (Figure 1). Departures from normal at major reporting stations ranged from -4.75” in Tallahassee to +0.92” in Miami (Table 2 and Appendix 1), although parts of the state saw rainfall totals that were as much as 5.00” below normal (Figure 1). March 2017 was the 2nd driest on record for Orlando, 8th driest on record for Gainesville, and 10th driest on record for Tallahassee and Fort Myers. One 24-hour precipitation record was broken for the month (Table 3).
Table 2: March precipitation totals and departures from normal (inches) for select cities.
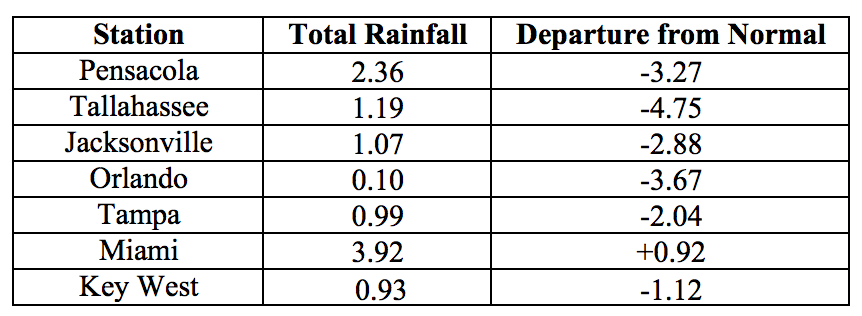
Table 3: Select daily rainfall records (inches) broken during March. (Compiled from NOAA, NWS).

Figure 1: A graphical depiction of the monthly rainfall departure from normal (inches) for March is given in the figure below (courtesy of NOAA, NWS)
ENSO-neutral conditions are Present in the Pacific.
Based on current data, the Climate Prediction Center (CPC) ENSO Alert System Status is set to Not Active. ENSO-neutral conditions are currently present, with sea surface temperatures (SST) near average across the central and east-central Pacific Ocean, and above average in the eastern Pacific Ocean. ENSO-neutral conditions are favored through at least the spring of 2017, with increasing chances of El Nino development into the fall of 2017. The CPC seasonal outlook favors above-normal temperatures and near-normal precipitation through June 2017.
Hazardous Weather Events in March.
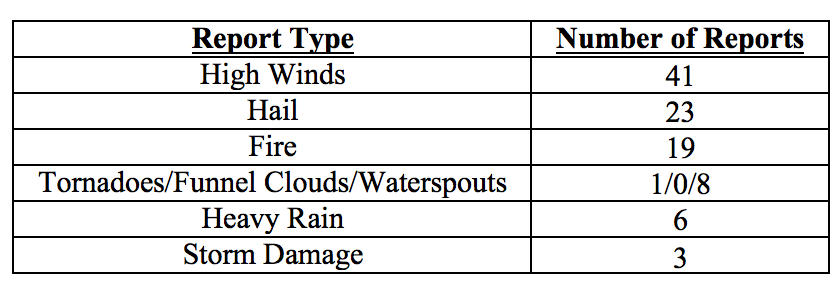
March 2017 had a total of 95 local storm reports logged in the state (see Table 4 for breakdown by type). Over half of these reports came on a single day, the 23rd, when a cold front swept through the state, bringing high winds and hail to portions of Central and South Florida. Some reports of high winds and storm damage were also associated with the frontal passage on the 14th, and an EF1 tornado with estimated peak winds of 95 mph was confirmed in Broward County. There were waterspouts sighted on several days of the month, from coastal Palm Beach County to the Florida Keys, including at least 14 waterspouts spotted from Key West on a single day, the 28th. Due to the dry conditions, particularly in the peninsular portion of the state, there were a number of wildfires this month. Wildfires were reported in Alachua, Miami-Dade, Collier, Orange, Volusia, Nassau, Flagler, Brevard, and Marion Counties. Largest of these was a wildfire first reported on the 5th in Collier County, which grew to over 7,500 acres by the 8th of the month. This fire destroyed several buildings and vehicles, and heavy smoke from its burning made it necessary to close several roads and portions of I75. A 250-acre wildfire near Bryceville in Nassau County on the 22nd required evacuation of residents, and 10 homes were damaged or destroyed. Evacuations were also prompted by wildfires in a small community in Flagler County on the 24th, and near Fernandina Beach in Nassau County on the 31st.
Table 4: Breakdown of storm reports submitted in Florida during the month of March (Compiled from Southeast Regional Climate Center.)
Drought-Related Impacts.
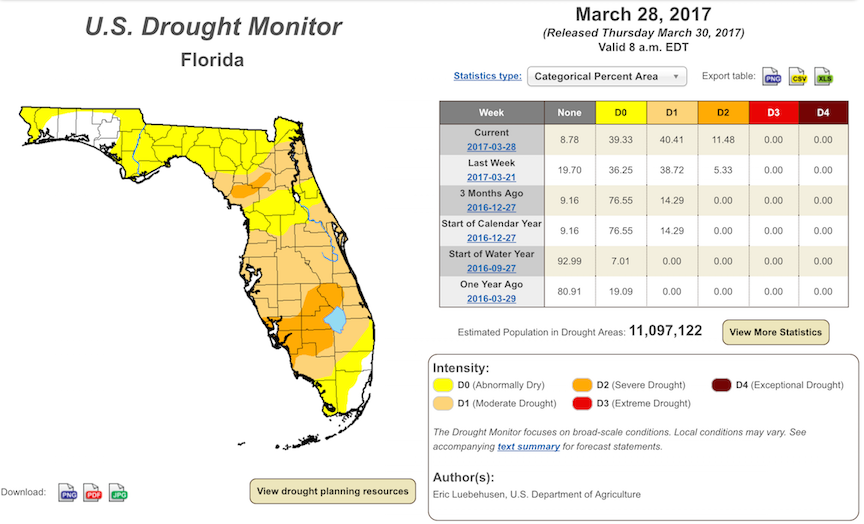
At the end of February and in early March, approximately 35% of the state was drought-free, nearly 40% was abnormally dry (D0), and 25% was experiencing moderate drought (D1) conditions, with most of peninsular Florida experiencing either D0 or D1 conditions. As the month progressed, the dry conditions extended to the north and west, and intensified. As of the latest drought monitor report, issued on March 28th, less than 9% of the state is drought-free, approximately 40% is abnormally dry (D0), another 40% is experiencing moderate drought (D1), and slightly over 11% is experiencing severe drought (D2). D1 or worse conditions are present over most of peninsular Florida, with D2 conditions currently affecting most of Desoto, Highlands, Okeechobee, Glades, Lee, and Hendry Counties, as well as parts of Sarasota, Collier, Levy and Alachua Counties. There are an estimated 11 million Florida residents in the drought-affected areas of the state. Due to the dry conditions, burn bans are currently in effect in Seminole, Osceola, Okeechobee, Glades, and Hendry Counties. At the end of the month, Lake Okeechobee water levels were at approximately 12.56 ft., which is below average for this time of the year.
Agriculture-Related Impacts.
At the beginning of March, topsoil moisture levels were mostly short (46%) to adequate (40%), although 10% of very short and 4% of surplus values were also reported. Soil moisture conditions worsened as the month progressed, ending at 17% very short, 47% short, 32% adequate, and 4% surplus. Worsening drought conditions have affected the entire citrus growing area, with large portions of it in moderate to severe drought, requiring heavy irrigation, despite the occasional light rain. Citrus trees are in full bloom or in areas where bloom this year was early, already forming small fruit. Potato and corn planting has been underway, with some temporary slowdown due to the mid-month below-freezing temperatures across the north and central portion of the state. The hard freezes caused significant damage to many fruit and vegetable crops in the affected regions and set back planting activities. Much of the watermelon plantings in these areas were lost and are being replanted. The sugarcane harvest has continued on schedule. Cattle are holding at fair to good condition, but pastures remain dry and continue to seasonally decline. Many farmers are using supplemental feeding to offset the mostly fair to poor pasture quality. Hay supplies are reported to be running low in Brevard County, and pastures in the county have also seen wildfires and lack of suitable water.
Appendix 1: Additional March departures from normal data for Florida locations.
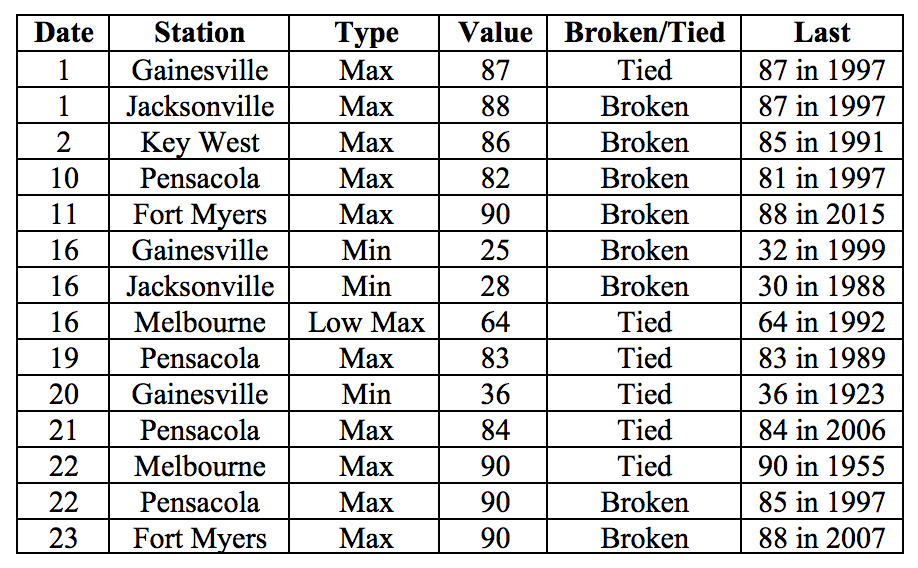
Appendix 2: Select daily maximum and minimum temperature records (° F) broken during March (compiled from NOAA, NWS).
Prepared by Lydia Stefanova, Daniel J. Brouillette, and David F. Zierden.
Florida Climate Center
The Florida State University
Tallahassee, FL
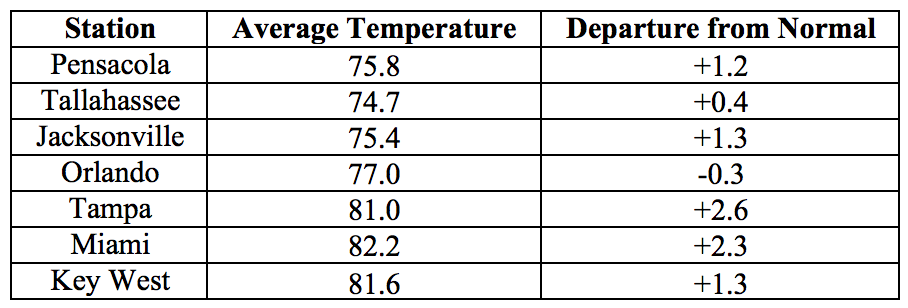
Average temperatures in April were mostly above normal for the state. The departures from average temperatures in April 2017 were above normal across the entire state, ranging from +1.1˚F in Key West to +5.1˚F in Tampa (Table 1 and Appendix 1). Minimum temperatures in Melbourne on multiple days exceeded the previously established record for the month of April. This was the 2nd warmest April in Tampa, 6th warmest in Pensacola, and 8th warmest in Miami. Multiple warm temperature records were tied or broken across the state (Appendix 2).
Table 1: April average temperatures and departures from normal (˚F) for selected cities.
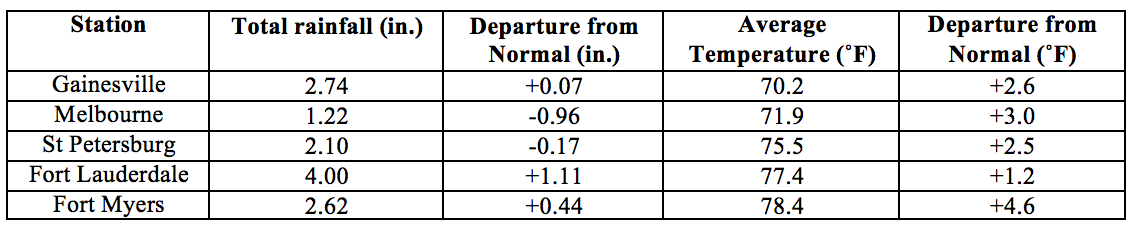
Rainfall totals in April were varied across the state. Rainfall totals in April 2017 were above normal for parts of North and Southeast Florida, including the Florida Keys, and below normal for the rest of the state (Figure 1). A significant portion of the state, particularly parts of Central Florida, received less than a quarter of the normal rainfall for the month. Departures from normal roughly ranged from -2.68” for Orlando to +1.88” in Key West (Table 2 and Appendix 1), though localized parts of the state saw rainfall totals that were as much as 3.00” below normal to 8.00” above normal (Figure 1). April 2017 was the second driest in the 126-year long record for Orlando, with only a trace amount of rainfall recorded. A few 24-hour precipitation records broken for the month (Table 3).
Table 2: April precipitation totals and departures from normal (inches) for select cities.
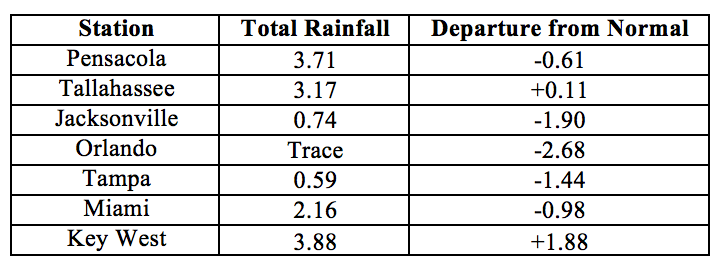
Table 3: Select daily rainfall records (inches) broken during April. (Compiled from NOAA, NWS).
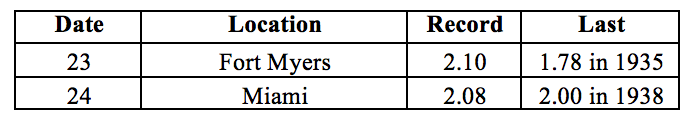
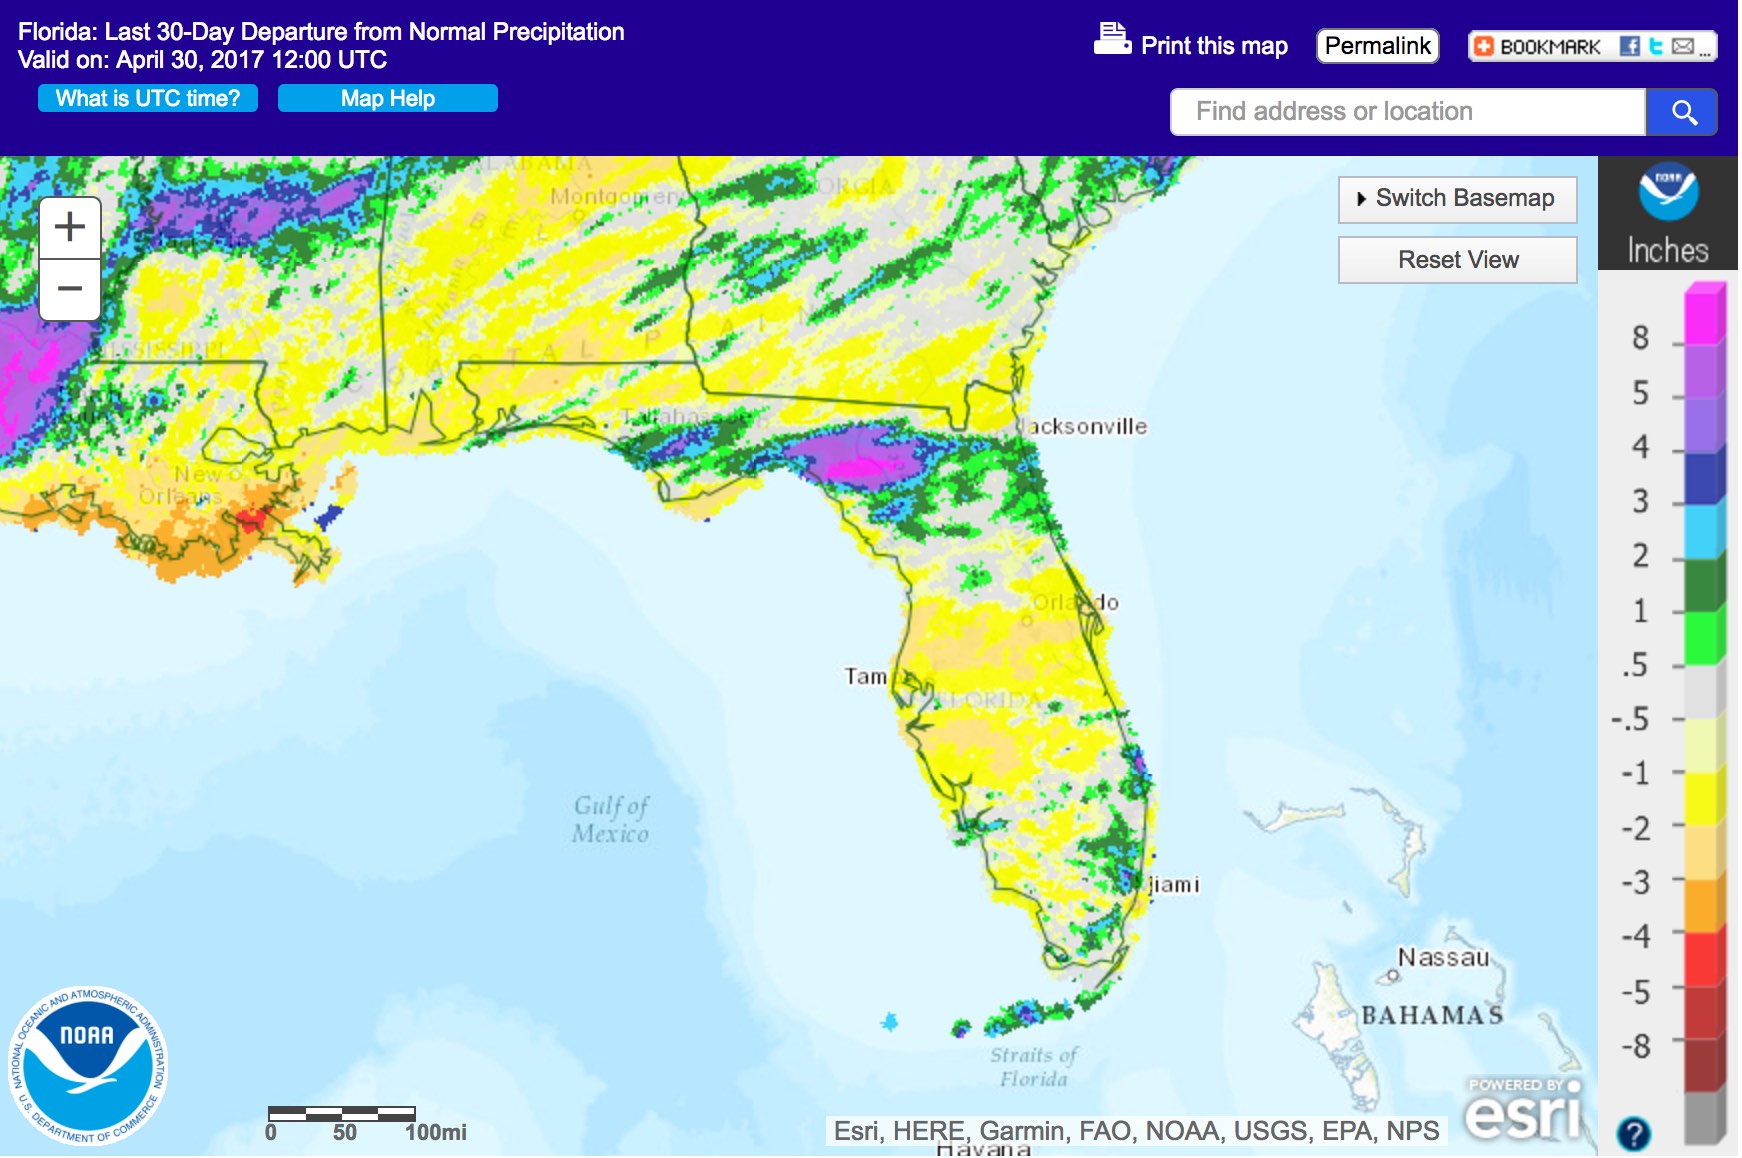
Figure 1: A graphical depiction of the monthly rainfall departure from normal (inches) for April is given in the figure below (courtesy of NOAA, NWS)
ENSO-Neutral Conditions are Present in the Pacific.
Based on current data and forecast models, the Climate Prediction Center (CPC) ENSO Alert System Status is set to “Not Active”. ENSO-neutral conditions are currently present, with sea surface temperatures (SST) near-average across the central Pacific, and above-average in the eastern Pacific Ocean. ENSO-neutral conditions are favored at least through the end of spring, with increasing probability of El Niño developing by late summer and fall 2017. The CPC seasonal outlook favors above-normal temperatures and near-normal precipitation through July 2017.
Hazardous Weather Events in April.
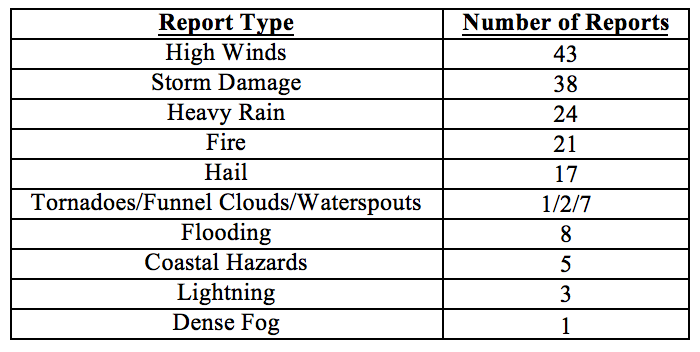
There were a total of 170 hazardous weather reports issued by the National Weather Service in Florida for April 2017 (See Table 4).
With the warming temperatures swimmers are increasingly venturing into surf waters and encounters with rip currents become more frequent. Five separate rip current incidents were reported in April along the state’s Atlantic Coast, between Miami Beach and New Smyrna Beach. Three of these incidents involved fatalities, and a dozen victims were successfully rescued.
The overall dry and hot weather of the past few months has set the stage for significant fire danger across the state. There were 21 separate fire reports logged by the National Weather Service during the month. Fires in Broward, Clay, Collier, Duval, Hernando, Lake, Osceola, Marion, and Seminole Counties required road closures and evacuations, and in some cases buildings, structures, and vehicles were damaged or destroyed. Major wildfires are currently burning in Alachua, Baker, Bradford, Clay, Collier, Hernando, Highlands, Lake, Nassau, Orange, Osceola, Pasco, Polk, Putnam, Seminole and Volusia Counties. As of April 30th, Florida has a total of 28 active wildfires that are over 100 acres in size, affecting a total area of about 146,000 acres.
The overwhelming majority (over 80%) of the remaining reports were the result of two frontal systems passing over the state in quick succession between the 3rd and 6th if the month. High winds were reported from Pensacola to Panama City, from Cedar Key to Fort Myers, and from Jacksonville to Melbourne. Associated storm damage was reported across the panhandle and the I75-corridor to Ocala, and along the Atlantic coast between Jacksonville and Daytona Beach. These systems brought heavy rains and flooding in Baker, Bayr, Clay, Flagler, Lafayette, St. Johns, Suwannee and Taylor Counties, with localized rainfall amounts up to 10-12 inches (estimated by radar), and over a foot of water along some local roads. Consequences from these rains included a sinkhole measuring 50 by 75 feet on Hwy 51 in Lafayette County. The storms brought hail of up to 1.25 inches to Gadsden, Gulf, Duval, Hamilton, Leon, Marion, Okaloosa, Polk, Seminole, and St. Johns Counties. Two waterspouts were spotted offshore from Pensacola Beach on the 3rd, and an EF0 tornado, which destroyed several structures, was recorded in Fort Myers on the 6th.
On the 23rd of the month, a strong trough brought large amounts of rain to the Atlantic Coast, from Port St. Lucie to Miami, with localized measurements of 6 or more inches of rain over a 12-hour period. These rains contributed to lifting of the abnormal drought fin the southeast portion of the state.
Table 4: Breakdown of storm reports submitted in Florida during the month of April (Compiled from Southeast Regional Climate Center.)
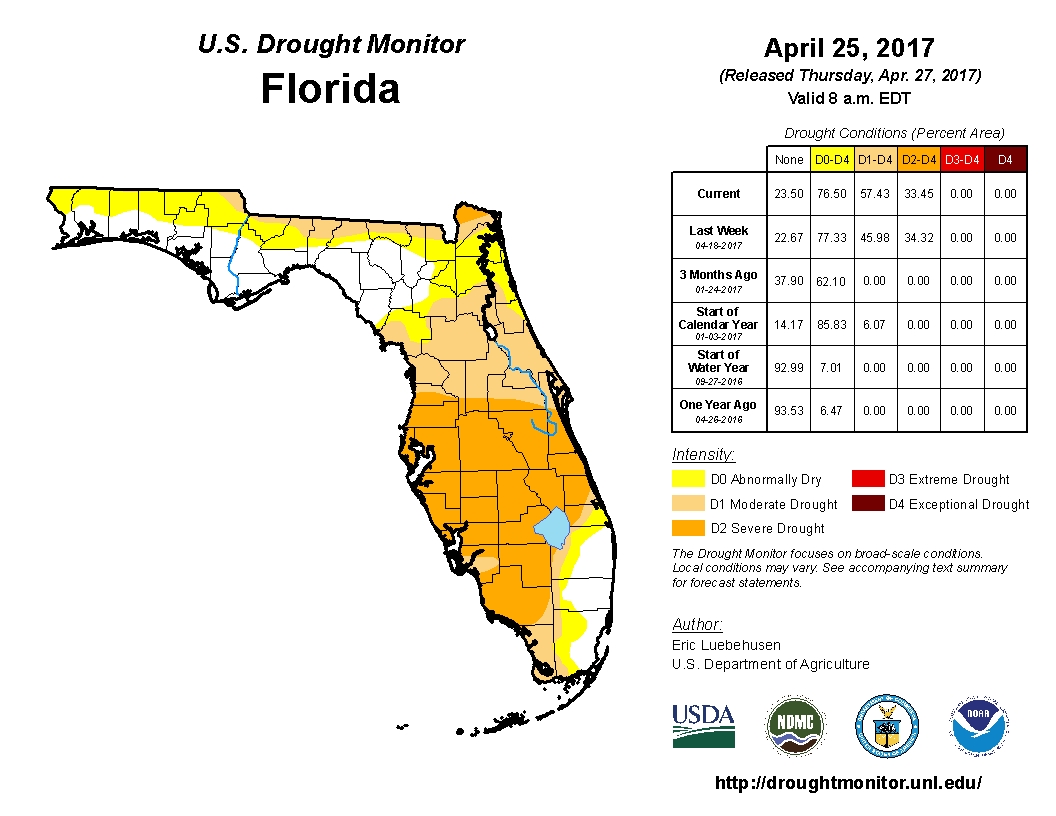
Drought-Related Impacts.
At the end of March, less than 9% of the state was drought-free, approximately 40% was abnormally dry (D0), another 40% was experiencing moderate drought (D1), and slightly over 11% was experiencing severe drought (D2). D1 or worse conditions are present over most of peninsular Florida, with D2 conditions affecting most of Desoto, Highlands, Okeechobee, Glades, Lee, and Hendry Counties, as well as parts of Sarasota, Collier, Levy and Alachua Counties. By the first week of April, abnormally dry conditions in the panhandle were eliminated or significantly reduced, but later in the month crept back in, particularly in the northern parts of counties along the Georgia border. The area of severe drought (D2) in south central Florida gradually expanded in all directions, extending, by the end of the month, from Collier County in the South to Hernando, Sumter, Lake, Orange, and Brevard Counties in the North. D2 conditions were also affecting large portions of Nassau County. Heavy rains on the 23rd of the month cleared the D0 conditions from large portions of Palm Beach, Broward, and Miami-Dade counties. As of the latest U.S. Drought Monitor report, issued on April 25, about 23.5% of the state is drought-free, 19% is under D0, 24% under D1, and 33.5% under D2 conditions. In all, about drought conditions are currently affecting an estimated 11 million Florida residents. Burn bans are currently in effect in thirty Florida counties, including Alachua, Baker, Bradford, Brevard, Charlotte, Citrus, Collier, Glades, Hendry, Hernando, Highlands, Hillsborough, Indian River, Lake, Levy, Manatee, Marion, Nassau Counties, Okeechobee, Orange, Osceola, Palm Beach, Pasco, Polk, Putnam, Sarasota, Seminole, St. Lucie, Union, and Volusia.
At the end of the month, Lake Okeechobee water levels were at 11.61 ft., which is about two feet below average for this time of the year.
Agriculture-Related Impacts.
At the beginning of April, topsoil moisture levels across the state were mostly (43%) short, with another 25% at very short, 28% at adequate, and 4% at surplus levels. The citrus growing area has been experiencing above-normal temperatures and below-normal rainfall. Drought conditions have been worsening such that the entire region, with minor exceptions, is in severe drought. Ditches and canals in most areas are dry. Pasture and range conditions are mostly poor to fair and declining with the dry conditions, but cattle are holding at mostly fair to good condition with supplemental feeding. In many parts of the states farmers are shipping in hay and water, and digging new wells where current ones have dried out. Field activities picked up after the frost in March, with corn planting in Escambia, Flagler, Hamilton, Jackson, Lafayette, Putnam, Suwannee, and Walton counties. Peanut planting was underway in Gilchrist and Washington Counties, and started but temporarily delayed due to dry conditions in Dixie and Levy Counties. Potato harvesting was reported in Flagler, Putnam, and St. Johns. Sugarcane harvesting is mostly finished in Broward, Glades, Hendry, and Palm Beach Counties, with some delays in completion due to drought conditions and fire hazard. A number of vegetable crops are suffering from whiteflies whose population numbers have exploded as a result of the hot, dry conditions and the unseasonably warm winter. Some watermelon and cantaloupe plantings in Jefferson counties were damaged by hail and required replanting. A wide variety of fruit and vegetable crops is being harvested and coming to market, including watermelon, blueberries, strawberries, broccoli, carrots, cauliflower, greens, and onions.
Appendix 1: Additional April departures from normal data for Florida locations.
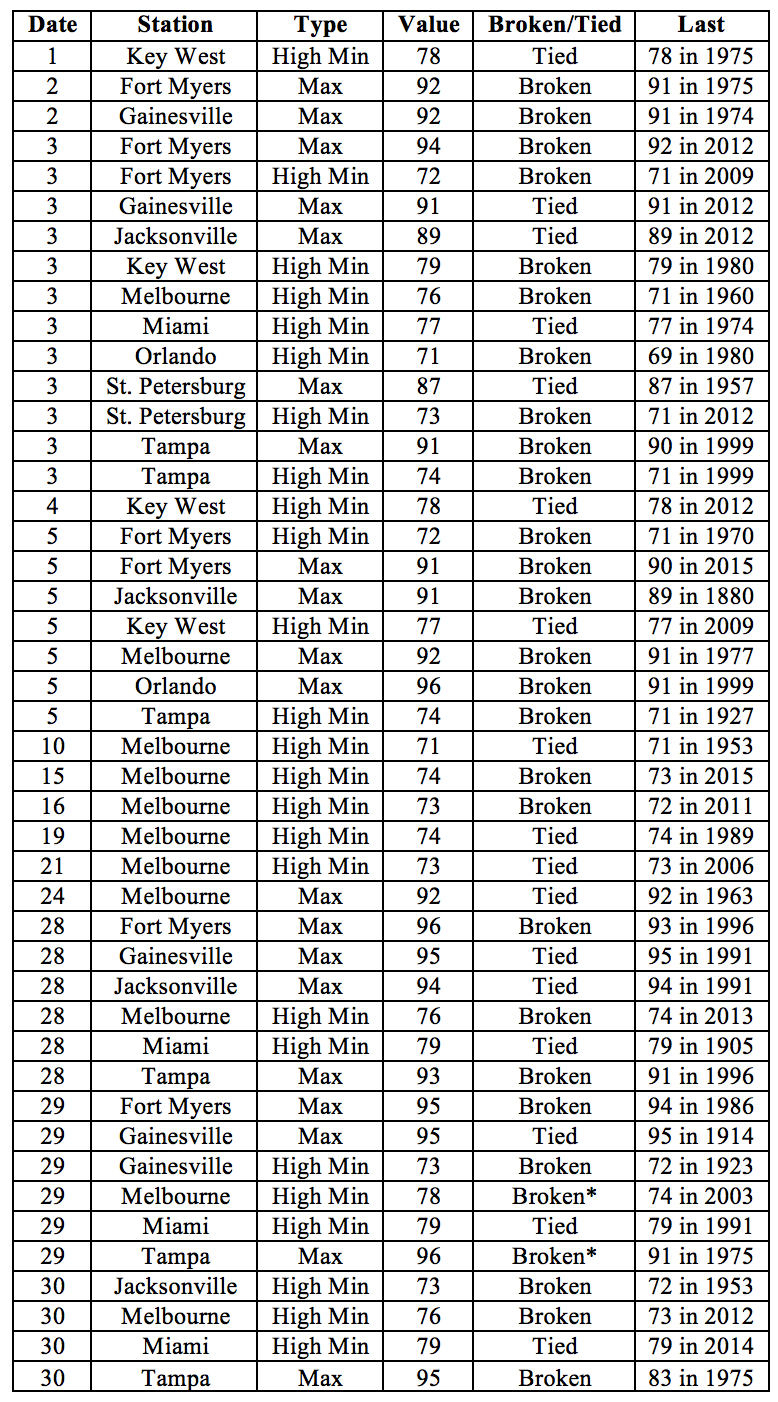
Appendix 2: Select daily maximum and minimum temperature records (° F) broken during April (compiled from NOAA, NWS).
Prepared by Lydia Stefanova, Daniel J. Brouillette, and David F. Zierden.
Florida Climate Center
The Florida State University
Tallahassee, FL
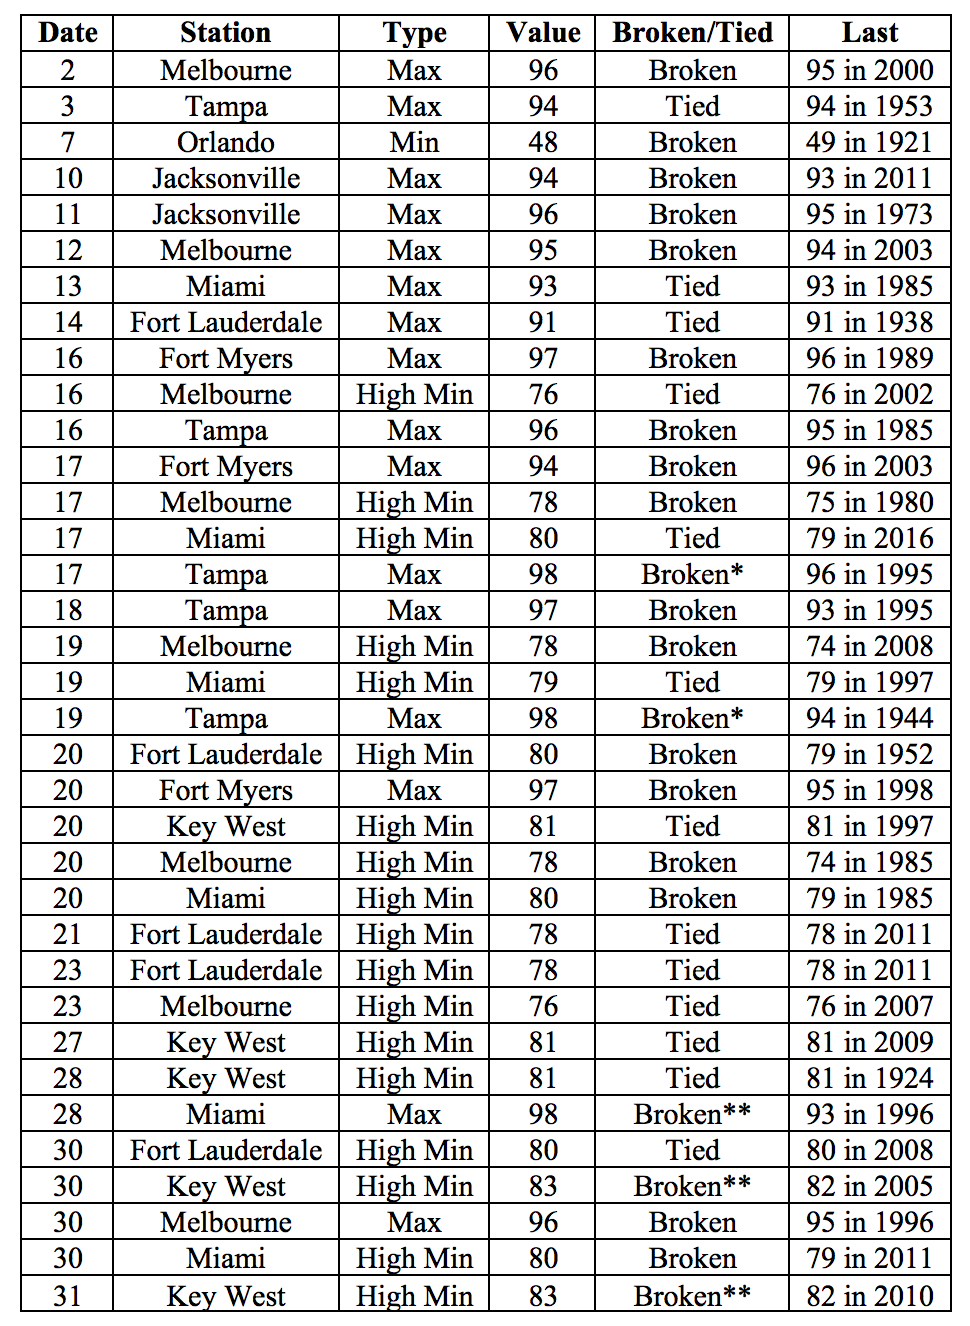
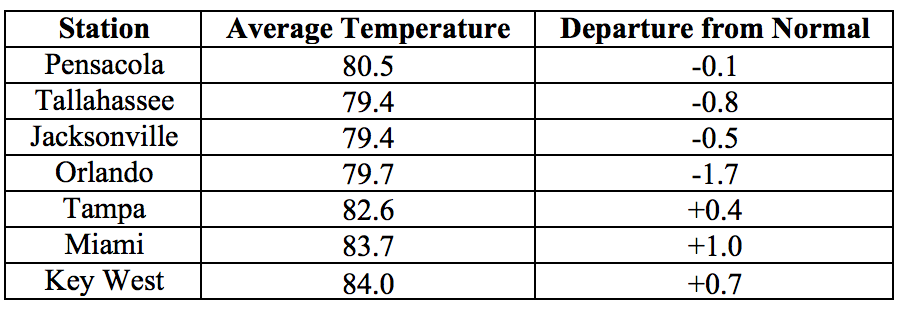
Average temperatures in May were mostly above normal across the state. The departures from average temperatures in May 2017 were above normal for most of the state, ranging from -0.3˚F in Orlando to +2.8˚F in Melbourne (Table 1 and Appendix 1). May 2017 was the 2nd warmest on record in Miami, 4th warmest in Tampa, 6th warmest in Fort Myers, and 7th warmest in Fort Lauderdale. Maximum temperatures at or above 95˚F were observed on several days of the month for many stations across peninsular Florida. A number of warm temperature records were tied or broken across the state (Appendix 2).
Table 1: May average temperatures and departures from normal (˚F) for selected cities.
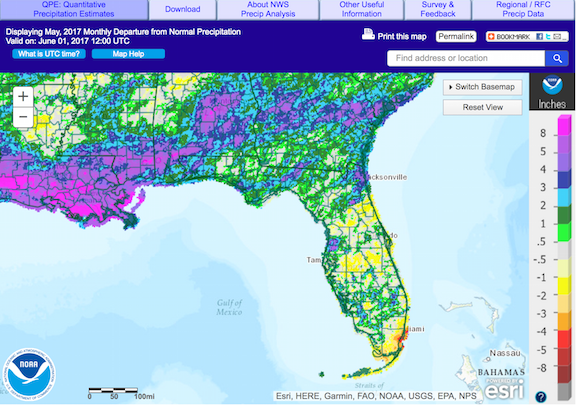
Rainfall totals in May were mixed. Rainfall totals in May 2017 were above normal in most of the panhandle and parts of peninsular Florida, and below normal for portions of central and south Florida (Figure 1). Departures from average roughly ranged from -2.65” in Miami to 2.90” in Pensacola (Table 2 and Appendix 1), though localized parts of the state saw rainfall totals that were as much as 5.00” below normal to 8.00” above normal (Figure 1). A few 24-hour precipitation records were broken for the month (Table 3).
Table 2: May precipitation totals and departures from normal (inches) for select cities.
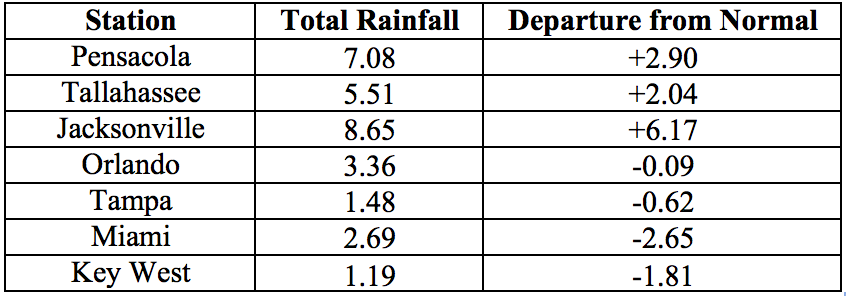
Table 3: Select daily rainfall records (inches) broken during May. (Compiled from NOAA, NWS).
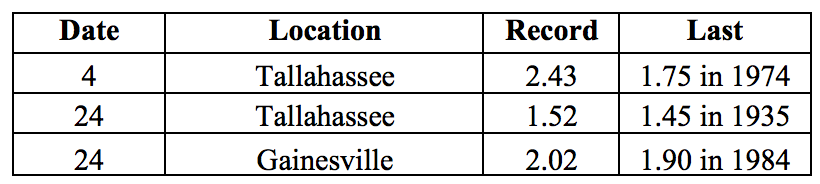
Figure 1: A graphical depiction of the monthly rainfall departure from normal (inches) for May is given in the figure below (courtesy of NOAA, NWS)
ENSO-Neutral Conditions are Present in the Pacific.
Based on current data and forecast models, the Climate Prediction Center (CPC) the ENSO alert system is currently set to “Not Active”. ENSO-neutral conditions are currently present, with sea surface temperatures (SST) near- to above-average across most of the Pacific Ocean. ENSO-neutral and El Nino conditions are approximately equally favored through summer and fall seasons. The CPC seasonal outlook favors above-normal temperatures for Florida through August 2017.
Hazardous Weather Events in May.
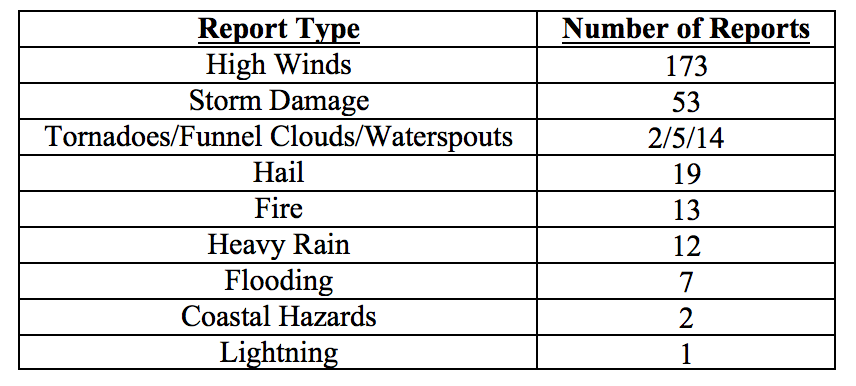
There were a total of 301 hazardous weather reports issued in Florida in May 2017. The majority of reports concerned high winds and storm damage (see Table 4). The first cluster of such reports was associated with a cold front entering the state from the northwest on the 1st and sweeping over the state over the next two days, quickly followed by a second one between the 3rd and 6th. High winds in that time span were reported in Alachua, Bay, Columbia, Duval, Escambia, Franklin, Gilchrist, Hernando, Hillsborough, Jefferson, Levy, Okaloosa, Okeechobee, Pasco, Pinellas, Santa Rosa, Sarasota, St Johns and St Lucie County. Storm damage was reported in a number of these counties, including downed trees and power lines in Duval, Franklin, Jefferson, Levy, Okaloosa, and Santa Rosa County. Hail with diameter of 0.88 inches was seen in Hillsborough County on the 6th.
On the 12th, a line of strong thunderstorms was observed between DeFuniak Springs in Walton County to Tallahassee in Leon County. Thunderstorm wind gusts of 59mph were measured in Leon County; downed trees and branches and some power outages were reported in Walton, Jackson, Leon and Wakulla Counties. Strong thunderstorm wind gusts up to 49mph were measured in Brevard, Volusia, Duval and St. Johns Counties on the following day. Hernando County reported heavy rain from several home weather stations, with 6-hour accumulations up to 8.7 inches.
Nearly a third (90) of all hazardous weather reports for the month occurred on the 24th, when another strong cold front swept through the state. High winds (both non-thunderstorm and thunderstorm wind gusts) and storm damage (downed trees, some vehicle and minor damage to fences and roofs) were reported across the state, from Pensacola to Jacksonville across the panhandle, and throughout the peninsular portion of the state all the way to Key West. Some heavy rains were observed in Jacksonville and its vicinity.
Between the 30th and 31st, a low-level trough gave rise to a thunderstorms over the northwest and central portions of the state, with reports of strong thunderstorm winds and storm damage in Alachua, Brevard, Clay, Duval, Flagler, Hillsborough, Nassau, Orange, and St. Johns Counties. Heavy rainfall was observed with some of these thunderstorms. Two waterspouts were reported during this period, one along the St. Johns River in Clay County, and the other just offshore from Jacksonville Beach in Duval County. There were several reports of hail for this period, in Alachua, Duval, Flagler, Nassau, and St. Johns Counties, with hailstone diameter up to 2 inches.
A number of waterspouts have been observed throughout the month along the lower Florida Keys, consistent with the typical increase of frequency associated with warm season months.
Two incidents involving rip currents, with several injuries and one fatality, were reported this month, in West Palm Beach and Jupiter Beach. Another hazardous weather-related injury was reported as the result of a lightning strike in Martin County.
May has been another active month for wildfires. As of the end of the month, there are 28 active wildfires over 100 acres in the state, mostly in the upper two-thirds of the peninsula. Burn bans are currently in effect in Baker, Brevard, Charlotte, Collier, Columbia, Duval, Desoto, Flagler, Glades, Hendry, Highlands, Hillsborough, Indian River, Lake, Lee, Manatee, Martin, Okeechobee, Orange, Osceola, Palm Beach, Pasco, Pinellas, Polk, Putnam, Sarasota, Seminole, St. Johns, St. Lucie, Sumter, and Volusia Counties.
Table 4: Breakdown of storm reports submitted in Florida during the month of May (Compiled from Southeast Regional Climate Center.)
Drought-Related Impacts.
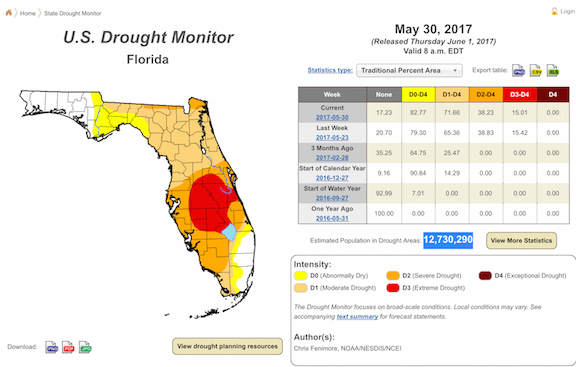
At the end of April, approximately 23.5% of the state, including most of the southern panhandle and the southeast portion of the peninsula was drought free. As for the remainder of the state, 19% was under abnormally dry conditions (D0), 24% under moderate drought (D1), and 33.5% under severe drought (D2). As the month progressed, drought conditions in most of the affected regions gradually intensified, and extreme drought (D3) conditions were noted in a gradually increasing section of central Florida. As of the latest U. S. Drought Monitor report, issued on May 30, extreme drought (D2) covers 15% of the state, severe drought – 23%, moderate drought – 33%, and 11% is experiencing abnormally dry (D0) conditions. Extreme drought is present in Brevard, Desoto, Glades, Hardee, Okeechobee, Orange, Osceola, Polk, and small parts of Charlotte, Hillsborough, Indian River, Lake, and Manatee Counties. In all, moderate, severe, or extreme drought conditions are currently affecting an estimated 2.7 million Florida residents. At the end of the month, Lake Okeechobee water levels were at 10.95 ft., which is significantly below average for this time of the year, and nearing the level at which water shortage management actions must be taken.
Agriculture-Related Impacts.
At the beginning of May, topsoil moisture levels ranged from very short (23%) to short (41%) or adequate (33%). These values fluctuated throughout the month, with a general tendency for drying out. By the end of the month, very short values accounted for 28% of soils, short – for 44% and adequate for 27%. Most of the citrus growing region has been under either severe or extreme drought, and citrus groves were irrigated daily to supply trees with necessary moisture. Ditches and canals were very dry throughout the region due to insufficient rainfall since the beginning of the year. Vegetable season has been winding down, and some crop fields were abandoned due to heavy insect pressure and disease. Pastures have continued to decline with rising temperatures and worsening drought conditions in many areas. Pastures that received rain have improved, but the overall pasture quality across the state has been fair to poor. In many areas supplemental cattle feeding with hay has been needed, and many farmers have been shipping in hay. Cattle have remained in mostly fair to good condition. Peanut and cotton planting has been progressing well with improving soil moisture conditions in northwest Florida.
Appendix 1: Additional May departures from normal data for Florida locations.

Appendix 2: Select daily maximum and minimum temperature records (° F) broken during May (compiled from NOAA, NWS). A value breaking or tying the record for the entire month of May is indicated by ** or *
Prepared by Lydia Stefanova, Daniel J. Brouillette, and David F. Zierden.
Florida Climate Center
The Florida State University
Tallahassee, FL
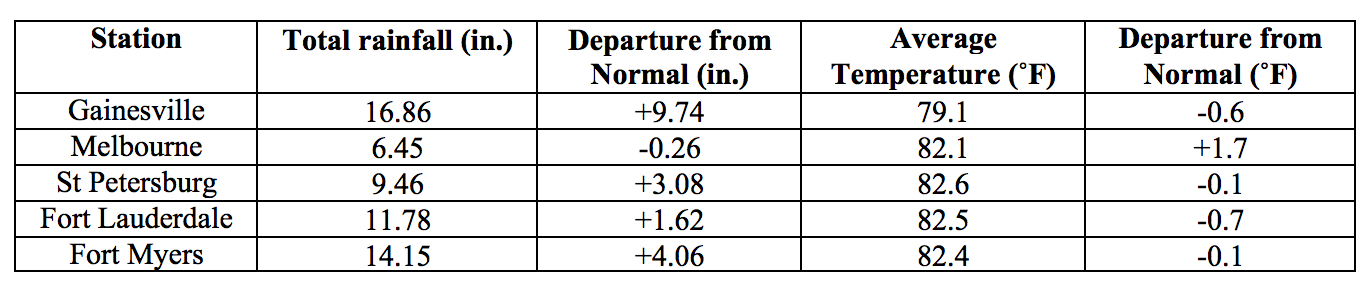
Average temperatures in June were mixed across the state. The departures from average temperatures in June 2017 were slightly below normal in the Panhandle and Central Florida to slightly above normal in South Florida, ranging from -1.7˚F in Orlando to +1.7˚F in Melbourne (Table 1 and Appendix 1). June 2017 was the 2nd warmest on record for Melbourne and 6th warmest on record for Miami. Several temperature records were tied or broken across the state (Appendix 2).
Table 1: June average temperatures and departures from normal (˚F) for selected cities.
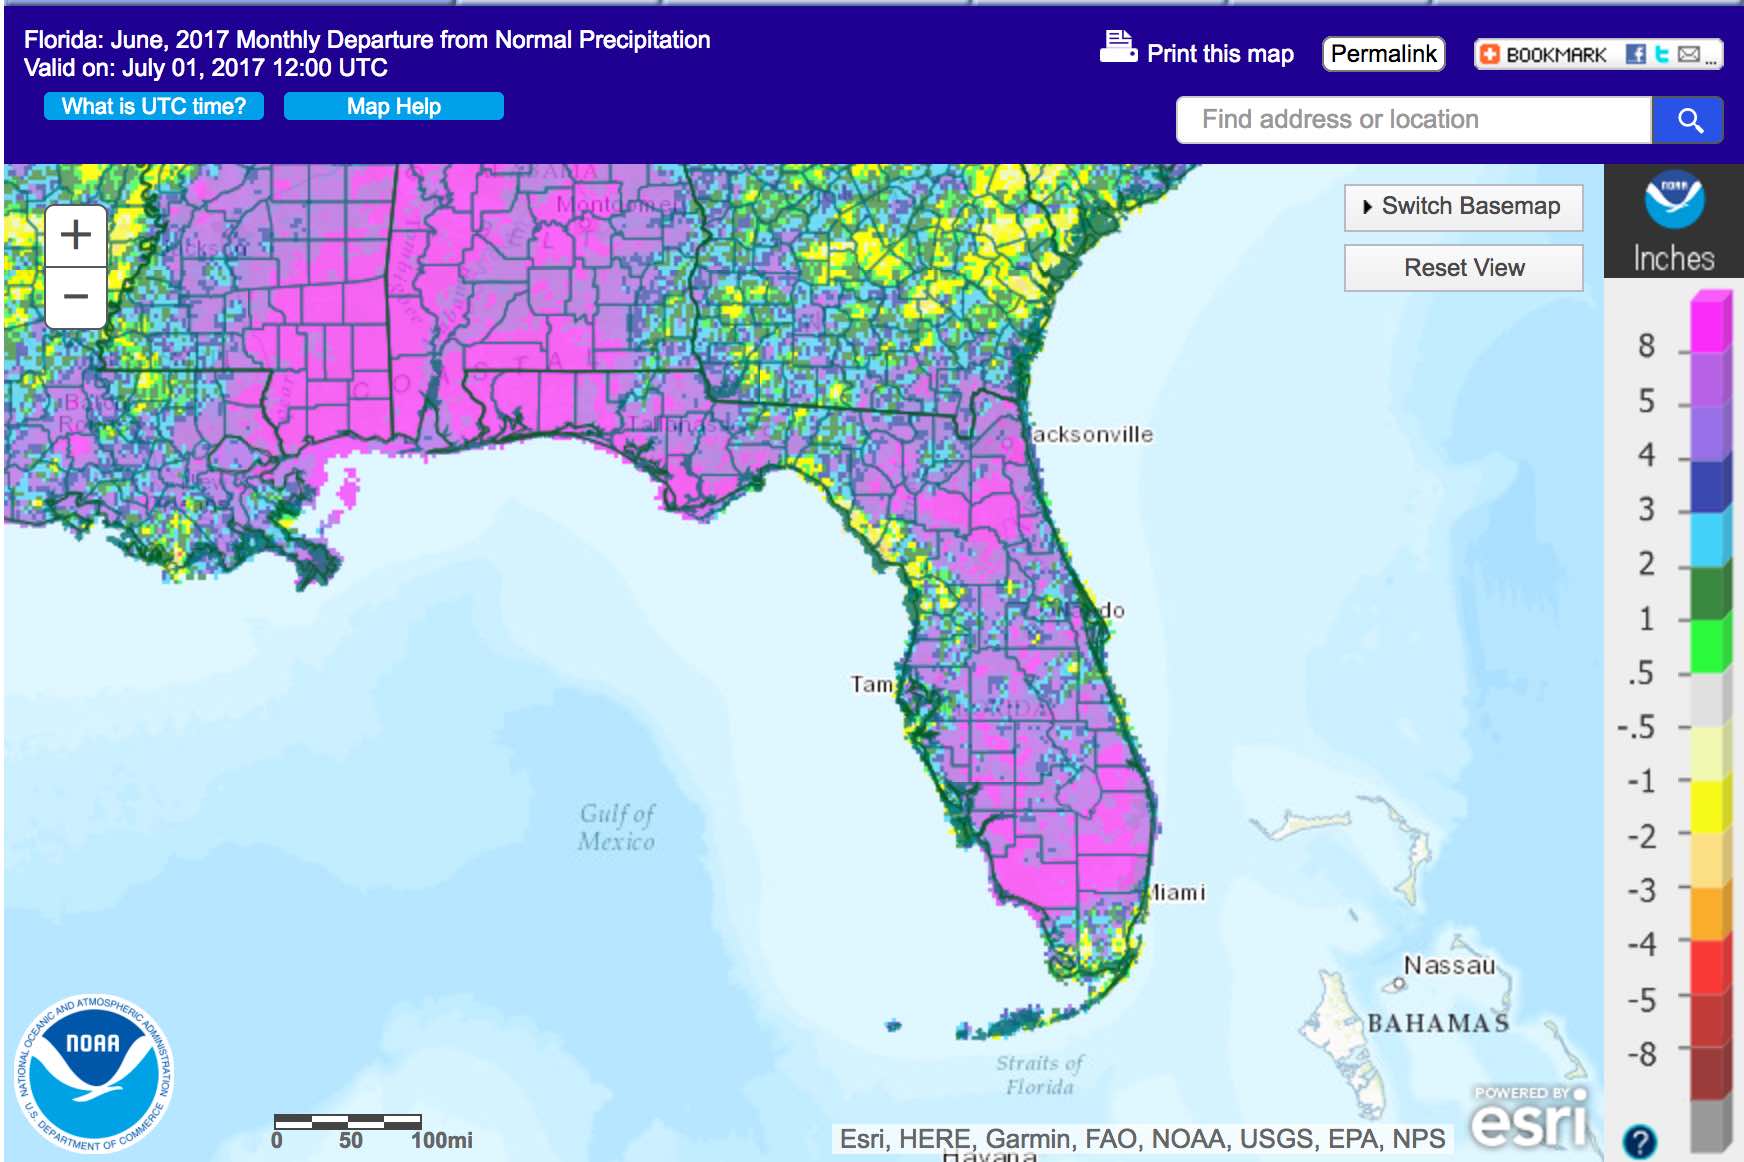
Rainfall totals in June were above normal for most of the state. Rainfall totals in June 2017 were above normal everywhere in the state with the exception of some isolated areas (Figure 1). Departures from normal roughly ranged from -2.14” in Orlando to +14.13” in Pensacola (Table 2 and Appendix 1), with a most areas receiving over one and a half times the normal precipitation for the month. June 2017 was the wettest on record for Gainesville, 2nd wettest on record for Pensacola, 8th for Tallahassee, and 10th for Jacksonville. A few 24-hour precipitation records broken for the month (Table 3).
Table 2: June precipitation totals and departures from normal (inches) for select cities.
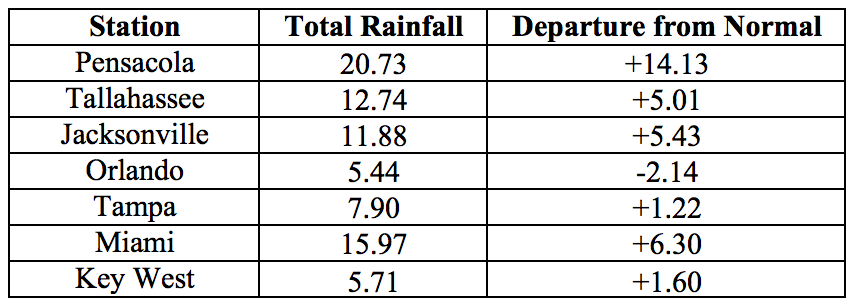
Table 3: Select daily rainfall records (inches) broken during June. (Compiled from NOAA, NWS).
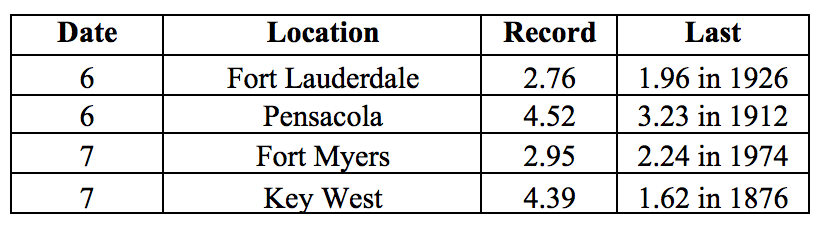
Figure 1: A graphical depiction of the monthly rainfall departure from normal (inches) for June is given in the figure below (courtesy of NOAA, NWS)
ENSO-Neutral Conditions are Present in the Pacific.
Based on current data and forecast models, the Climate Prediction Center (CPC) the ENSO alert system is currently set to “Not Active”. ENSO-neutral conditions are currently present, with sea surface temperatures (SST) near- to above-average across most of the Pacific Ocean. ENSO-neutral conditions are likely to persist through summer and fall seasons. The CPC seasonal outlook favors above-normal temperatures for Florida through September 2017.
Hazardous Weather Events in June.
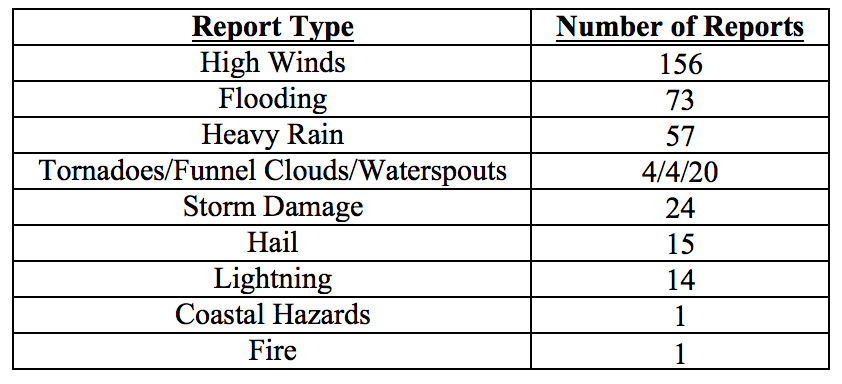
There were a total of 369 hazardous weather reports issued in Florida in June 2017, with nearly a third of all reports (114) coming in between the 6th and 7th of the month. Strong marine thunderstorm winds were recorded in that period along the Florida Keys and Miami area, and strong thunderstorm wind gusts up to 61 mph were reported in Brevard, Charlotte, Duval, Hillsborough, Lee, Martin, Palm Beach and Polk Counties. Very heavy rains were reported during that period in Collier (up to 10.27 inches in 12 hours and 13.18 inches in 24 hours) and Santa Rosa County (up to 10.26 inches in 24 hours). Parts of Broward, Collier, Flagler, Gilchrist, Leon, Monroe, and Santa Rosa Counties experienced flooding that required street and road closures.
The first day of June marked the start of Hurricane Season. The first tropical system of the year to impact Florida was Tropical Storm Cindy, which formed in the northwestern Caribbean Sea on the 19th and made landfall in southwestern Louisianna on the 22nd. Significant rainfall associated with Cindy was seen across most of the Panhandle and northern counties, with smaller amounts in Central and southern counties. Heavy rains and flooding were reported in Bay, Escambia, Santa Rosa, Walton and Washington Counties.
As the weather is settling into summer regime, daily sea breeze thunderstorms are becoming a frequent source of heavy rain, strong winds, and lightning. Several lightning-caused house fires were reported in Santa Rosa County on the 15th of the month and Duval County on the 15th and 26th. A lightning strike on the 26th started a wild fire in Brevard County that burned some 800 acres in the St. Johns River Water Management District. At least four people were injured by lightning strikes during June, with one fatality in Broward County on the 17th. Other hazardous weather related incidents for the month included three injuries and one fatality resulting from rip currents on the 25th in Palm Beach Shores.
Waterspouts are also becoming more frequent with the summer weather, especially along the Florida Keys and near Miami. A total of 20 sightings were documented during the month, and some of these reports included more than one spout. There were four tornadoes reported for June: a weak EF-0 in Broward County on the 5th, a weak EF-1 in St. Johns County on the 6th, a strong EF-0 in Franklin County on the 20th, and a probable tornado detected based on tree and powerline damage in Okaloosa County on the 21st. Funnel clouds were observed on the 13th in Clay County, the 14th in Duval, the 28th near Flagler Beach, and on the 30th in Hendry County.
Table 4: Breakdown of storm reports submitted in Florida during the month of June (Compiled from Southeast Regional Climate Center.)
Drought-Related Impacts.
At the end of May, only the northwest and southeast portions of the state were drought free, accounting for approximately 17% of the state’s area. Extreme drought affected 15% of the state (particularly Central Florida), severe drought – 23%, and moderate drought – 33%. The remainder of the state was experiencing abnormally dry conditions. Abundant and widespread rain eliminated the extreme drought conditions by the first week of the month. In the following weeks, as rains persisted, drought conditions were continuously improving. As of the latest U. S. Drought Monitor report, issued on June 27, the entire state is drought-free for the first time since approximately a year ago. As of June 20th the temporary county-level burn bans have been lifted from all but Charlotte County. Water levels in Lake Okeechobee are currently at 12.37 ft., which is still below average for this time of the year but a significant improvement from the beginning of the month.
Agriculture-Related Impacts.
At the beginning of May, topsoil moisture levels ranged from very short (23%) to short (41%) or adequate (33%). These values fluctuated throughout the month, with a general tendency for drying out. By the end of the month, very short values accounted for 28% of soils, short – for 44% and adequate for 27%. Most of the citrus growing region has been under either severe or extreme drought, and citrus groves were irrigated daily to supply trees with necessary moisture. Ditches and canals were very dry throughout the region due to insufficient rainfall since the beginning of the year. Vegetable season has been winding down, and some crop fields were abandoned due to heavy insect pressure and disease. Pastures have continued to decline with rising temperatures and worsening drought conditions in many areas. Pastures that received rain have improved, but the overall pasture quality across the state has been fair to poor. In many areas supplemental cattle feeding with hay has been needed, and many farmers have been shipping in hay. Cattle have remained in mostly fair to good condition. Peanut and cotton planting has been progressing well with improving soil moisture conditions in northwest Florida.
Appendix 1: Additional June departures from normal data for Florida locations.
Appendix 2: Select daily maximum and minimum temperature records (° F) broken during June (compiled from NOAA, NWS).
Building A, Suite 292
Tallahassee, FL 32306-2741
Phone: (850) 644-3417 | (850) 644-0719
climate@coaps.fsu.edu