


The Florida Climate Center serves as the primary resource for climate data, information, and services in the state of Florida.

The Florida Climate Center achieves its mission by providing climate monitoring, research, and expertise to be applied by the people, institutions, and businesses of Florida and the surrounding region.
We provide direct service by fulfilling requests for climate and weather data and information in a variety of formats.
We perform research that advances the understanding of the climate variability and changes of Florida and the surrounding region.
We provide outreach in presentations and at events aimed at a variety of groups, interests, and ages.
Prepared by Lydia Stefanova, Daniel J. Brouillette, and David F. Zierden.
Florida Climate Center
The Florida State University
Tallahassee, FL

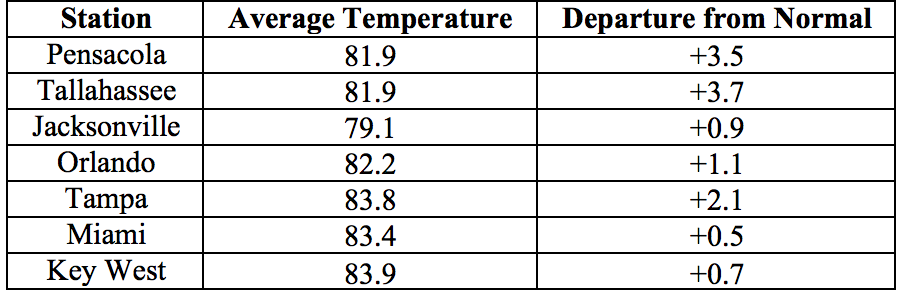
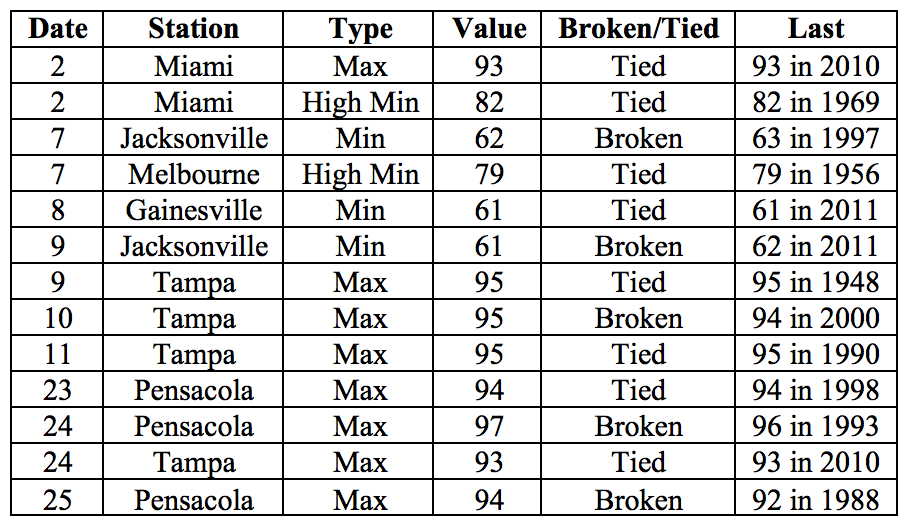
Average temperatures for September in Florida were above normal. TThe average temperatures in September 2016 were above normal across the state with few isolated exceptions. Average temperatures departure from normal ranged from -0.2˚F in Fort Lauderdale to +3.7˚F in Tallahassee (Table 1 and Appendix 1). September 2016 was the warmest on record in Tampa, 2nd warmest in Tallahassee and West Palm Beach, 6th warmest in Pensacola, 10th warmest in Miami. Multiple maximum and minimum temperature records were tied or broken across the state in September (Appendix 2).
Table 1: September average temperatures and departures from normal (˚F) for selected cities.
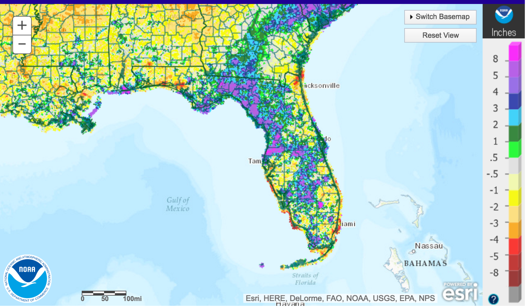
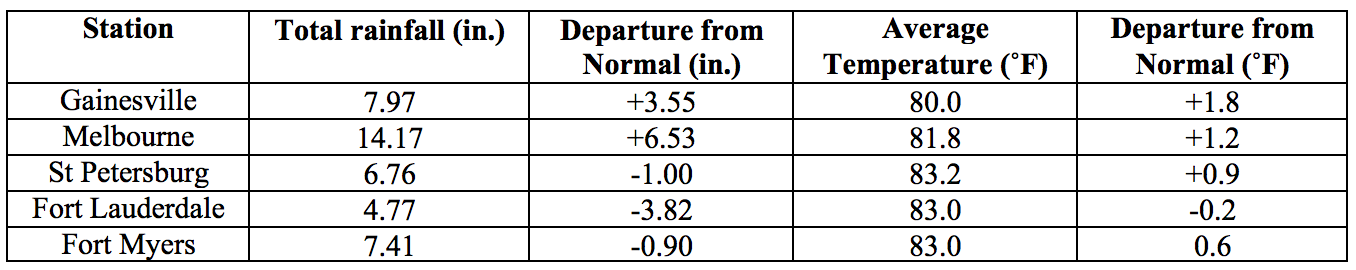
Rainfall totals in September were varied across the state. Rainfall totals were above normal for portions of the state affected by TS/Hurricane Hermine in the first two days of the month, and below normal for most of the remaining area. Two-day storm totals in excess of 9’’ were measured by several gauges in Pinellas County. Major reporting stations registered departures from normal ranging from -3.83” (Jacksonville) to +6.53” (Melbourne) (Table 2 and Appendix 1), although localized parts of the state saw rainfall totals that were as much as 5” below normal to over 8” above normal (Figure 1). At major reporting stations, there were a few number of 24-hour precipitation records broken for the month (Table 3).
Table 2: September precipitation totals and departures from normal (inches) for select cities.
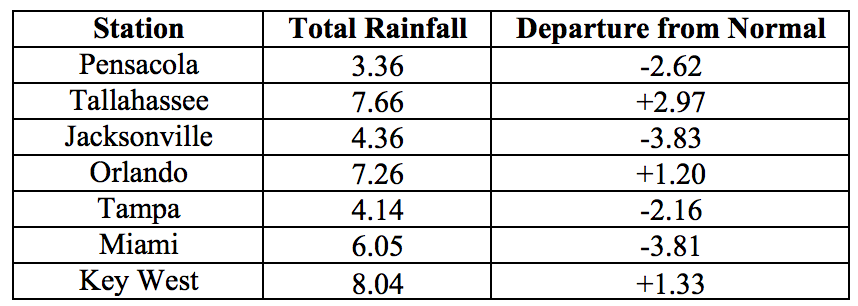
Table 3: Select daily rainfall records (inches) broken during September (compiled from NOAA, NWS).
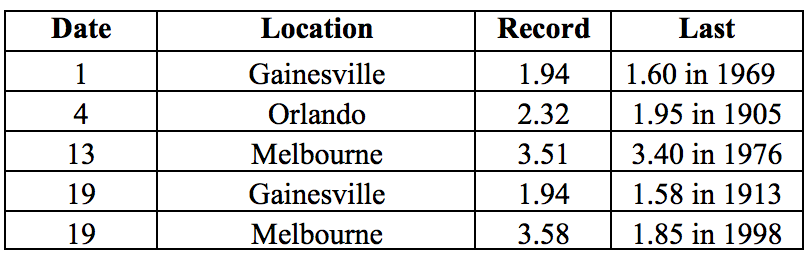
Figure 1: A graphical depiction of the monthly rainfall departure from normal (inches) for September is given in the figure below (courtesy of NOAA, NWS).
ENSO-Neutral Conditions are Present in the Pacific.
The ENSO alert status is currently set to Not Active. Sea surface temperatures in the east-central and equatorial Pacific are near or below average. NOAA CPC estimates that continuing ENSO-neutral conditions are slightly favored (55-60% chance) for the fall and winter of 2016-17.
Hazardous Weather Events in September.
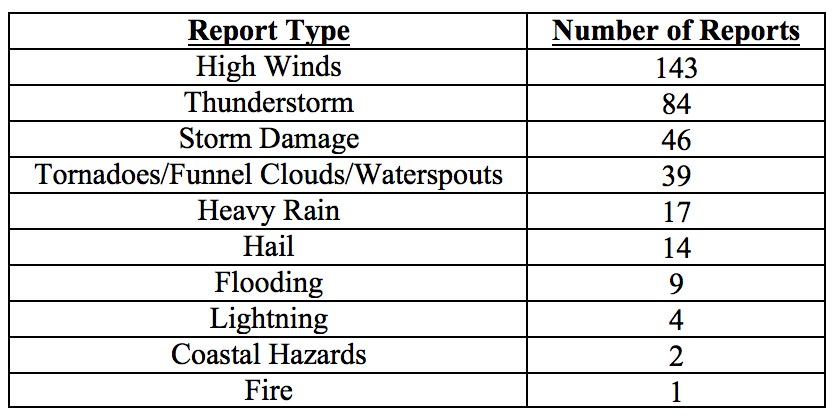
There were 359 reports of hazardous weather events logged in Florida in September by the Southeast Regional Climate Center (http://sercc.com/lsr; see Table 4 for a breakdown by event type). Nearly half of these came from just two days, September 1-2, during the approach and passage of Hurricane Hermine. Hurricane Hermine made landfall around 1:30 AM EDT on 2 September 2016, near Saint Marks, Wakulla County, in the Big Bend region. Its greatest impact away from the coast was damaging wind gusts. Winds were strong near, and especially off, the western coast from the Tampa Bay region northward through the Nature Coast and the north-central part of the peninsula and into the Big Bend region. Damage from these wind gusts, though seen in much of the Big Bend, was most evident in Tallahassee, the largest population center affected by Hermine at its peak strength. Numerous downed trees caused several injuries and damage to several houses and numerous power lines. The resulting power outages left over 300, 000 customers without power for several days. Rainfall from Hermine was particularly heavy in coastal areas of the Tampa Bay region, where minor to moderate flash flooding was reported. Three brief tornadoes were reported in rural Taylor County on the 1st without significant associated damage. A weak tornado on the same day briefly touched down in Orange County causing some damage to homes and structures. Initial estimates indicate that insured losses in Florida from Hermine were on the order of $80 million.
Table 4: Breakdown of storm reports submitted in Florida during the month of September (Compiled from Southeast Regional Climate Center.)
Agriculture Related Impacts.
Prior to the beginning of September, topsoil moisture levels were mainly (62%) adequate, with some (20%) surplus and some (16%) short values present. Following the passage of Hermine, soil moisture levels shifted to mostly adequate (60%) and (30%) surplus. By the end of the month 70% of topsoils were reported at adequate levels, and 18% with surplus, and 12% short. Land preparation and planting has been underway for fall vegetables. Some of the early vegetable plantings have suffered from disease issues because of overly wet soil conditions in Charlotte, Collier, Glades, and Hendry Counties. Cattle and pasture conditions are mostly good, and pasture conditions are seasonally declining across the state. Peanut harvesting has begun in Lafayette, Dixie, and Escambia counties, although wet fields caused some crop damage and harvest delays and increased disease pressure in Dixie and Levy Counties. Some damage from wind and excess moisture following the hurricane has been reported in cotton and sorghum fields in Jefferson County and hay fields in Pasco County. Sugarcane is reported to be in good condition, although some growers in Collier, Glades and Hendry counties had to run pumps to remove excess water from the fields. Most of the citrus growing region, with the exception of portions of Orange, Seminole, Brevard and Volusia has been drought free for most of the month. Some groves required irrigation several times per week to maintain necessary soil moistures. Harvest has begun for small amounts of citrus varieties and is expected to continue as fruits continue to ripen.
Drought Related Impacts.
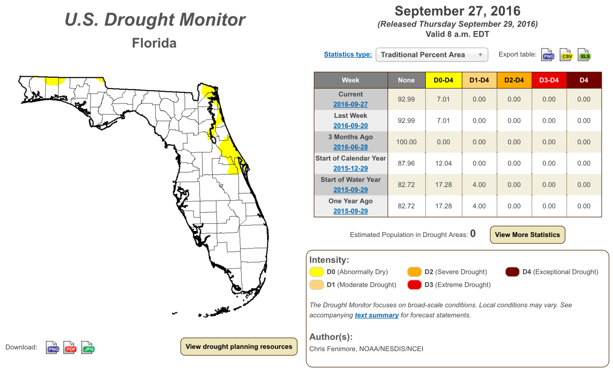
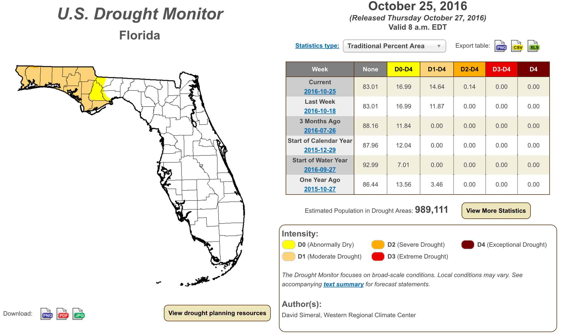
According to the US Drought Monitor, at the end of August 86% of the state was drought-free, with the remaining 14% (including Nassau, Duval, Clay, Saint Johns, Putnam, Flagler, Volusia, Brevard, and portions of Madison, Lake, Seminole, Orange, Osceola, Indian River and Okeechobee Counties) experiencing abnormally dry (D0) conditions. In the first week of September, rains from Hermine ameliorated some of the D0 conditions, leaving only 6% of the state (portions of Nassau, Duval, Saint Johns, Putnam, Seminole, Orange and Brevard Counties, as well as most of Volusia County) in D0. In the week that followed, some additional D0 conditions developed in the northern portion of Okaloosa and Walton Counties, and in the northeast of Jackson County. This pattern persisted until the last week of the month. As of the latest US Drought Monitor report (September 27th), 93% of the state was drought free, and 7% - abnormally dry. As of October 1, the water level in Lake Okeechobee was at 15.77’, which is 0.86’ higher than average for this time of the year.
Appendix 1: Additional September departures from normal data for Florida locations.
Appendix 2: Select daily maximum and minimum temperature records (° F) broken during September (compiled from NOAA, NWS).
Prepared by Lydia Stefanova, Daniel J. Brouillette, and David F. Zierden.
Florida Climate Center
The Florida State University
Tallahassee, FL
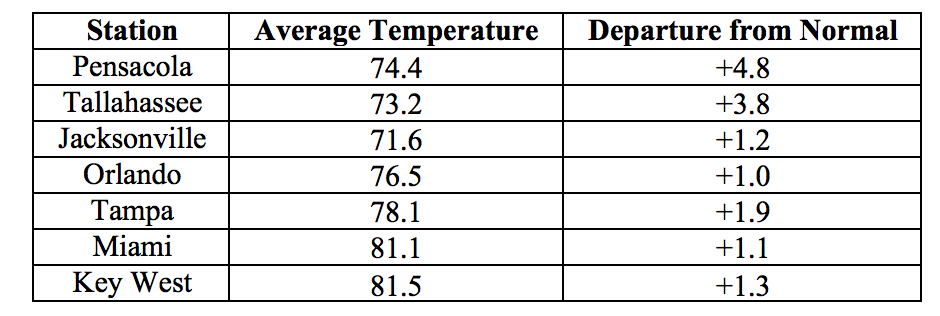
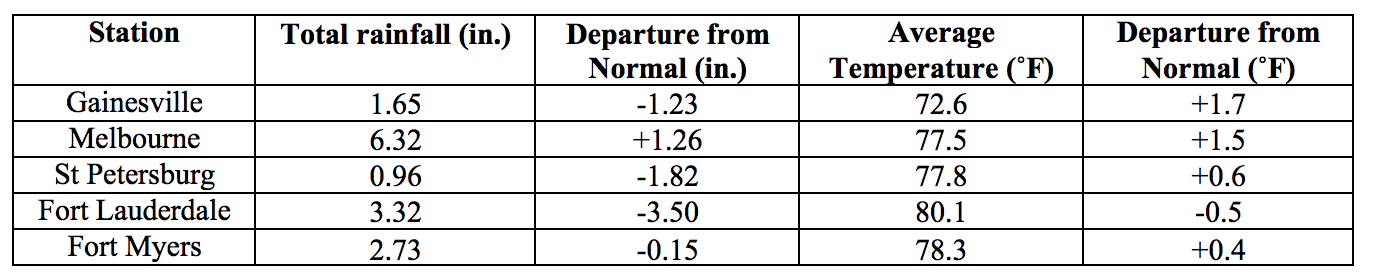
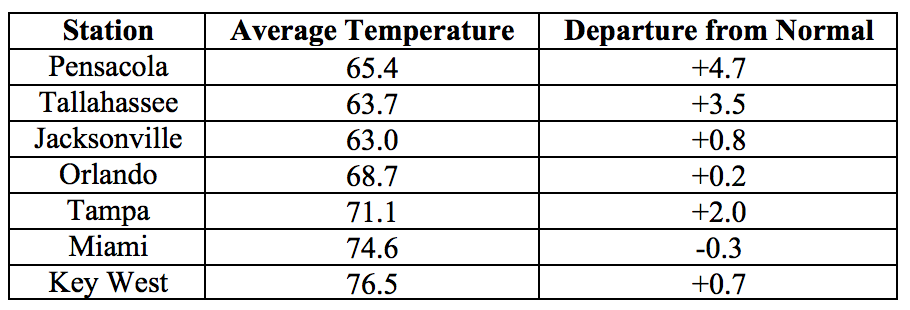
Average temperatures were above normal across most of the state in October. The departures from average temperatures in October 2016 were mostly above normal across the state, ranging from -0.5˚F in Fort Lauderdale to +4.8˚F in Pensacola (Table 1 and Appendix 1). October 2016 was the 5th warmest on record for Miami, 6th for Pensacola, 8th for Tampa, and 9th for Tallahassee. Multiple maximum and minimum temperature records were tied or broken across the state in October (Appendix 2).
Table 1: October average temperatures and departures from normal (˚F) for selected cities.
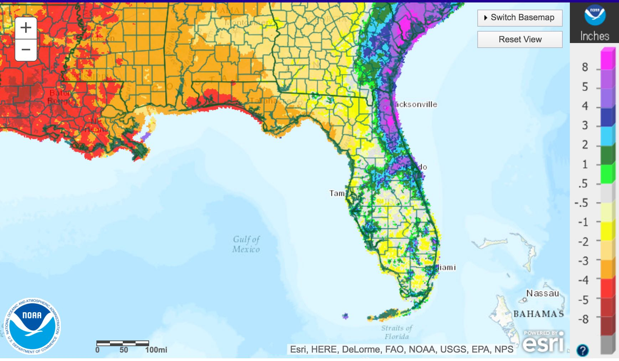
Rainfall totals in October were varied across the state. Most of the Panhandle had much below normal rainfall, while parts of the Peninsula that were affected, particularly along the northeastern coast, had much above normal rainfall (Figure 1). Major reporting stations registered departures from normal ranging from -5.24” in Pensacola to +5.58” in Jacksonville (Table 2 and Appendix 1), although localized parts of the state saw rainfall totals that were over 8” above normal (Figure 1). October 2016 was the 4th driest October on record for Pensacola and the wettest on record for St Augustine. There were a small number of 24-hour precipitation records broken for the month (Table 3).
Table 2: October precipitation totals and departures from normal (inches) for select cities.
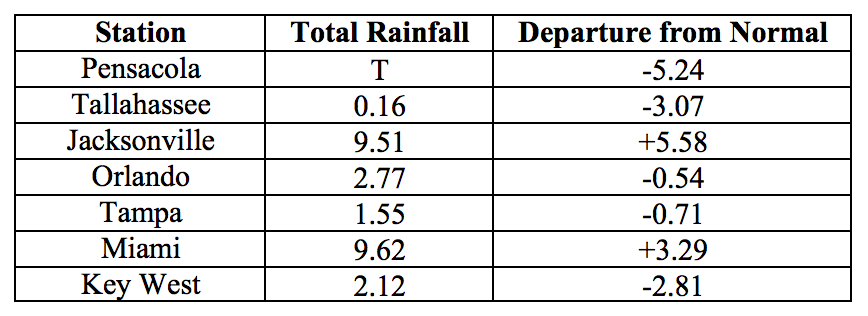
Table 3: Select daily rainfall records (inches) broken during October (compiled from NOAA, NWS).

Figure 1: A graphical depiction of the monthly rainfall departure from normal (inches) for October is given in the figure below (courtesy of NOAA, NWS).
ENSO Alert System Status Set to La Niña Watch.
Based on current data and forecast models, the Climate Prediction Center (CPC) has set the ENSO Alert System at a La Niña watch. ENSO-neutral conditions are currently present, and equatorial sea surface temperatures are below normal across the central and east-central Pacific Ocean. There is an approximately 70% chance that La Niña conditions will continue develop in fall 2016 and are slightly favored to persist into the winter of 2016-2017. CPC predictions favor above normal temperatures and below normal precipitation across the state for November 2016 through January 2017.
Hazardous Weather Events in October.
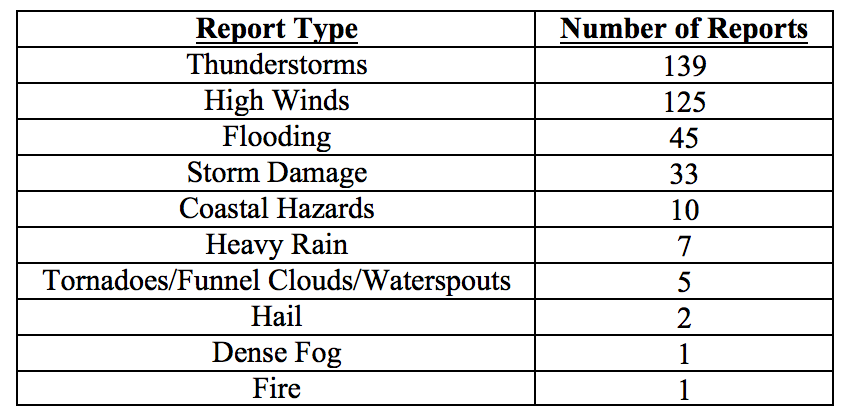
There were a total of 368 severe weather reports made in Florida during October 2016 (see Table 4 for a breakdown by type). Over two-thirds of these reports resulted from the impact of Hurricane Matthew. Hurricane Matthew skirted the Atlantic Coast of Florida between October 6th and 7th as a category 3 storm. It did not quite make landfall, but its eyewall came very close to the coastline (within 10 miles at its closest). Anticipating a more direct hit from the storm, emergency-management officials had collectively called for the largest evacuation in Florida history. Nonetheless, even though Matthew did not make as direct a hit on the state as anticipated, nine Floridians perished as a direct result of the storm, and early estimates put damages in the hundreds of millions of dollars in Florida alone. Despite never making a landfall on the state, Hurricane Matthew had a considerable impact on Florida’s eastern coast, with historically high and damaging storm surge, tropical-storm- to hurricane-force winds, and heavy rains. Matthew produced some very high storm surges, exceeding 5’, in Nassau, Flagler, Duval, and St. Johns Counties. The storm surge flooded near-coastal roadways and structures, especially in the communities of Flagler Beach, Jacksonville Beach, Palm Coast, St. Augustine, and St. Augustine Beach. The surge, along with high waves, severely eroded beaches and dunes and, in some cases, compromised structures and roadways. Hurricane-force wind gusts were registered along and near the Space Coast, and tropical-storm-force sustained winds and gusts were registered at stations throughout the eastern half of the peninsula from near Miami northward. These strong winds caused structural damage that ranged from sporadic and minor in near-coastal southeastern Florida (e.g., a few trees and branches blown down, awnings ripped off buildings) to widespread and more substantial along the Space and First Coasts (e.g., many trees and branches down, building roofs de-shingled, many power lines and poles blown down). At the peak of the storm on the 7th, 1.1 million electric customers had lost electric power statewide. In the city of Jacksonville, widespread power failure caused many sewage lift stations maintained by the Jacksonville Electric Authority (JEA) to be non-operational, leaving the operational ones with an increased demand, which was only increased by run-off from heavy rainfall from the storm. As a result, the JEA was forced to dump 7.4 million gallons of raw sewage into the St. Johns River. Rainfall totals due to Matthew were moderate to high in proximity to the coast from parts of the Treasure Coast northward. The greatest totals were in portions of Duval, St. Johns, Volusia, Putnam, and Flagler Counties. Inland flooding of creeks and low-lying, poorly drained land and roadways was reported in Volusia, northern Brevard, Flagler, St. Johns, Putnam, and Duval Counties. Aside from Matthew’s impacts, mid-month, coastal areas of South Florida, particularly in Miami, Miami Beach, and Fort Lauderdale, experienced flooding from seasonally high astronomical tides (“king tides”). Similar king tides and likely flooding are expected mid-month in November as well. Other reported coastal hazards during October included rip tides off the coast of Palm Beach County on the 16th, leading to one fatality, and off of Jacksonville Beach on the 18th requiring rescue of several swimmers.
Table 4: Breakdown of storm reports submitted in Florida during the month of October (Compiled from Southeast Regional Climate Center.)
Agriculture Related Impacts.
At the beginning of October, topsoil moisture levels were at mainly (67%) adequate, though some (18%) surplus and some (13%) short values were reported across the state. By the end of the month, topsoil moisture levels were still mainly (59%) adequate, but some (20%) short and (13%) very short values were reported. Peanut harvesting was completed at 58% by the first week of October, and at 94% by the end of the month. Peanut harvesting continues in Lafayette, Okaloosa, Walton and Washington Counties, and is hampered by very dry soils in Jackson County. Cotton harvest continues in Lafayette, Okaloosa, Walton, and Washington Counties. Haying was active in Columbia, Dixie, Jackson, Flagler, Okaloosa, Okeechobee, Orange, Pasco, and Volusia Counties, with some setbacks in Pasco County because of the hurricane, and some reported hay loses from flooding in Flagler and Putnam Counties. Pasture quality is seasonally declining across the state but both pasture and cattle conditions are mostly good. In the aftermath of hurricane Matthew, farmers in Putnam and St. Johns Counties reported substantial losses to their crops, averaging 30% to 60%, and a few farmers reported total losses. Recently planted crops of Asian vegetables and snap beans were especially damaged, with losses due to that damage estimated by the University of Florida Agricultural Extension at $1.6 million. Crops of cabbage, cauliflower, broccoli, winter squash, mustard greens, sweet corn, and sweet potatoes were also affected. Farmers blamed flooding and soggy soils from excessive rainfall due to both the hurricane and a stalled surface front just before the time of the hurricane. The citrus growing region had average- to above-average temperatures for the season, with little rainfall aside from that brought on by hurricane Matthew. Towards the end of the month, most groves were being irrigated to offset the lack of rain in the later weeks. Harvesting of all citrus varieties is lagging behind last year’s schedule.
Drought Related Impacts.
At the beginning of October, the most (93%) of the state was drought free, and 7% of the of the state (including portions of Nassau, Duval, St Johns, Putnam, Volusia, Seminole, Orange and Brevard Counties on the east coast, as well as northern Okaloosa and small portions of northern Santa Rosa, Walton and Jackson Counties in the panhandle) were experiencing abnormally dry (D0) conditions. Rains from the passage of hurricane Matthew removed the abnormally dry conditions from the entire east coast of the state by the 8th. At the same time, lack of rain and relatively high temperatures lead to D0 conditions setting in the western Panhandle. As the month progressed, these dry conditions intensified. As of the last US Drought Monitor report (released on Oct 27th), moderate drought (D1) conditions are extending over most of the western Panhandle, from Escambia County at the west to Jackson, Calhoun, Gulf and Franklin Counties at the east. Severe drought (D2) has set in the extreme northern portion of Santa Rosa County. D0 conditions are present in Liberty and Gadsden Counties, and in western Wakulla County. In all, 83% of the state was classified as drought-free, approximately 2% as D0, and approximately15% as D1. D2 conditions are affecting less than 0.2% of the state’s area. In all, drought conditions are currently affecting close to one million Florida citizens. The water level in Lake Okeechobee at the end of the month was at about 15.4 ft., down from the beginning of the month but still slightly higher than the average level for this time of the year.
.
Appendix 1: Additional October departures from normal data for Florida locations.
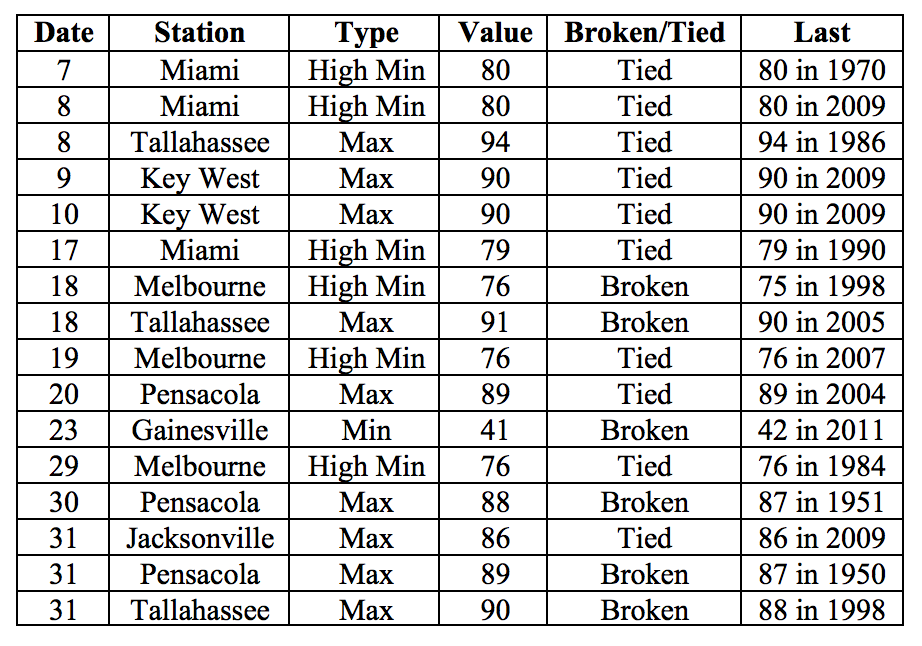
Appendix 2: Select daily maximum and minimum temperature records (° F) broken during October (compiled from NOAA, NWS).
Prepared by Lydia Stefanova, Daniel J. Brouillette, and David F. Zierden.
Florida Climate Center
The Florida State University
Tallahassee, FL
Average temperatures were generally above normal for most of the state in November. The departures from average temperatures in November 2016 were above normal for most of the state, with some exceptions in Peninsular Florida, ranging from -0.7˚F in Fort Lauderdale to 4.7˚F in Pensacola (Table 1 and Appendix 1). November 2016 was the 9th warmest on record in Pensacola. Despite the relatively warm average temperatures, particularly in northern portion of the state, there were a handful of nights with temperatures at or below freezing - once in Tallahassee and Jacksonville, and three times in Gainesville. A small number of daily maximum and minimum temperature records were tied or broken across the state in November (Appendix 2).
Table 1: November average temperatures and departures from normal (˚F) for selected cities.
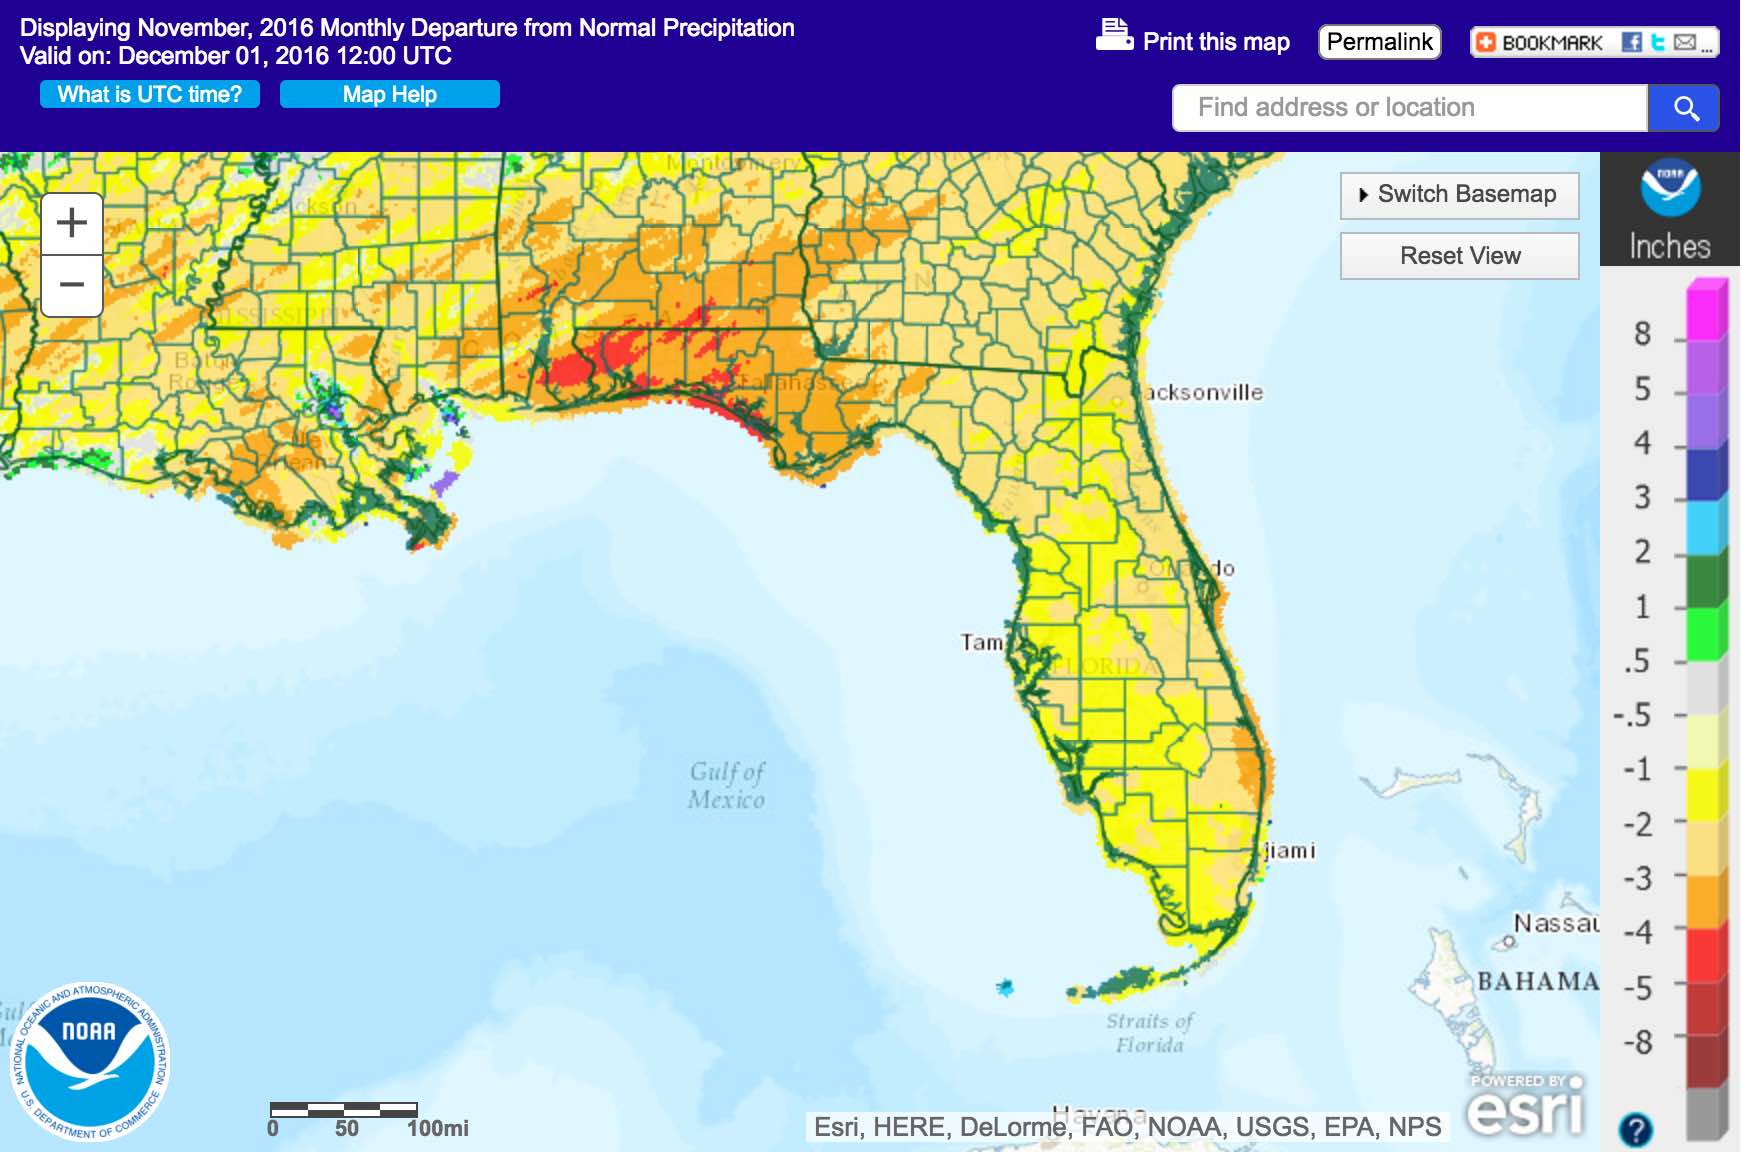
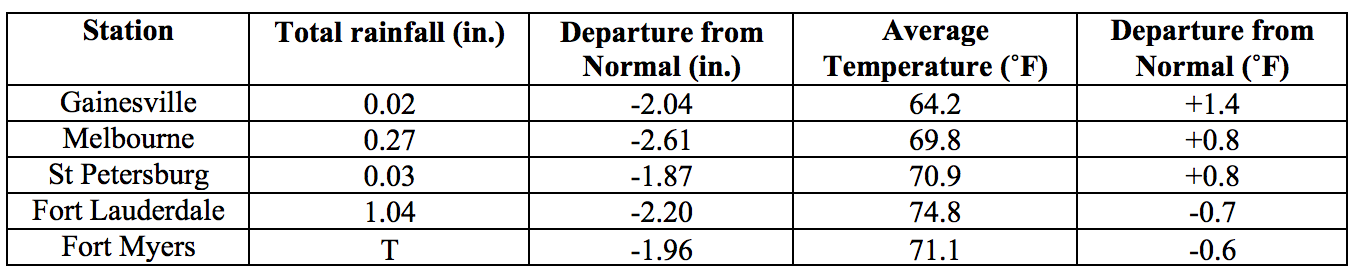
Rainfall totals in November were well below normal across the state. Rainfall across the state was well below normal (Figure 1). Most parts of the state received less than a quarter of the normal, and large portions received less than one tenth of the normal amount of precipitation for November. Major reporting stations registered departures from normal ranging from -3.87” in Pensacola to -1.54” in Tampa (Table 2 and Appendix 1). No major reporting station registered more than 1” of rain for the month, and the majority reported well under 0.5”. November 2016 was the driest on record in Fort Myers, the 2nd driest on record in Gainesville, Melbourne, Orlando, Tampa, the 3rd driest on record in Jacksonville, and the 4th driest on record for Key West and Daytona Beach. No 24-hour precipitation records were broken for during the month.
Table 2: November precipitation totals and departures from normal (inches) for select cities.
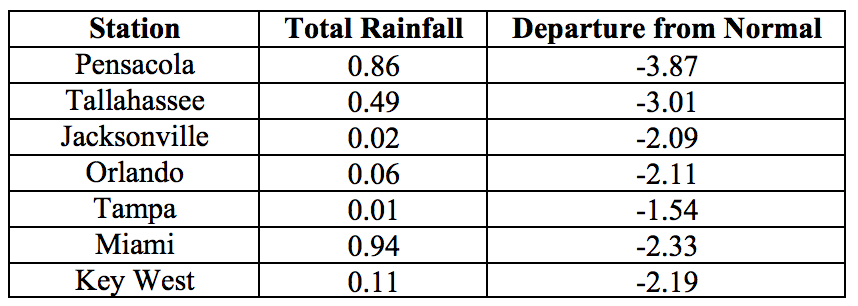
Figure 1: A graphical depiction of the monthly rainfall departure from normal (inches) for November is given in the figure below (courtesy of NOAA, NWS).
La Niña Conditions are Present in the Pacific.
Based on current data and forecast models, the Climate Prediction Center (CPC) the ENSO Alert System is set at a La Niña Advisory. La Niña conditions are present, with below-average sea surface temperatures in the central and east-central Pacific Ocean. There is approximately a 55% chance that La Niña conditions will continue through the Northern Hemisphere winter 2016-2017, gradually weakening through spring 2017. The CPC seasonal forecast favors above normal temperatures and below normal precipitation across Florida for the winter of 2016-2017.
Hazardous Weather Events in November.
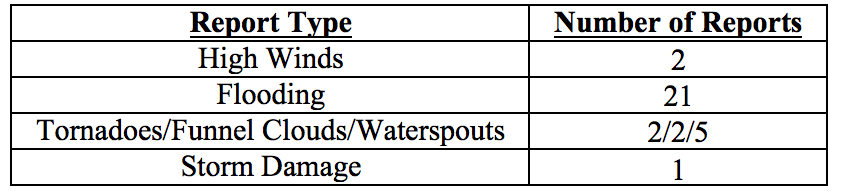
TThere were a total of 33 severe weather reports made in Florida during November, making for a relatively quiet month (see Table 4, from data collected by the Southeast Regional Climate Center, http://sercc.com/lsr for breakdown by event type). Most of these reports were of coastal flooding which was the result of seasonal king tides being additionally boosted by the stronger gravitational pull caused by the unusual closeness of the full moon between November 12th and 14th. Coastal flooding from these high tides was reported along the Atlantic coast, in Jacksonville and from Miami to West Palm Beach, with up to 6 inches of water along some streets. A few waterspouts were spotted in South Florida and along the Florida Keys throughout the month with no associated damage reported. A cold front on the 30th brought some localized severe weather to portions of northwest Florida, where reports included a waterspout coming onshore near Destin and suspected tornado near Fort Walton, causing minor damage to structures.
Table 4: Breakdown of storm reports submitted in Florida during the month of November (Compiled from Southeast Regional Climate Center.)
Drought Related Impacts.
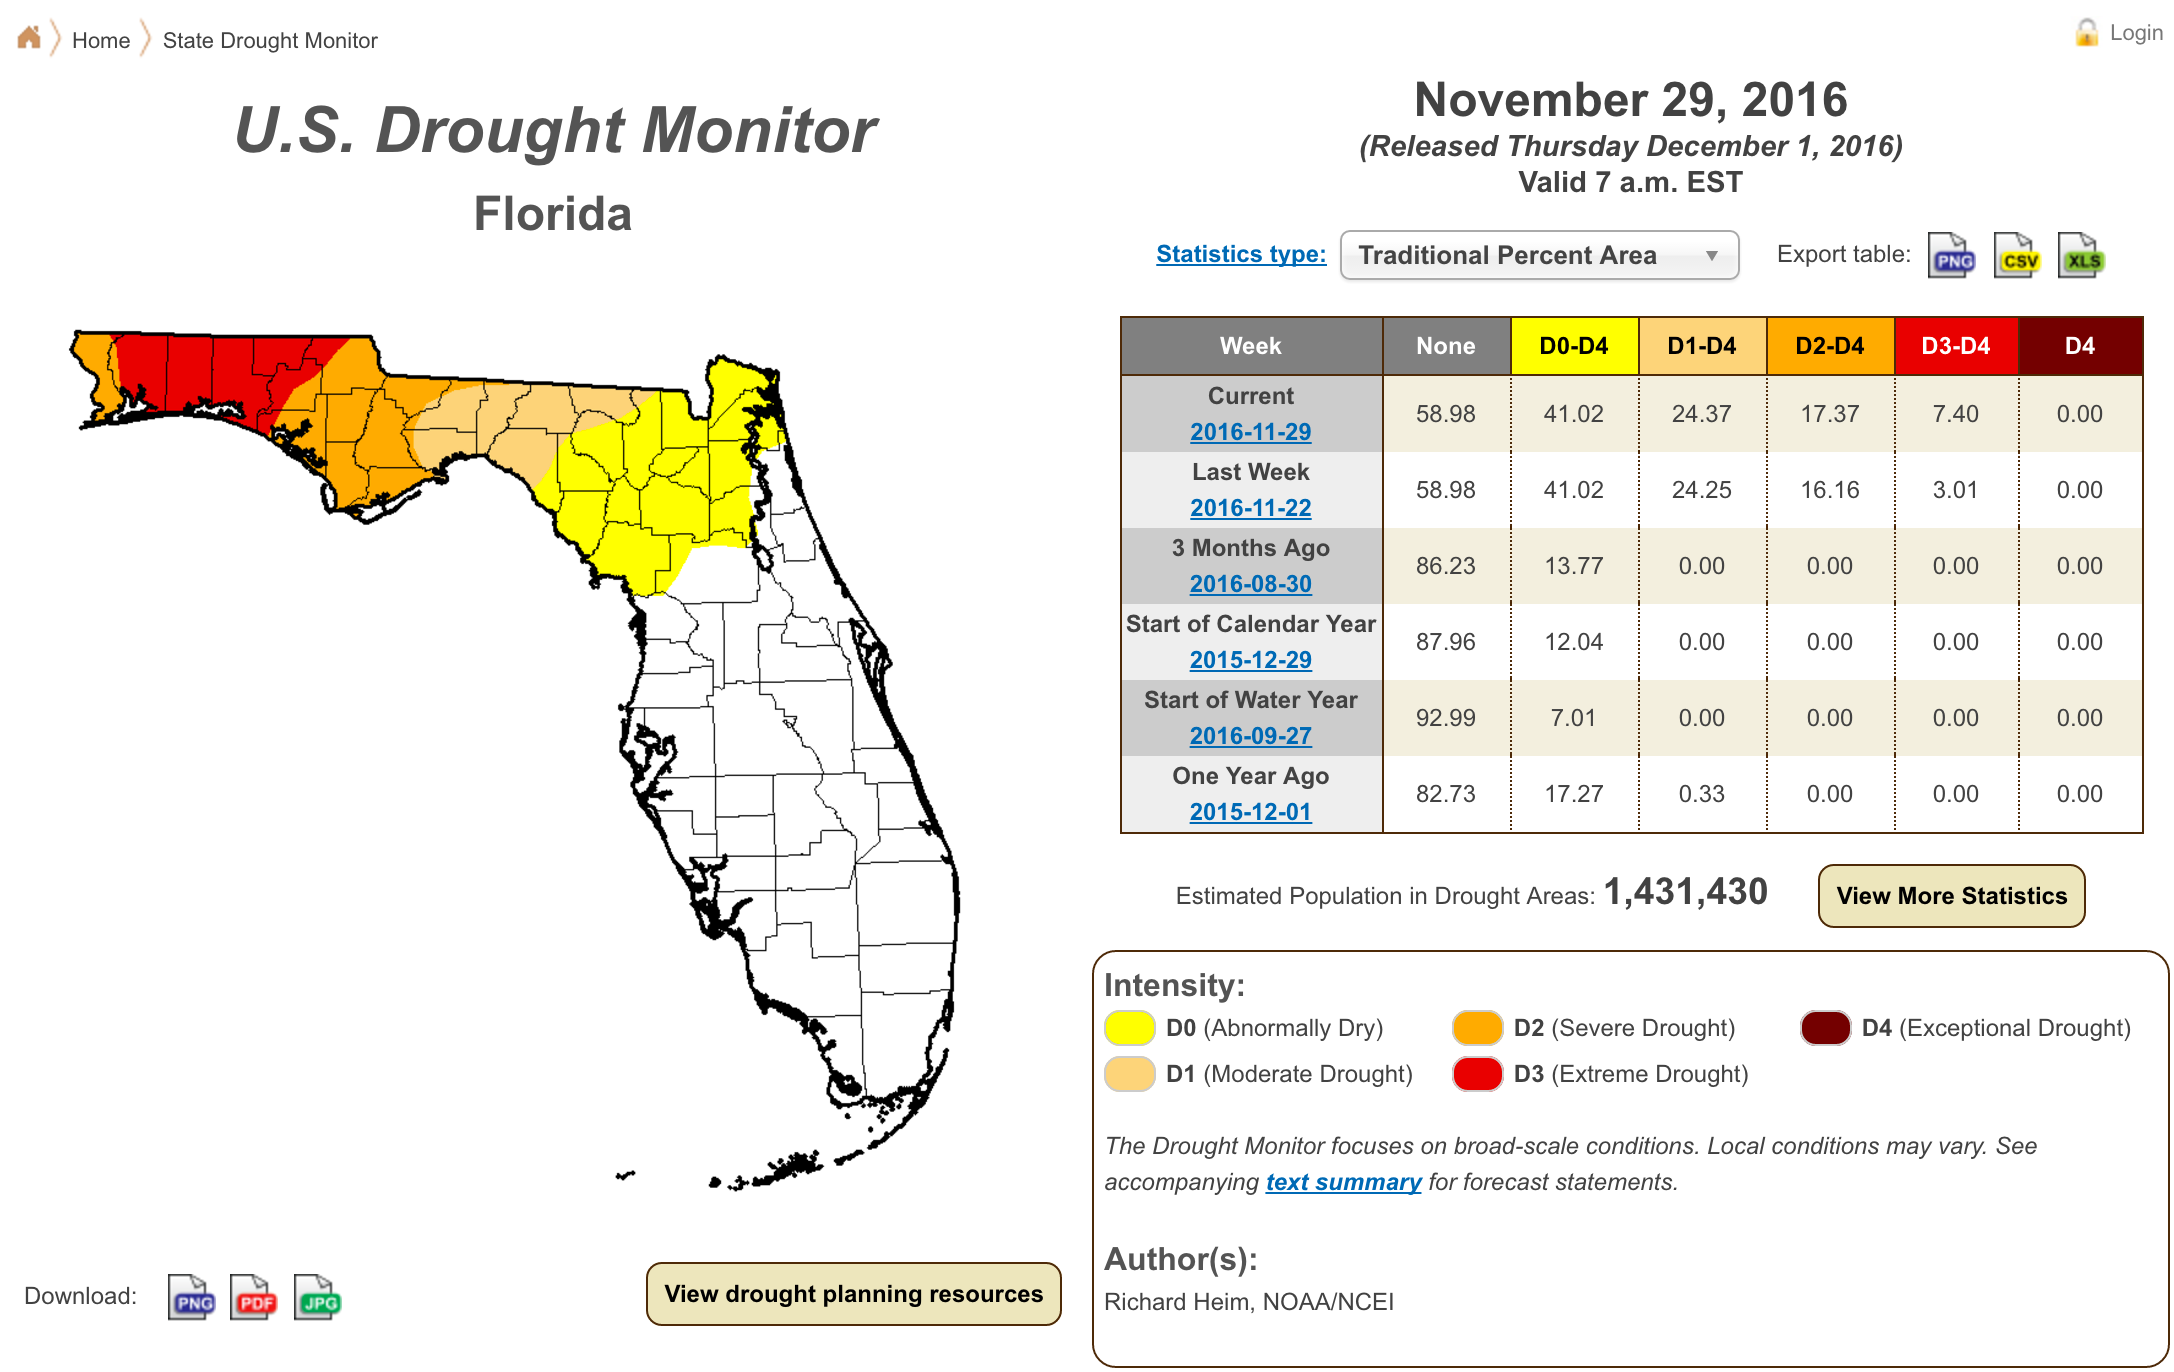
At the end of October, abnormally dry (D0) conditions were present in Liberty and Gadsden Counties, and in western Wakulla County; moderate drought (D1) conditions were extending over most of the western Panhandle, from Escambia County at the west to Jackson, Calhoun, Gulf and Franklin Counties at the east. Severe drought (D2) was present in the extreme northern portion of Santa Rosa County. In all, 83% of the state was classified as drought-free, approximately 2% as D0, approximately 15% as D1, and less than 0.2% as D2. Below normal rainfall and above normal temperatures in November have lead to the intensification and eastward spread of the dry conditions. As of the latest US Drought Monitor Report, issued on November 29th, approximately 59% of the state remains drought-free. Abnormally dry (D0) conditions are currently affecting approximately 17% of the state (including Alachua, Baker, Bradford, Clay, Columbia, Dixie, Duval, Gilchrist, Lafayette, Levy, Nassau, Putnam, Suwannee, and Union Counties). Moderate drought (D1) conditions are affecting approximately 7% of the state (including Jefferson, Hamilton, Leon, Madison, Taylor, and Wakulla Counties). Severe drought (D2) conditions are affecting approximately 10% of the state (including Calhoun, Franklin, Gadsden, Gulf, and Liberty Counties, and parts of Bay, Jackson and Washington Counties). Extreme drought (D3) conditions are present in about 7% of the state (Holmes, Okaloosa, Santa Rosa, and Walton Counties, and parts of Bay, Jackson, and Washington Counties). In all, drought conditions are present in about 41% of the state, currently affecting roughly 1.4 million Florida citizens. Water levels in Lake Okeechobee at the end of the month were about 14.8 ft., which is about average for this time of the year.
Agriculture Related Impacts.
At the beginning of November, topsoil moisture levels across the state were at mainly (59%) adequate, with the remainder ranging from surplus (8%) to short (20%) or very short (13%). Below normal rainfall and above normal temperatures have reduced soil moisture levels, shifting to drier conditions by the end of the month, with 40% of topsoil moisture levels reported adequate, 24% short, and 35% – very short. Cotton harvesting continues, and peanut harvesting is wrapped up for the season. Dry conditions have been having an impact on field crops in many areas, particularly in the Panhandle and North Florida. Drought conditions are interfering with the planting of winter field crops and winter forages, particularly in Jackson and Holmes Counties. Hay cutting in Jackson County is hampered by the dry conditions. Pasture conditions are declining because of drought conditions in all but the southern part of the state, and water sources are drying up. There are reports from Holmes County of stock ponds drying up and wells going bad. Because of the declined pasture conditions producers are feeding hay earlier than expected. Despite that, cattle remain in mostly good to fair condition. The citrus growing region remains drought-free but groves are regularly irrigated to offset the deficiencies in rainfall. Irrigation is also widely employed by vegetable growers and land is being prepared for planting. Sugarcane harvesting in Glades, Hendry, and Palm Beach Counties continues on schedule
.
Appendix 1: Additional November departures from normal data for Florida locations.
Appendix 2: Select daily maximum and minimum temperature records (° F) broken during November (compiled from NOAA, NWS).
Prepared by Lydia Stefanova, Daniel J. Brouillette, and David F. Zierden.
Florida Climate Center
The Florida State University
Tallahassee, FL
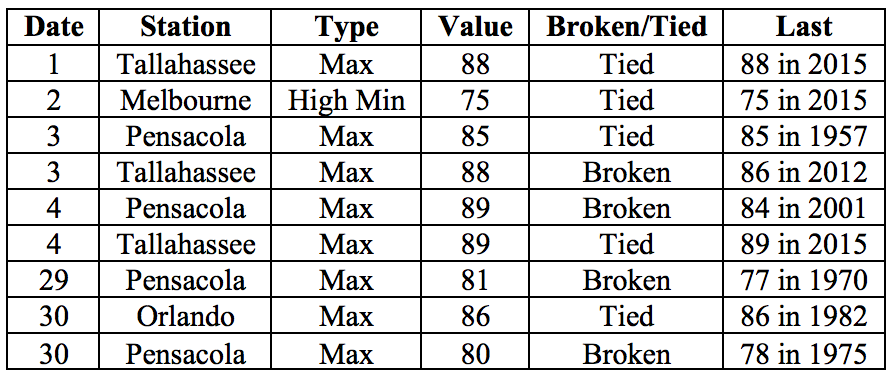
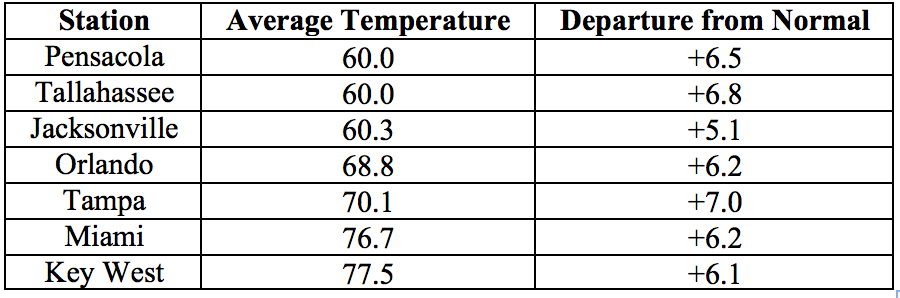
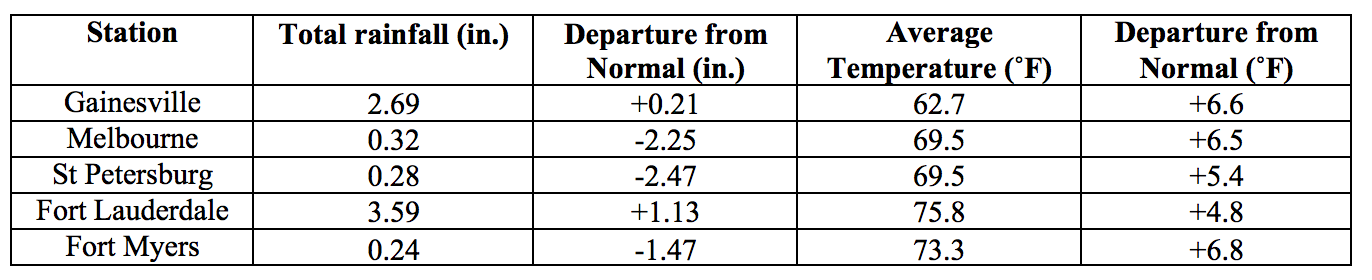
Average temperatures were above normal across the state in December. The departures from average temperatures in December 2016 were well above normal across the entire state, ranging from +4.8˚F in Fort Lauderdale to +7.0˚F in Tallahassee (Table 1 and Appendix 1). Despite the warm December temperatures, minimum temperatures at or below freezing occurred on several nights in the northern portion of the state. December 2016 was the 2nd warmest in Key West, Miami, Fort Myers, 3rd warmest in Tampa, and 4th warmest in West Palm Beach and Orlando. Multiple maximum and high minimum temperature records were tied or broken across the state in December. In the interest of space, only the broken records are displayed in Appendix 2.
Table 1: December average temperatures and departures from normal (˚F) for selected cities.
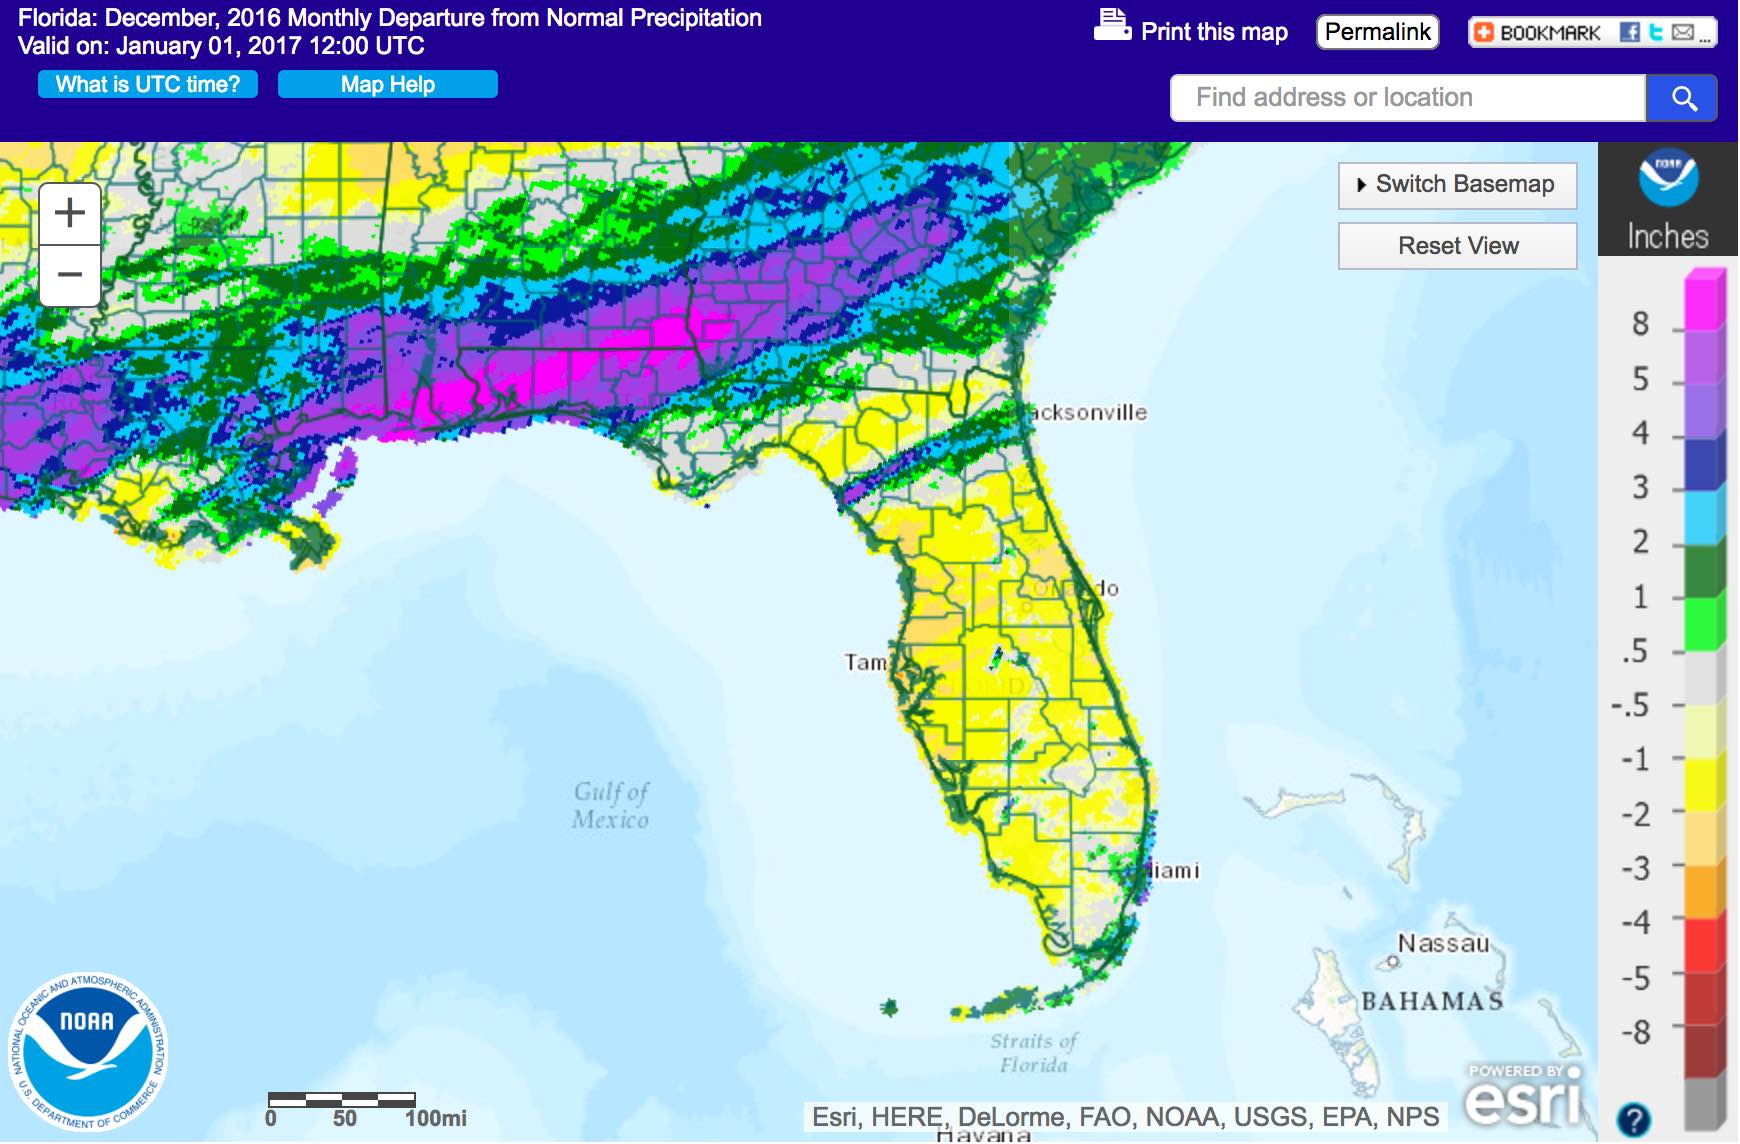
Rainfall totals in December were varied across the state. Most of the Western Florida Panhandle and the Gold Coast received above-normal rainfall for the month, while most of the remainder of the state received below-normal amounts (Figure 1). Departures from normal ranged from -2.47” in St. Petersburg to +5.07” in Pensacola (Table 2 and Appendix 1), though localized parts of the state saw rainfall totals that were as much as 3.00” below normal to 8.00” above normal (Figure 1). December 2016 was the 6th wettest on record for Pensacola There were several 24-hour precipitation records broken for the month (Table 3).
Table 2: December precipitation totals and departures from normal (inches) for select cities.
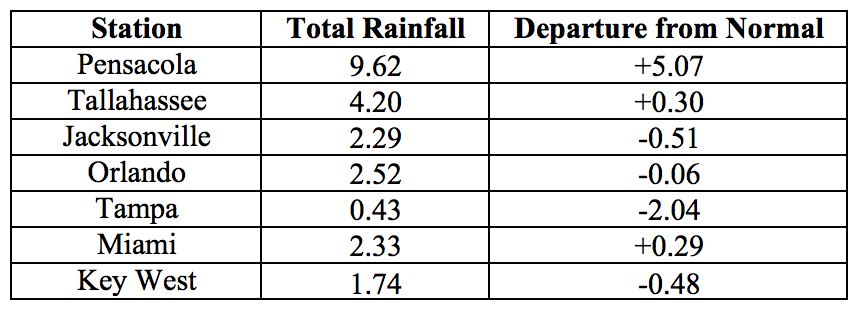
Figure 1: A graphical depiction of the monthly rainfall departure from normal (inches) for December is given in the figure below (courtesy of NOAA, NWS).
La Niña Conditions are Present in the Pacific.
Based on current data and forecast models, the Climate Prediction Center (CPC) will keep the ENSO Alert System at an La Niña Advisory. La Niña conditions are present, and sea surface temperatures (SSTs) continue to be below average in the central and eastern equatorial Pacific Ocean. Computer model predictions favor a transition to ENSO-neutral conditions sometime during Spring 2017. The CPC outlook for January 2017 through March 2017 favors below average precipitation and above average temperatures across the state.
Hazardous Weather Events in December.
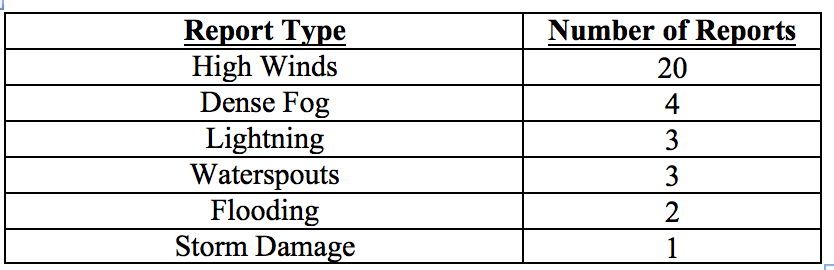
There were a total of 33 severe weather reports made in Florida during December, making for a second relatively quiet month in a row (for a breakdown by event type see Table 4, compiled from data collected by the Southeast Regional Climate Center at http://sercc.com/lsr). The largest fraction of hazardous weather reports concerned high winds in the Pensacola area and along the Space Coast mid-day of December 6th. Lightning strikes were reported on the 4th in the western Panhandle, striking two different residences, and a fatal lightning strike was reported on the 13th in Escambia County. Dense fog with visibility under a quarter of a mile was reported in the early hours of 12th and 13th in several locations in South Florida.
Table 4: Breakdown of storm reports submitted in Florida during the month of December (Compiled from Southeast Regional Climate Center.)
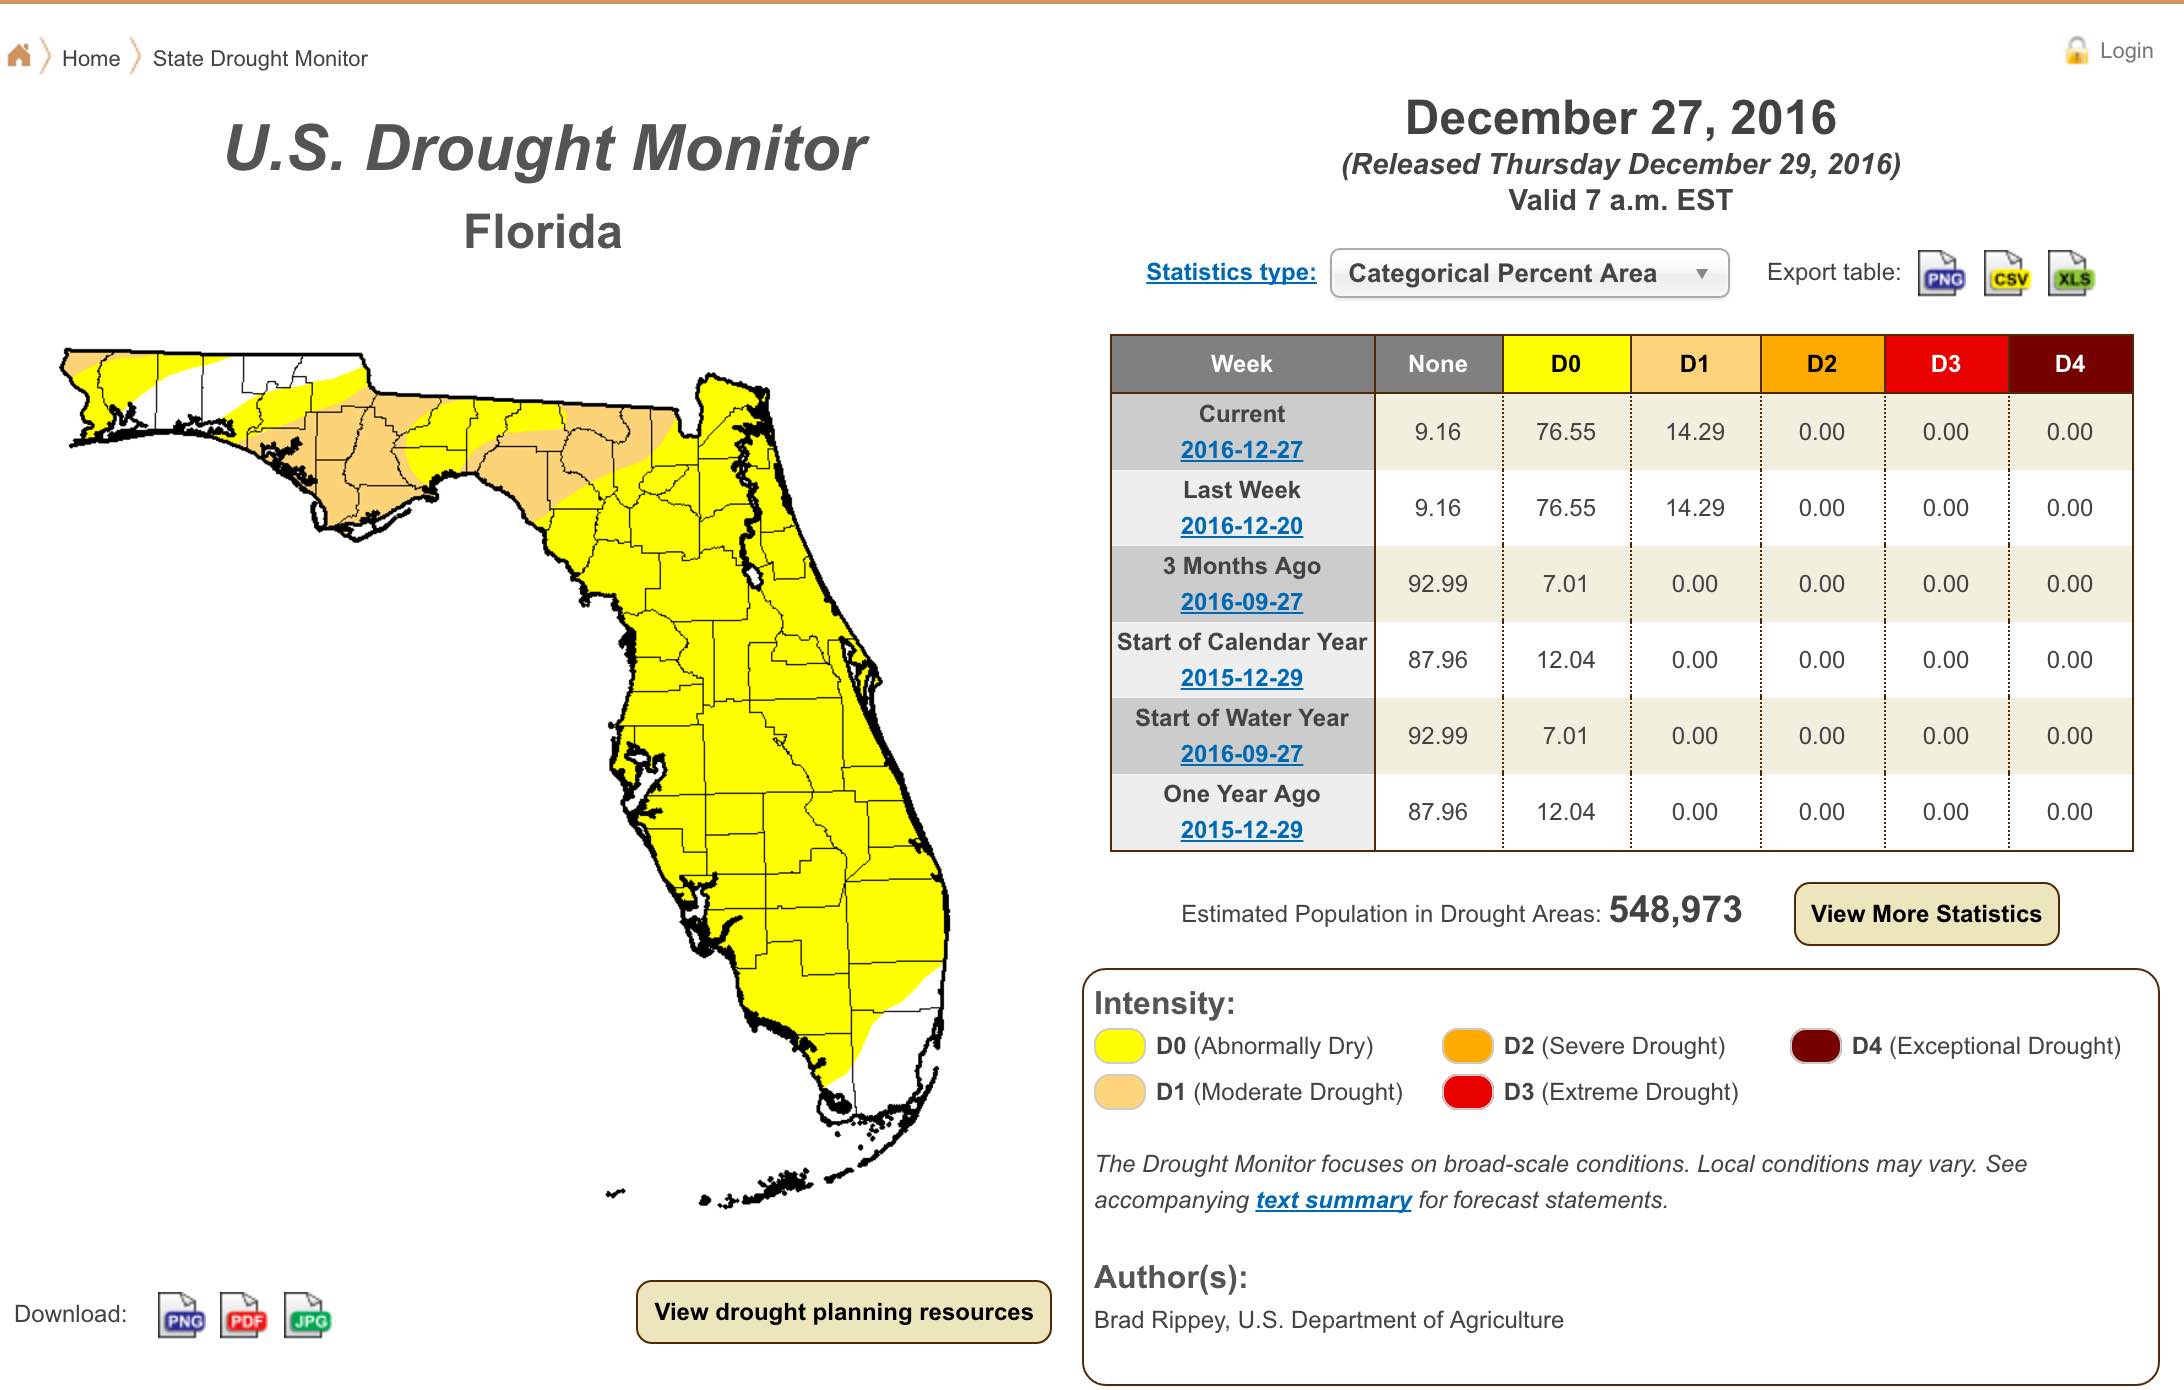
Drought Related Impacts.
At the end of November, most of peninsular Florida was drought-free, and the Panhandle was experiencing abnormally dry to extreme drought conditions, generally worsening from the east to the west. Approximately 17% of the state was under abnormally dry (D0) conditions, 7% under moderate drought (D1), 10% under severe drought (D2), and another 7% under extreme drought (D3) conditions. Rains over the first few weeks of December significantly improved conditions in the western Panhandle, most notably in Santa Rosa, Okaloosa, Walton, Holmes, Washington and Jackson counties where D3 conditions were replaced with drought-free, or at most abnormally dry classification. At the same time, persistent rain deficits have led to abnormally dry conditions setting in most of peninsular Florida, with the exception of most of Dade and some of Broward and Monroe Counties. By the end of the month about 9% of the state is completely drought free, 77% is experiencing abnormally dry conditions, and 14% (including most of Bay, Gulf, Calhoun, Gadsden, Liberty, Franklin, Taylor, Suwannee, and Hamilton Counties, as well as portions of Escambia, Jackson, Wakulla, Jefferson, Madison, Columbia, and Baker Counties) is experiencing moderate drought. In all, the moderate drought conditions are affecting some 550,000 Florida citizens. The water level in Lake Okeechobee is down to about d to about 14.25’, which is slightly below the long-term average value for this time of the year.
Agriculture Related Impacts.
At the beginning of December, topsoil moisture levels ranged from adequate (40% of soils) to short (25%) or very short (34%) values. As the month progressed, rains in the Panhandle delivered some much-needed moisture to the region, leading to an overall improvement in soil moisture levels. At the same time, peninsular Florida saw a deficit of rainfall and a reduction in soil moisture levels. In all, the month ended on a better note, with 47% of soils reporting adequate moisture levels, 33% - short, and 15% - very short. Temperatures across the citrus growing area have been very warm, and canals and ditches are at low levels because of low rainfall amounts over the past couple of months. Growers are irrigating frequently to provide sufficient moisture for the trees. Oranges and grapefruit are being harvested, and fruit quality is holding well. Sugar cane harvesting continues in southern counties. Planting of winter forage and cover crops, as well as harvesting of cotton and peanuts, that was previously delayed due to drought conditions was able to be resumed in some Panhandle counties following the improvement of soil moisture conditions. Cattle condition across the state remains mostly good despite the worsening of pasture quality. Most cattle are receiving supplemental feeding with hay.
.
Appendix 1: Additional December departures from normal data for Florida locations.
Appendix 2: Select daily maximum and minimum temperature records (° F) broken during December (compiled from NOAA, NWS).
Prepared by Lydia Stefanova, Daniel J. Brouillette, and David F. Zierden.
Florida Climate Center
The Florida State University
Tallahassee, FL
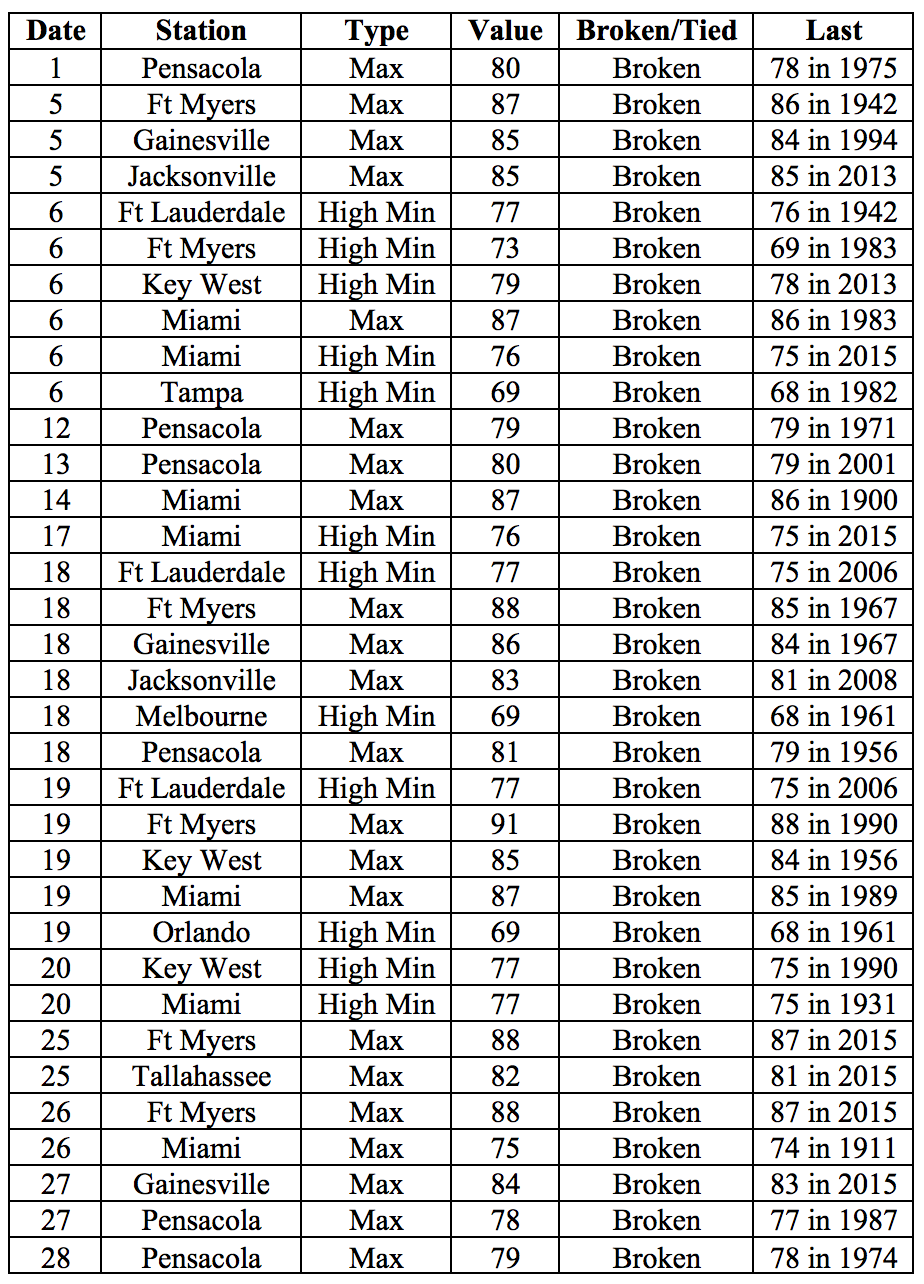
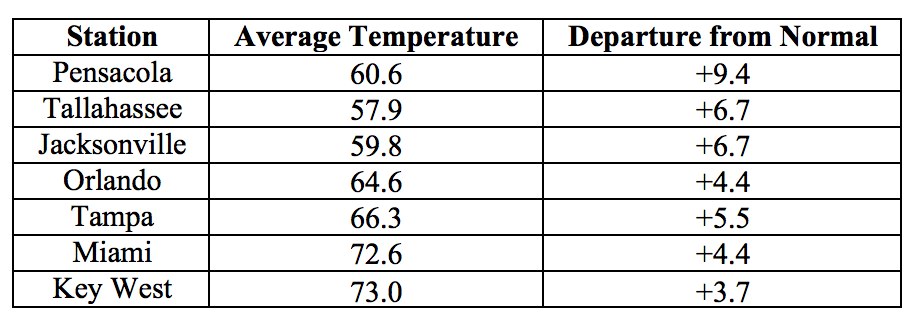
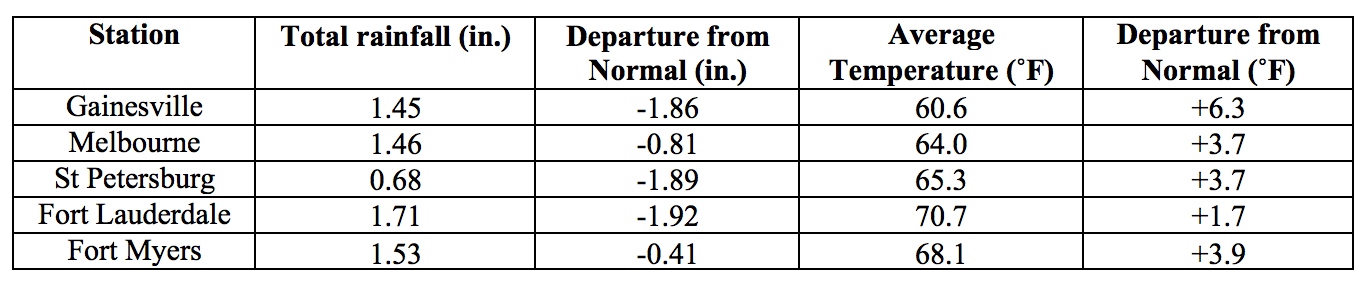
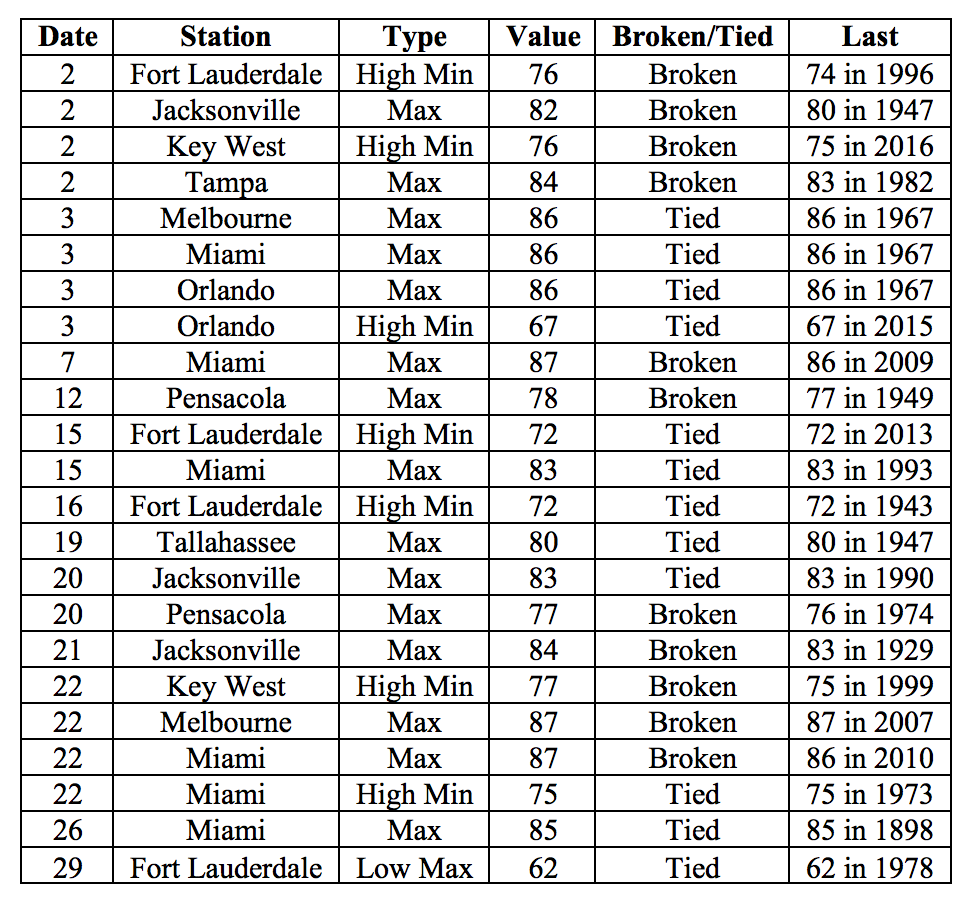
Average temperatures were above normal across the state in January. The departures from average temperatures in January 2017 were above normal across the entire state, ranging from +1.7˚F in Fort Lauderdale to +9.4˚F in Pensacola (Table 1 and Appendix 1). This was the 5th warmest January on record in Pensacola. Despite the warm average temperatures, below-freezing temperatures were observed on several nights at stations across north Florida. Multiple temperature records were tied or broken across the state in January (Appendix 2), with all but one of those associated with warm temperatures.
Table 1: January average temperatures and departures from normal (˚F) for selected cities.
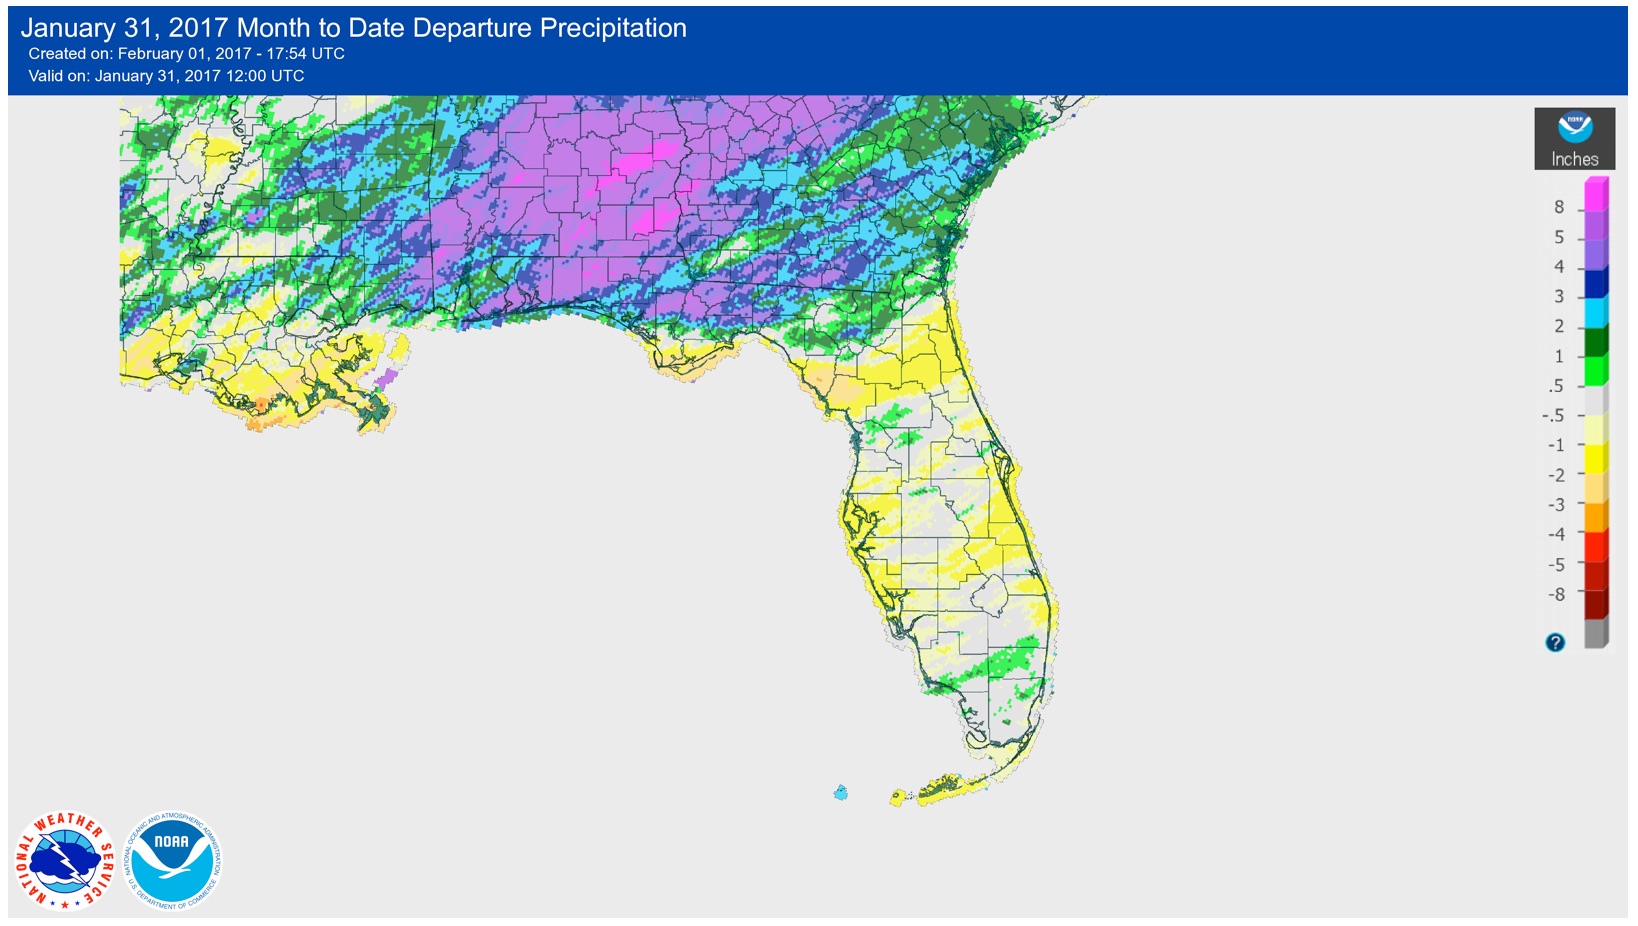
Rainfall totals in January were varied across the state. Most of north Florida recorded above normal rainfall, and most of peninsular Florida had below-normal rainfall, with localized exceptions (Figure 1). At the major reporting stations, departures from normal roughly ranged from -1.92” to 7.27” (Table 2 and Appendix 1), though localized parts of the state saw rainfall totals that were as much as 3.00” below normal to 8.00” above normal (Figure 1). January 2017 was the 6th wettest in Pensacola, and 10th wettest in Tallahassee and Lake City. There were no 24-hour precipitation records broken for the month at any of the major reporting stations.
Table 2: January precipitation totals and departures from normal (inches) for select cities.
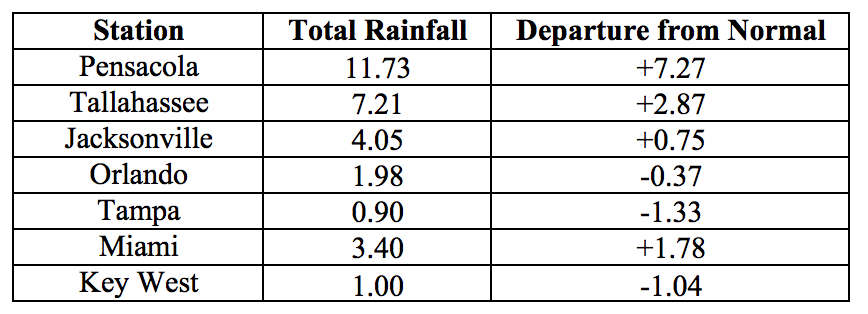
Figure 1: A graphical depiction of the monthly rainfall departure from normal (inches) for January is given in the figure below (courtesy of NOAA, NWS).
La Niña Conditions are Present in the Pacific.
Based on current data and forecast models, the Climate Prediction Center (CPC) will keep the ENSO Alert System at a La Niña Advisory. La Niña conditions are present, as near- to below-normal equatorial sea surface temperatures (SSTs) continue across the central and east-central Pacific Ocean. SSTs are above normal in the in the far eastern Pacific Ocean. A transition to ENSO-neutral conditions is expected during February 2017, and ENSO-neutral conditions are expected to continue through the first half of the year. The CPC seasonal outlook favors above-normal temperatures and below-normal precipitation for the state for February through April 2017.
Hazardous Weather Events in January.
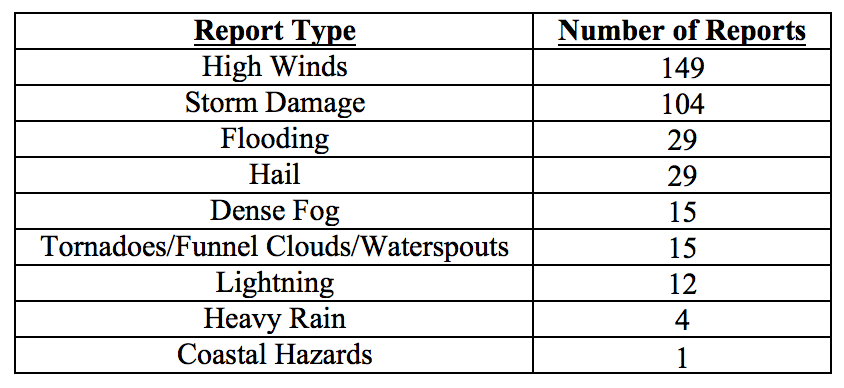
January 2017 had a total of 358 local storm reports logged in the state (see Table 4 for a breakdown by type). Most of these hazardous weather events fell within three clusters: January 2nd (30 reports), 6th-7th (44 reports), and 21st-23rd (252 reports, or over 70% of the month’s total).
On January 2nd, severe weather was observed over the western Panhandle, as moisture inflow from the Gulf of Mexico combined with a strong upper-level disturbance and a strengthening low-pressure system. Numerous storms produced heavy rain, lightning, and high winds. Several lightning strikes were reported on houses across Santa Rosa County, causing house fires in at least four homes. A person in a tent was taken to the hospital for a lightning strike but was not injured. Flooded roadways and bridges were reported in numerous areas in Escambia and Walton counties, and a drowning fatality was reported in Walton County. Several measurements of marine winds over 40MPH were recorded over the coastal waters, and automated observing stations in Jackson County recorded thunderstorm winds of 60MPH. Thunderstorm winds caused damage to power lines and several structures in Escambia, Walton, Holmes, and Jackson Counties, and wind-downed trees were responsible for vehicle damage in Escambia County. Also on the 2nd, but not as part of this severe weather complex, one person drowned and two people required rescue from dangerous rip currents in Pompano Beach (Broward County).
On January 6th-7th, another strong cold front passed over the state. January 6th brought dense morning fog in Collier, Broward and Miami-Dade Counties created dangerous driving conditions, with visibility along some highways below a quarter of a mile. Later that evening as the front pushed through, there were reports of hail, and downed trees and power lines in Columbia County. A brief weak (EF0) tornado produced damage to roofs and trees in a quarter mile swath in Suwannee County in the early hours of the 7th. Over the next twelve hours, as the storm quickly swept to the south, high winds exceeding 40MPH were reported from Citrus, Manatee, Brevard, Broward, Palm Beach, Miami-Dade Counties, and along the Florida Keys. Thunderstorm wind damage, including damage to trees, power lines, cars and homes was reported in Suwannee, Citrus, Marion, and Miami-Dade Counties. These storms also produced dangerous lightning, resulting in one injury in Volusia County in the early morning hours of the 7th.
On January 21st-23rd, a vigorous cold storm combined with enhanced low-level southerly flow bringing in warm Gulf air created a potent environment for severe weather from the western Panhandle to south-central Florida. A Particularly Dangerous Situation tornado watch was issued for a large swath of the state. The storm system did produce an unusually high number of tornadoes across the Southeast US, ending up as one of the largest winter tornado outbreaks on record. Fortunately for Florida, however, most of the tornadic activity spared the state, with only a few weak tornadoes (EF0 and EF1) observed or confirmed by damage surveys in Franklin, Miami-Dade, and Palm Beach Counties. Funnel clouds were observed in Brevard, Escambia, and Lake County but dissipated before touching ground. Waterspouts were spotted offshore from Destin and Fort Walton Beach. Storm surge of two to three feet, combined with high tide, caused coastal flooding along the Gulf Coast from Levy to Manatee County on the 22nd. Reports of up to one-inch diameter hail were widespread in Bay, Brevard, Duval, Flagler, Lake, Okaloosa, Santa Rosa, Suwannee, Union, Volusia, and Walton Counties. Reports from Escambia County indicated up to two-inch hail. High sustained winds and strong wind gusts were reported throughout the state, from the western Panhandle to South Florida, resulting in widespread storm damage and numerous power outages affecting tens of thousands of households.
Table 4: Breakdown of storm reports submitted in Florida during the month of January (Compiled from Southeast Regional Climate Center.)
Drought-Related Impacts.
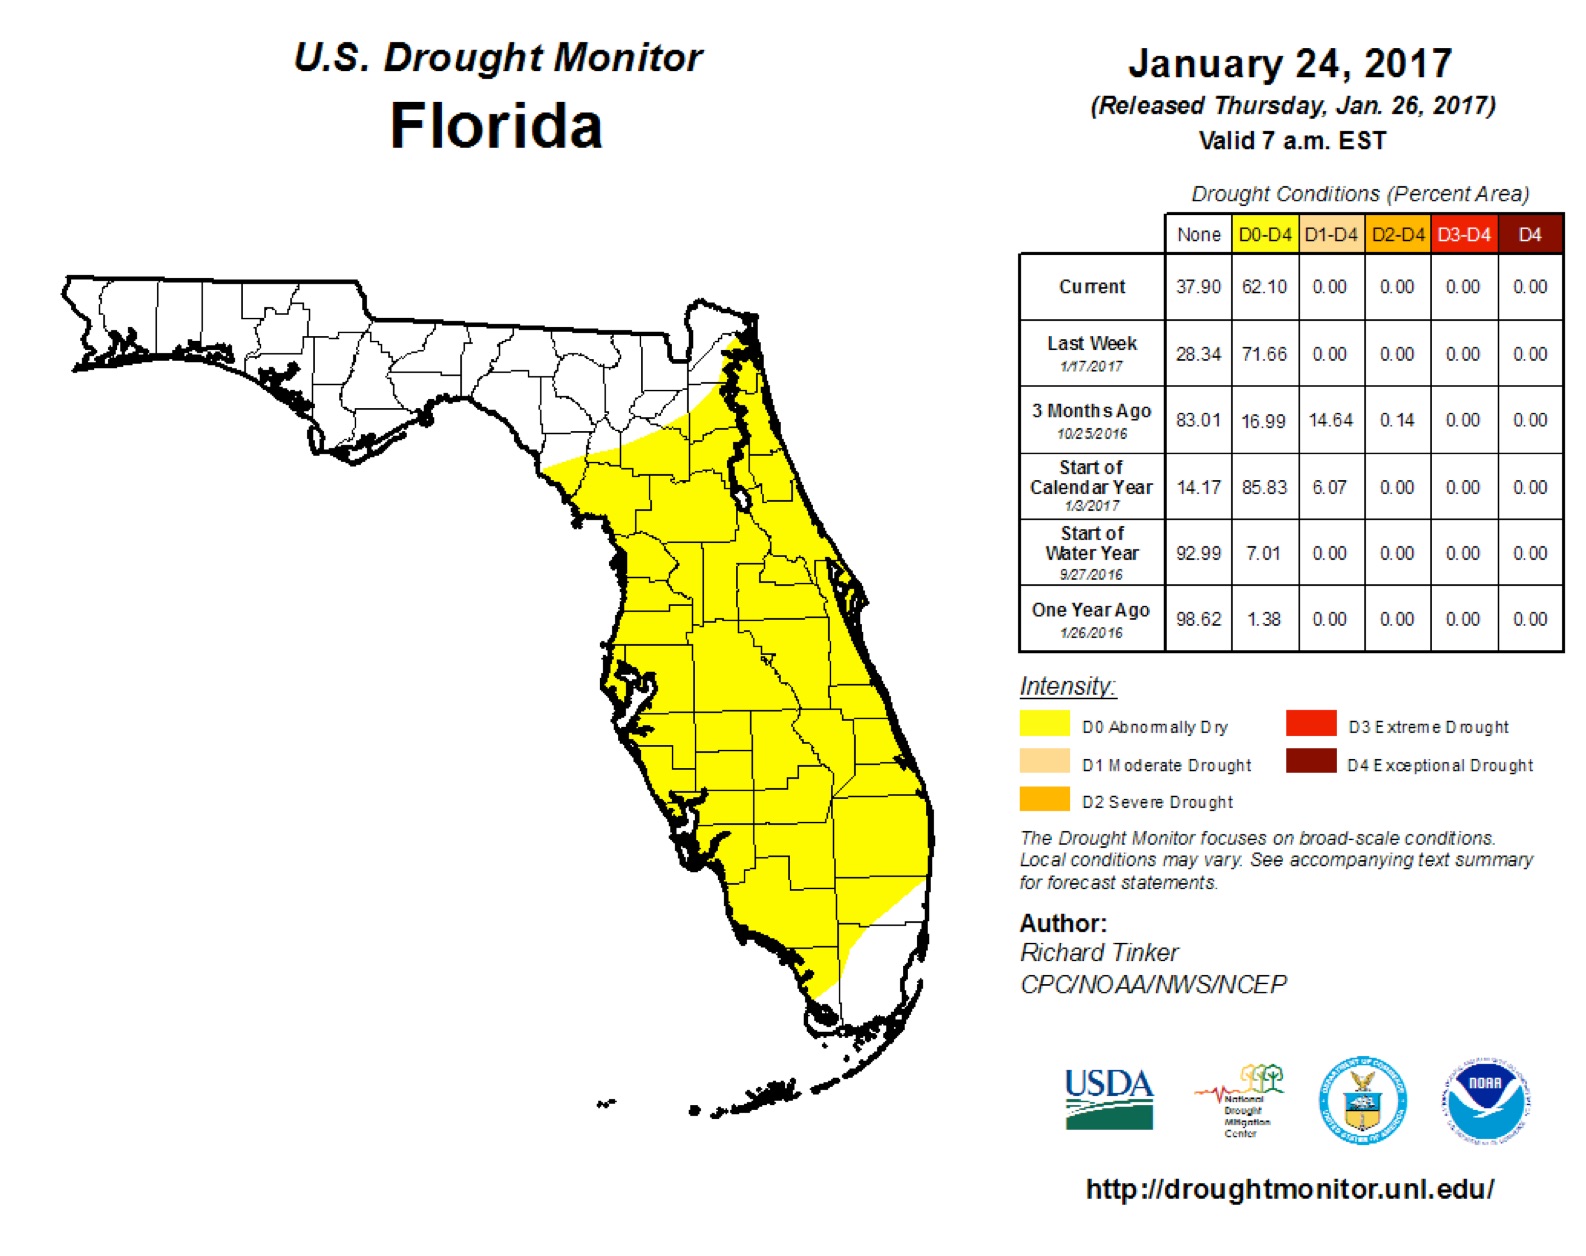
The previous month’s trend of improving drought conditions continued into January. According to the US Drought Monitor Report, at the end of December, about 9% of the state was completely drought free, 77% is experiencing abnormally dry conditions, and 14% (including most of Bay, Gulf, Calhoun, Gadsden, Liberty, Franklin, Taylor, Suwannee, and Hamilton Counties, as well as portions of Escambia, Jackson, Wakulla, Jefferson, Madison, Columbia, and Baker Counties) were experiencing moderate drought. By January 3rd, following heavy rains there, drought conditions were lifted from Escambia, Santa Rosa, Okaloosa, Walton and Washington Counties, and downgraded in other Panhandle counties. The easing of drought conditions in the Panhandle continued as the month progressed. As of the latest US Drought Monitor report (January 24th), approximately 38% of the state, including the entire Panhandle, is drought free. The remaining 62%, constituting most of Peninsular Florida, are affected by abnormally dry (D0) conditions.
Water levels in Lake Okeechobee at the end of the month were at 13.85 feet, which is somewhat below the average for this time of the year.
Agriculture-Related Impacts.
The month began with soil moisture levels predominantly in the adequate (45%) to short (34%) range, with some (14%) very short and some (7%) surplus values also present. By the end of the month there was a slight improvement, with 51% adequate, 35% short, 6% very short and 8% surplus values.
Abnormally dry conditions have been present in the citrus growing area throughout the month, despite some rain mid-month, and temperatures have been above normal for the season. The water level in canals and ditches is low because of the persistent lack of widespread rain in the region for the past several months. Growers are irrigating frequently to maintain sufficient moisture in the ground and on the trees. Blooming has begun statewide. Tangerines are harvested for the fresh market, mid-season oranges are steadily improving in internal quality, and grapefruit harvest is strong and of good quality.
Cattle condition across the state is holding at fair to good, while pasture quality is seasonally declining. Some frost damage midmonth has contributed to poor pasture conditions in Dixie and Pasco Counties, and standing water was a problem in some pastures in Holmes and Washington Counties. Supplemental feeding of cattle has been used to compensate for poor pasture quality in Brevard, Charlotte, Collier, Glades, Indian River, Okeechobee, Lee, Pasco, and St. Lucie Counties.
The strong rains early in the month brought relief from dry conditions in most of the Panhandle, but also caused some erosion problems in Okaloosa County. Farmers in Dixie, Flagler, Putnam, and Suwannee Counties have begun planting cover crops and spring potatoes. Sugarcane harvest in south Florida continues strong and on schedule.
Foggy mornings have been conducive to diseases in vegetables for southwest Florida. Strong winds on the 22nd and 23rd also damaged some vegetable crops in that region. The warm winter weather has some blueberry growers concerned about the lack of sufficient accumulated chill hours and premature blooming.
Appendix 1: Additional January departures from normal data for Florida locations.
Appendix 2: Select daily maximum and minimum temperature records (° F) broken during January (compiled from NOAA, NWS).
Building A, Suite 292
Tallahassee, FL 32306-2741
Phone: (850) 644-3417 | (850) 644-0719
climate@coaps.fsu.edu