


The Florida Climate Center serves as the primary resource for climate data, information, and services in the state of Florida.

The Florida Climate Center achieves its mission by providing climate monitoring, research, and expertise to be applied by the people, institutions, and businesses of Florida and the surrounding region.
We provide direct service by fulfilling requests for climate and weather data and information in a variety of formats.
We perform research that advances the understanding of the climate variability and changes of Florida and the surrounding region.
We provide outreach in presentations and at events aimed at a variety of groups, interests, and ages.
Prepared by Lydia Stefanova and David F. Zierden.
Florida Climate Center
The Florida State University
Tallahassee, FL

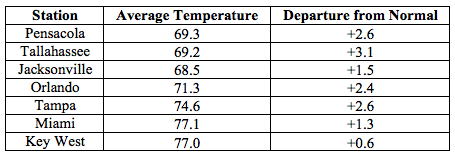
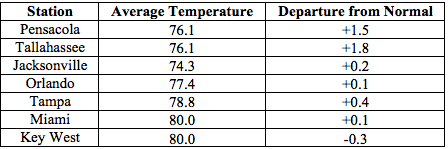
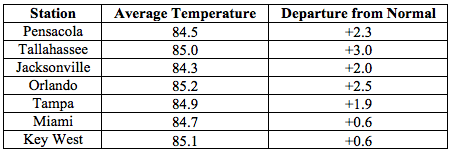
Average temperatures were above normal across the state in April. The departures from average temperatures in April 2016 were above normal across the state, ranging from +0.6˚F in Key West to +3.1˚F in Tallahassee (Table 1 and Appendix 1). In North Florida, minimum temperatures as low as in the upper 40s were seen during several days of the month. Most reporting stations across the state recorded between one and two days with maximum temperatures as high as in the low 90s.
Table 1: April average temperatures and departures from normal (˚F) for selected cities.
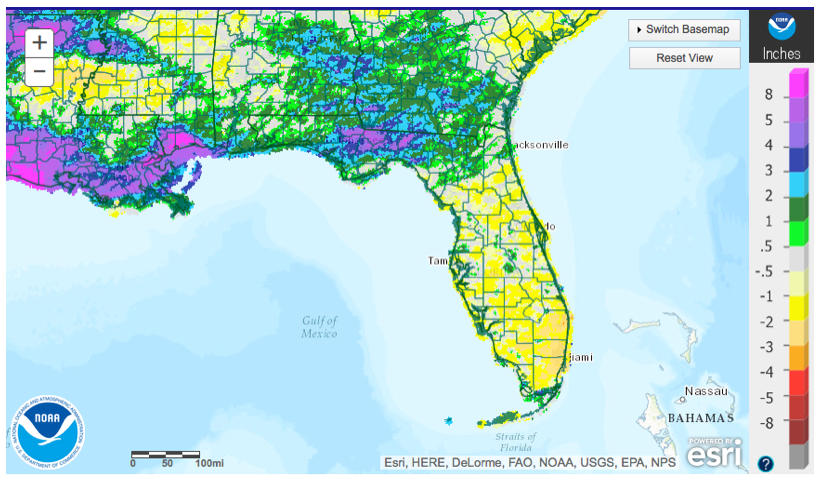
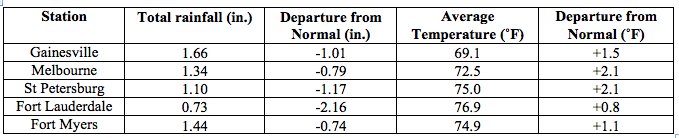
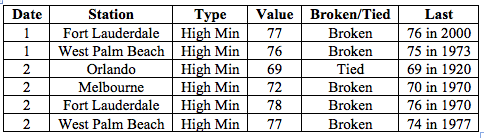
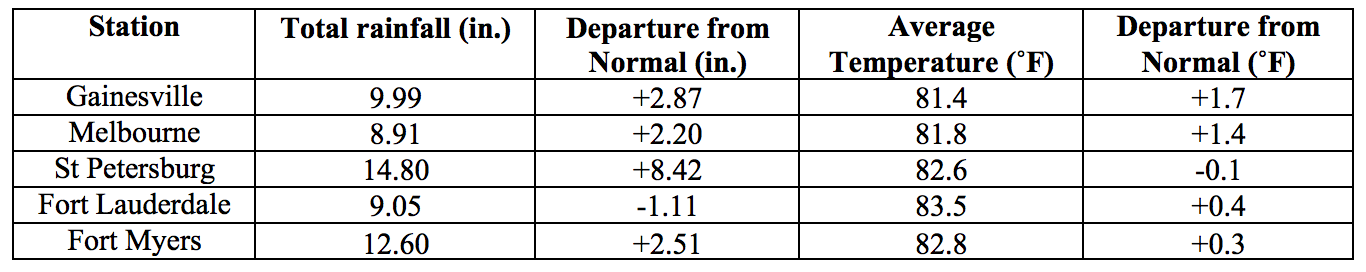
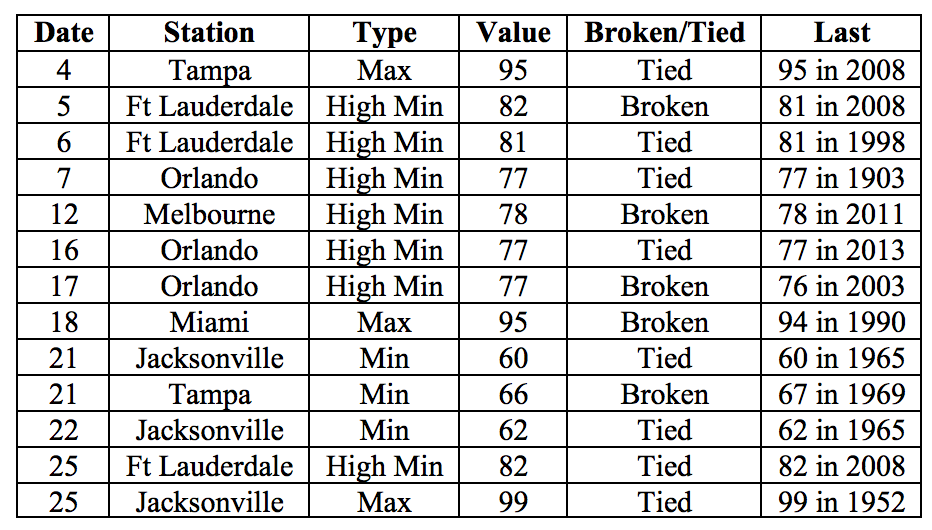
Rainfall totals in April were varied across the state. Rainfall totals were above normal for the month across the Panhandle, and below normal for the rest of the state (Figure 1). Major reporting stations registered departures from normal ranging from -2.16” in Fort Lauderdale to +6.49” in Tallahassee (Table 2 and Appendix 1), although localized parts of the state saw rainfall totals that were as much as 4” below normal to 8” above normal (Figure 1). April 2016 was the 6th driest on record for Fort Lauderdale. There were very few 24-hour precipitation records broken for the month (Table 3).
Table 2: April precipitation totals and departures from normal (inches) for select cities.
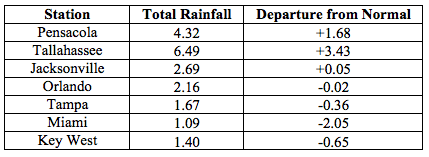
Figure 1: A graphical depiction of the monthly rainfall departure from normal (inches) for April is given in the figure below (courtesy of NOAA, NWS).
El Niño Conditions in the Pacific are present and weakening.
Based on current data and forecast models, the Climate Prediction Center (CPC) has the ENSO Alert System at an El Niño Watch. Positive equatorial sea surface temperatures (SST) anomalies continue across most of the Pacific Ocean. A transition to ENSO-neutral conditions is likely during the late spring or early summer 2016, with an increasing chance of La Nina during the second half of the year. CPC predicts an increased likelihood of above-normal precipitation and above-normal temperatures for Florida for the May-July period of 2016.
Hazardous Weather Events in April.
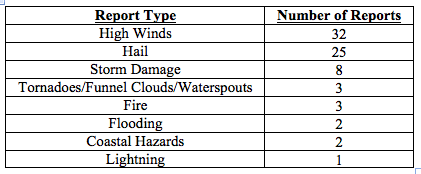
There were a total of 76 hazardous weather reports filed in April. The majority of these were for high winds and hail (see Table 4 for a full breakdown). A frontal passage on April 2nd brought high winds, with gusts up to 50-60 mph reported in Brevard, Duval, Flagler, Hillsborough, Pinellas, and Volusia Counties. Isolated flooding on that date was reported in Tallahassee, and minor storm damage was reported in Daytona Beach. In the morning of April 7th, what was likely a tornado downed powerlines and trees in Clearwater and New Port Richey, leaving thousands of customers without power. A frontline stalled over central Florida between the 14th and 15th and spawned numerous hail-producing thunderstorms. Hailstones up to 2” were reported by observers in Palm Beach and Polk County, and up to 1.5” in Martin County. Hail reports also came in from Indian River and Sumter Counties. A large wildfire of unknown origin spread across nearly 4000 acres in the Everglades spread between April 10th and 16th. Thanks to prior prescribed burning in the area, the spread was limited on most sides, and ground and aerial crews were eventually able to contain the fire and avert damage to structures. Unfortunately, hazardous weather in April was responsible for two fatalities in the state: one the result of a lightning strike near Palm Beach on April 15th, and the other the result of strong rip currents off of Jacksonville Beach on April 16th.
Table 4: Breakdown of storm reports submitted in Florida during the month of April (Compiled from Southeast Regional Climate Center.)
Agriculture Related Impacts.
At the beginning of the month, most (76%) soil ratings fell into the category of “adequate”, with additional 10% of ratings falling into the “short” and 13% into the “surplus” category. The overall lack of rain towards the second half of the month, combined with warmer temperatures, has reduced soil moisture values. By the end of April, only 56% of soil moisture values were classified as adequate, and the percentage of short values increased to 32%.
Throughout the month, planting of corn, cotton and peanuts was underway in the Panhandle Counties, with occasional interruptions due to wet conditions. Pasture and cattle conditions in Charlotte, Collier, Glades, Hendry, and Highlands Counties remain in mostly good condition thanks to warmer and dryer weather. The citrus-growing area remains largely drought free, but most groves have required irrigation several times a week. The citrus tree bloom is over and small pea- to marble-size fruit for next season crop has started developing. The weather has been mostly favorable for fruit and vegetable planting, as well as harvesting.
Drought Related Impacts.
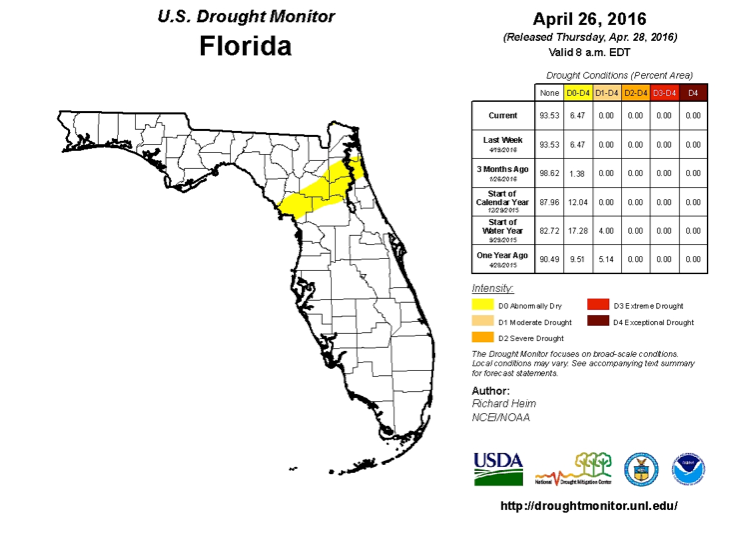
At the end of March, about 20 percent of the state - including Alachua, Baker, Bradford, Clay, Columbia, Dixie, Duval, Flagler, Gilchrist, Hamilton, Lafayette, Levi, Madison, Marion, Nassau, Putnam, St Johns, Suwannee, Taylor, and Union counties - was affected by abnormally dry conditions. Early in April, Flagler and Volusia counties were also briefly added to the list. Beneficial rains in the first two weeks of the month helped most of the affected counties, leaving only Levi, Marion, Alachua, Putnam, Clay, and St. Jones in conditions of abnormal drought by the end of the month. As of the most recent US Drought Monitor report, issued on April 26, 93.4% of the state is drought-free. The water level at lake Okeechobee at the end of the month was at 14.2’, which is above the average for this time of the year.
Appendix 1: Additional April departures from normal data for Florida locations.
Appendix 2: Select daily maximum and minimum temperature records (° F) broken during April (compiled from NOAA, NWS).
Prepared by Lydia Stefanova and David F. Zierden.
Florida Climate Center
The Florida State University
Tallahassee, FL
Average temperatures were above normal across most of the state in May. TThe departures from average temperatures in May 2016 were mostly near normal to above normal across the state, ranging from -0.5˚F in Fort Lauderdale to 1.8˚F in Tallahassee (Table 1 and Appendix 1). There were a small number of record low minimum temperatures tied or broken in the first week of May, and a small number of record high minimum temperatures broken towards the middle of the month (Appendix 2).
Table 1: May average temperatures and departures from normal (˚F) for selected cities.
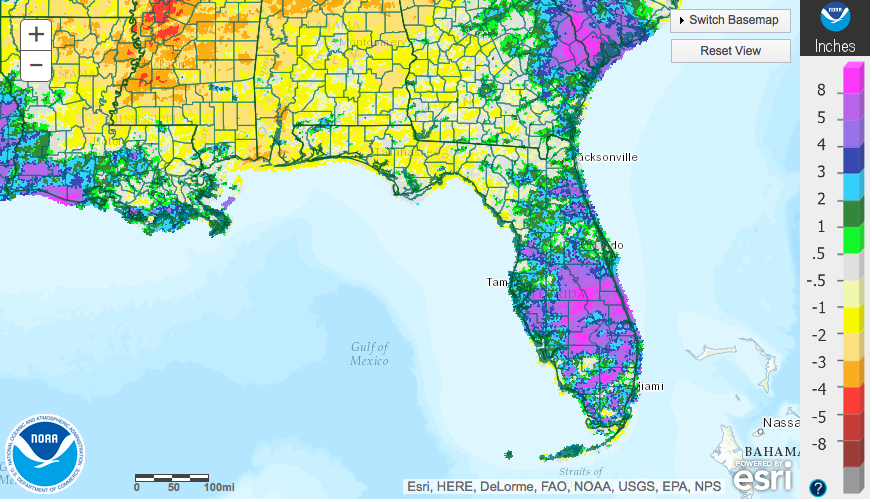
Rainfall totals in May were varied across the state. Rainfall totals varied across the state. The Panhandle received below-normal precipitation while Peninsular Florida received above-normal amounts (Figure 1), a pattern opposite of that in the preceding month. Major reporting stations registered departures from normal ranging from -2.22” in Pensacola to +4.56” in Melbourne (Table 2 and Appendix 1), although localized parts of the state saw rainfall totals that were as much as 3” below normal to more than 8” above normal (Figure 1). May 2016 was the wettest on record for Vero Beach and the 4th wettest for Melbourne. There were a small number of 24-hour precipitation records broken for the month (Table 3).
Table 2: May precipitation totals and departures from normal (inches) for select cities.
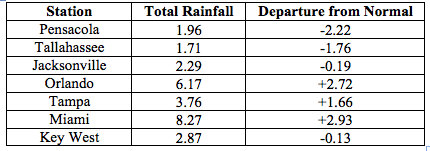
Figure 1: A graphical depiction of the monthly rainfall departure from normal (inches) for May (courtesy of NOAA, NWS).
El Niño Conditions in the Pacific Are Weakening.
Based on current data and forecast models, the Climate Prediction Center (CPC) the ENSO Alert System is currently set at El Niño Advisory/La Niña Watch. El Niño conditions are weakening, and positive equatorial sea surface temperatures (SST) are diminishing across the equatorial Pacific Ocean. Conditions are favoring a La Niña development starting in the summer of 2016, and there is approximately a 75% chance of La Niña during the fall and winter of 2016-2017.
Hazardous Weather Events in May.
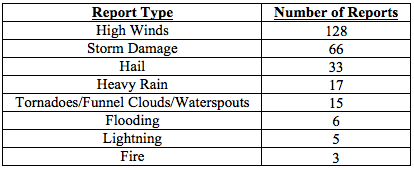
There were a total of 273 severe weather reports made in Florida during May (see Table 4). The majority were reports of high winds (128 reports) and storm damage (66 reports). As in the previous month, hail reports were frequent (33 reports).
Table 4: Breakdown of storm reports submitted in Florida during the month of May (Compiled from Southeast Regional Climate Center.)
Agriculture-Related Impacts.
At the end of April and beginning of May, top-soil moistures were mostly adequate (56% of values) to short (32%), representing a drying from the preceding weeks. Mid-month, overall soil moisture levels were temporarily improved, but towards the end of the month, they returned back to a similar distribution. Peninsular Florida, which had been dry in April, was relatively wet in May, and conversely, the Panhandle, which was relatively wet in April, was relatively dry in May. The rainfall distribution affected field activities and conditions. Cotton, peanut, and corn planting was progressing quickly in Washington, Okaloosa and Santa Rosa Counties where conditions were favorable. In areas with insufficient rainfall, planting schedules and planted corn conditions have been adversely impacted by insufficient soil moisture levels due to warmer temperatures and lack of rain. Farmers in areas with low soil moisture levels are waiting for more moisture to resume planting. Because of dry soil conditions, planting of peanuts was halted in Jackson and Holmes Counties, however overall peanut planting is 87% complete, ahead of the 5-year average. Warmer temperatures and less precipitation along the Panhandle initially benefited areas where fields and pastures had been previously flooded, but continued lack of precipitation has started worsening conditions. Light rains in previously dry areas in Peninsular Florida benefitted some areas that were previously somewhat dry. Heavy rains in portions of the central and southern parts of the state temporarily flooded but have begun to dry out. The relatively dry weather early in the month required irrigation of citrus groves, but this need was eased by beneficial rains later in the month. Dryer weather in Okaloosa County helped farmers control strawberry diseases. Completion of sugarcane harvesting was achieved over a month later than usual because of excessive rain rains in Palm Beach County, St. Lucie, Glades and Hendry Counties.
Drought-Related Impacts.
At the beginning of May, 93.4% of the state was drought-free, with abnormally dry conditions affecting portions of Levy, Marion, Alachua, Putnam, Clay, St. Jones, and Duval Counties. These conditions persisted until removed by mid-month rains in the region. As of the latest US Drought Monitor report, issued on May 24th, the entire state is currently drought-free. Water levels in Lake Okeechobee remain high, following heavy rains in Central Florida. The water level in the lake is currently at 14’ 39’’, which is above the average for this time of the year.
Appendix 1: Additional May departures from normal data for Florida locations.
Appendix 2: Select daily maximum and minimum temperature records (° F) broken during May (compiled from NOAA, NWS).
Prepared by Lydia Stefanova and David F. Zierden.
Florida Climate Center
The Florida State University
Tallahassee, FL
Average temperatures in June were mostly above normal across the state. The departures from average temperatures in June 2016 were mostly above normal across the state, ranging from -0.1˚F in St Petersburg to +2.8˚F in Tallahassee (Table 1 and Appendix 1). Despite the warm monthly average temperatures, Fort Myers was the only major reporting stations to register a maximum temperature at or above 95F. June 2016 was the 3rd warmest on record in Miami and Vero Beach, 6th warmest on record for West Palm Beach and Daytona Beach, 7th for Tallahassee, and 8th for Tampa. Several maximum and minimum temperature records were tied or broken across the state in June (Appendix 2).
Table 1: June average temperatures and departures from normal (˚F) for selected cities.
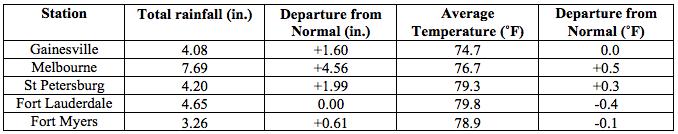
Rainfall totals in June were varied. The departures from average rainfall were highly varied across the state (Figure 1). Tropical Storm Colin made landfall on June 6 in Taylor County and brought heavy rainfall over portions of Florida, resulting in flooding in some areas, especially Hillsborough and Pinellas counties. Major reporting stations registered departures from normal for the month ranging from -3.36” in Jacksonville to +8.42 in St Petersburg (Table 2 and Appendix 1), although localized parts of the state saw rainfall totals that were as much as 5” below normal to over 8” above normal (Figure 1). There were a small number of 24-hour precipitation records broken for the month (Table 3).
Table 2: June precipitation totals and departures from normal (inches) for select cities.
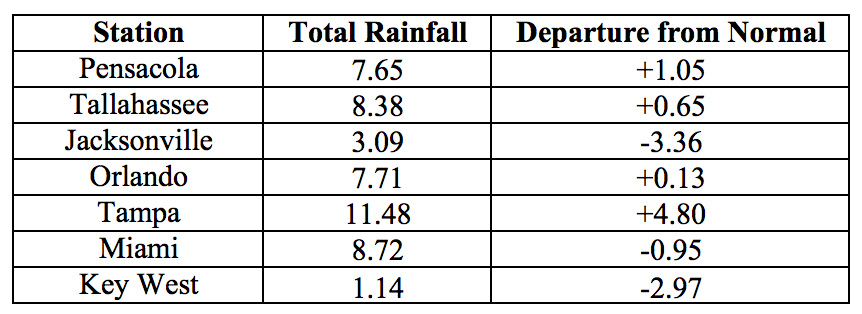
Figure 1: A graphical depiction of the monthly rainfall departure from normal (inches) for June (courtesy of NOAA, NWS).
Neutral ENSO Conditions are Present in the Pacific.
Based on current data and forecast models, the Climate Prediction Center (CPC)’s ENSO Alert System at Final El Niño Advisory/La Niña watch. El Niño has been replaced by ENSO-neutral conditions, with sea surface temperatures near average across the east-central and eastern equatorial Pacific Ocean. There is approximately a 75% chance that La Niña conditions for the fall and winter season of 2016/2017. In its seasonal outlook, CPC predicts a higher than average chance of above-normal precipitation and warmer-than-normal temperatures for Florida for July-September 2016.
Hazardous Weather Events in June.
A total of 440 hazardous weather reports were made in the month of June in Florida. The largest proportion of these reports were concerning high winds, followed by storm damage, heavy rain and thunderstorms (See Table 4 for a full breakdown). A large number of these events were associated with winds and rain from tropical storm Colin between June 5h and June 8th. Colin made landfall on June 6th along the Big Bend of Florida with maximum sustained winds of 50mph. Rainbands from Colin brought thunderstorms with strong gusts to the stretch between St Petersburg, Clearwater, and Tampa and Daytona Beach to Jacksonville, knocking down trees and power lines. Localized areas received rainfall in excess of 11 inches in a single day. Heavy rains and storm surge contributed to flooding along parts of the Gulf Coast, from Southwest Florida to Panama City. Dangerous rip currents developed along the Gulf Coast in the aftermath of the storm resulting in swimmers requiring rescue, and causing several casualties in the Panhandle.
Table 4: Breakdown of storm reports submitted in Florida during the month of June (Compiled from Southeast Regional Climate Center.)
Agriculture-Related Impacts.
At the start of the month, soil moisture levels were mostly adequate (58%) to short (30%), transitioning to overall wetter conditions (61% adequate, 17% short and 15% surplus) towards the end of the month, mostly because of rains from tropical storm Colin. Warmer than average temperatures have put slight heat stress on some fields. Planting of corn, cotton, peanut, and soybean crops was completed in the Panhandle counties. Pastures and livestock are overall generally in good condition, although some fields had temporary standing water for several days following heavy rains. Warm temperatures do not seem to have had a negative impact on cattle. The citrus region remained entirely drought free, and canals and ditches are at acceptable levels. Irrigation is run in most groves two to three times a week. Some grower shave observed postbloom fruit drop in their groves, as well as some citrus greening which is being taken care of by removal of affected trees and replanting. Overall, growers are positive about the outlook of their trees and the crop for next season.
Drought-Related Impacts.
According to the US Drought Monitor, Florida remained completely drought-free throughout the month of June. Water levels at lake Okeechobee are above average for the season, at 14.94 feet.
Appendix 1: Additional June departures from normal data for Florida locations.
Appendix 2: Select daily maximum and minimum temperature records (° F) broken during June (compiled from NOAA, NWS).
Prepared by Lydia Stefanova and David F. Zierden.
Florida Climate Center
The Florida State University
Tallahassee, FL
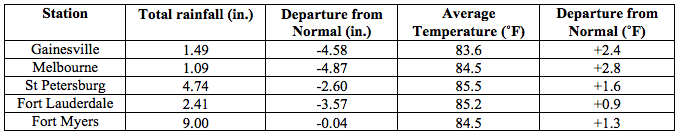
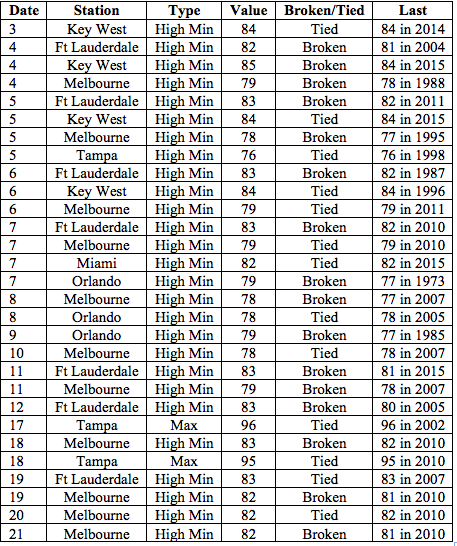
Average temperatures in July were above normal across the state. The departures from average temperatures in July 2016 were above normal across the entire state, ranging from +0.6˚F in Miami and Key West to +3.0˚F in Tallahassee (Table 1 and Appendix 1). Across the state this was one of the top five warmest July months on record. It was the top warmest July on record for Daytona Beach, Fort Lauderdale, Melbourne, Orlando, Tampa and West Palm Beach. Multiple warm maximum and minimum temperature records were tied or broken (Appendix 2).
Table 1: July average temperatures and departures from normal (˚F) for selected cities.
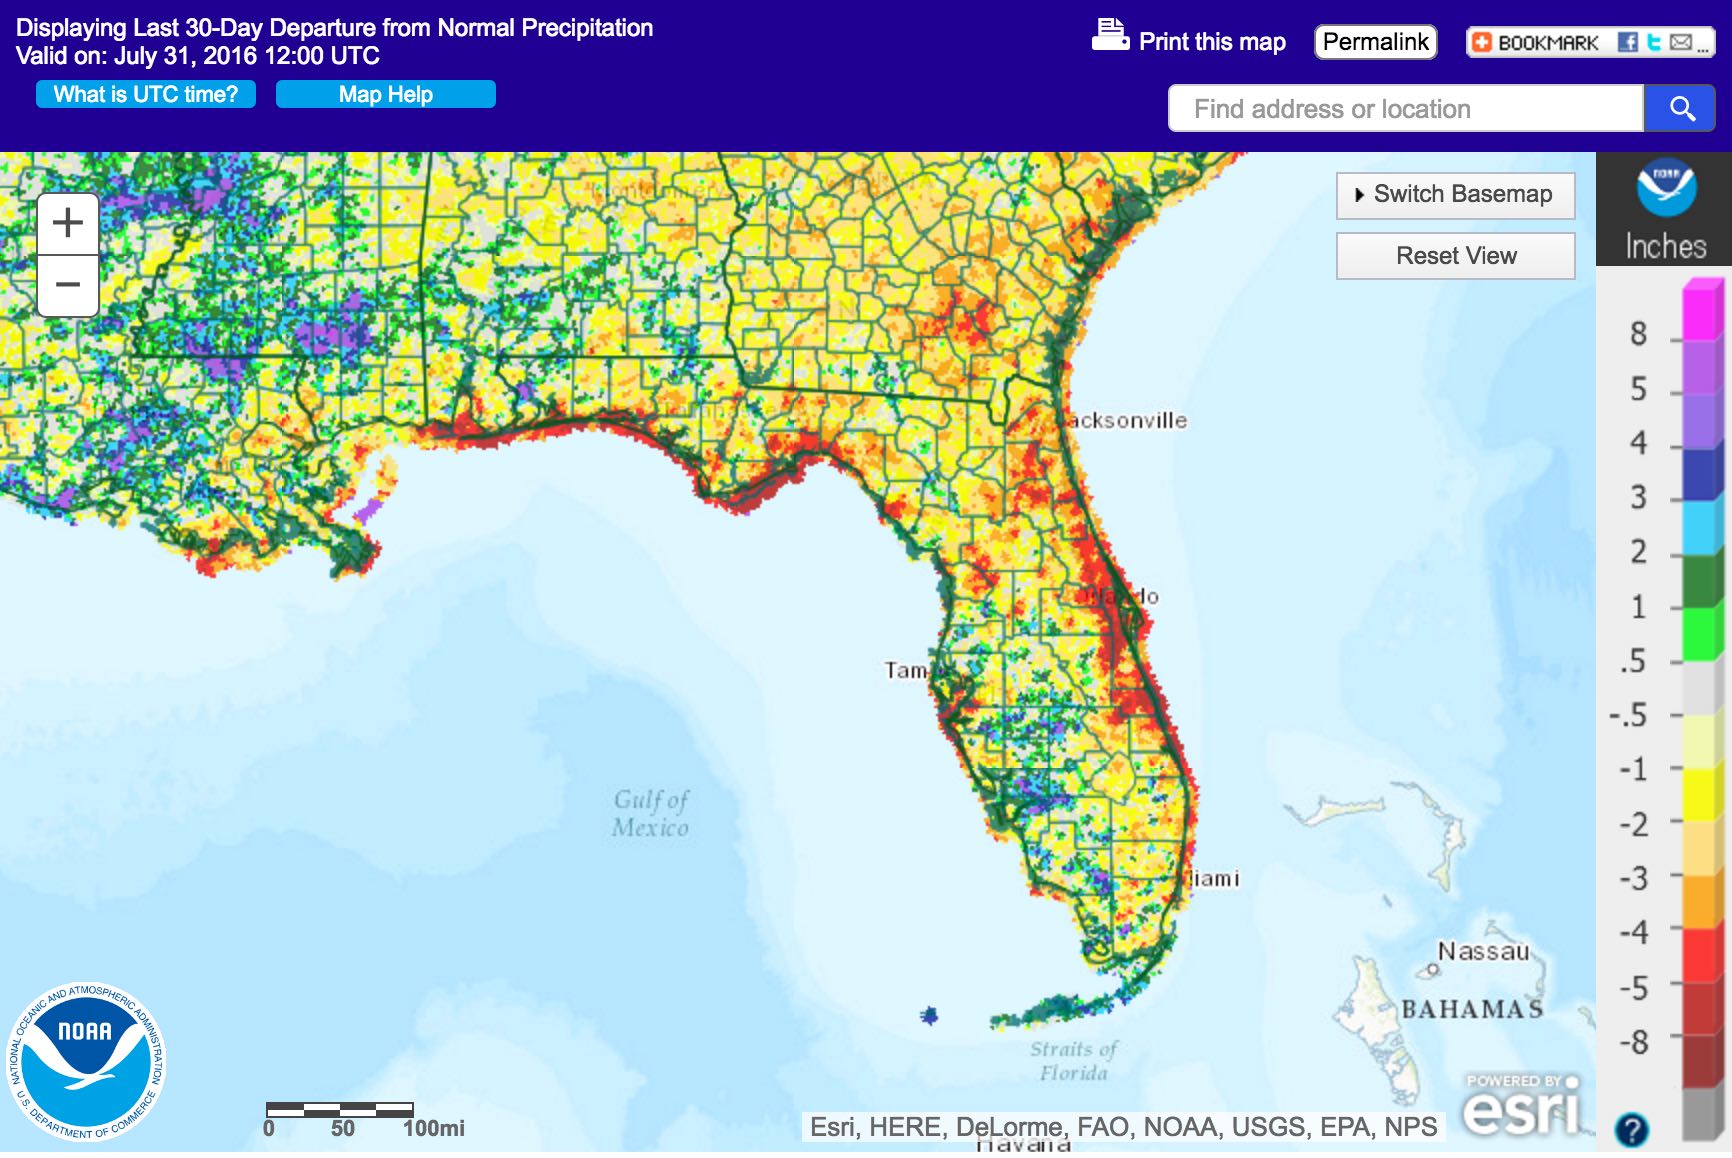
Rainfall totals in July were below normal for most of the state. Most of the state had below normal rainfall (Figure 1). Major reporting stations registered departures from normal ranging from -4.87’’ in Melbourne to +0.76” in Tallahassee (Table 2 and Appendix 1), although localized parts of the state saw rainfall totals that were more than 5” below normal to 5” above normal (Figure 1). This was one of the top five driest July months on record for most of the state’s Atlantic coast from Jacksonville to West Palm beach. No 24-hour precipitation records were broken for the month.
Table 2: July precipitation totals and departures from normal (inches) for select cities.
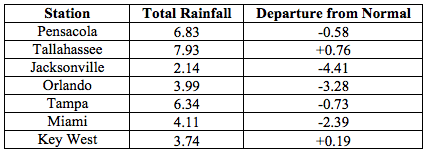
Figure 1: A graphical depiction of the monthly rainfall departure from normal (inches) for July (courtesy of NOAA, NWS).
Neutral ENSO Conditions are Present in the Pacific.
Based on current data and forecast models, the Climate Prediction Center (CPC) ENSO Alert System is at a La Niña Watch. ENSO neutral conditions are present, with sea surface temperature (SST) near or below average across most of the east-central and eastern equatorial Pacific Ocean. Development of La Nina is favored during August-October 2016, with a 55-60% chance of La Nina during the fall and winter of 2016/2017. CPC predicts high likelihood of above normal temperatures across the state for August 2016 through October 2016.
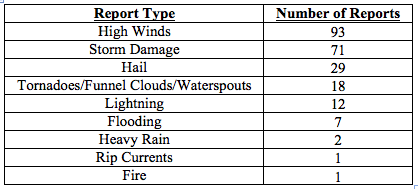
Hazardous Weather Events in July.
AThere were a total of 234 hazardous weather events reports submitted in Florida for the month of July (see Table 4 for a breakdown by event type). Numerous strong wind gusts associated with seasonal severe thunderstorms were reported throughout the state. Some thunderstorms produced up to half-inch sized hail. Reports of wind damage from severe thunderstorms were widespread from Tampa to Jacksonville, mainly entailing downed trees and powerlines. There were several instances of lightning strikes causing fires (Volusia, Santa Rosa, Palm Beach, St Johns, Pinellas Counties) or injuries (Alachua and Pinellas Counties), including a fatality in Lee County on July 25th. One person was hospitalized after nearly drowning in a rip current off the coast of St. Lucie County on July 23.
Table 4: Breakdown of storm reports submitted in Florida during the month of July (Compiled from Southeast Regional Climate Center.)
Agriculture-Related Impacts.
According to the USDA at the beginning of July, topsoil moisture levels were at mainly (60%) adequate, though some (15%) surplus values and short (19%) values were reported across the state. Not much change in these levels was seen as of the latest report for the week ending on July 24. Early in the month there were reports of some flooding in low-lying pastures in the southwestern portion of the state. As the month progressed, warm temperatures and small amounts of rainfall have left many pastures across the state somewhat dry and in need of moisture. Overall, pasture and cattle conditions across the state are mostly good, although some stress to livestock due to high temperatures has been reported in some areas. The citrus-producing area started the month drought-free with abnormally dry conditions creeping in towards the end of the month. Temperatures have been above average on most days, and rainfall has been below average for the season but canals and ditches are still at acceptable levels. Most citrus growers have been irrigating several times a week. Fruit and vegetable growers have increased irrigation because of hot and dry weather. Some hail damage to vegetable farms was reported in Okaloosa County early in the month. Dry conditions have helped hay harvesting in Bradford, Dixie, Flagler, Putnam, Taylor and Walton counties. Corn and tobacco harvests are also underway. Sugarcane fields are reporting low moisture levels. Sugarcane in Palm Beach County is sufficiently irrigated with water from Lake Okeechobee.
Drought-Related Impacts.
At the beginning of July, according to the US Drought Monitor, Florida was entirely drought free. Mid-month, abnormally dry (D0) conditions crept in the northeastern portion of the state (Madison, Hamilton, Suwannee, Columbia, Baker Counties). As rain deficits accumulated, drought conditions towards the end of the month extended south along the Atlantic Coast into Nassau, Duval, St Johns, Flagler, Volusia, Seminole, Orange, Osceola, Brevard, Indian River, and St Lucie Counties. As of July 26th, approximately 88% of the state is drought-free, and the remaining approximately 12% is experiencing abnormally dry conditions. Water levels in lake Okeechobee remain above average for the season, at 14.63 feet.
Appendix 1: Additional July departures from normal data for Florida locations.
Appendix 2: Select daily maximum and minimum temperature records (° F) broken during July (compiled from NOAA, NWS).
Prepared by Lydia Stefanova and David F. Zierden.
Florida Climate Center
The Florida State University
Tallahassee, FL
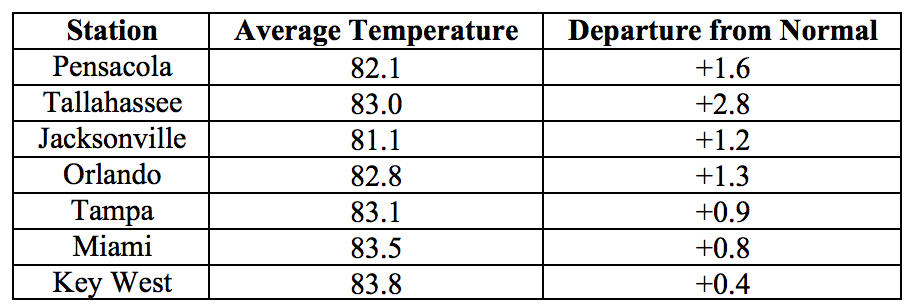
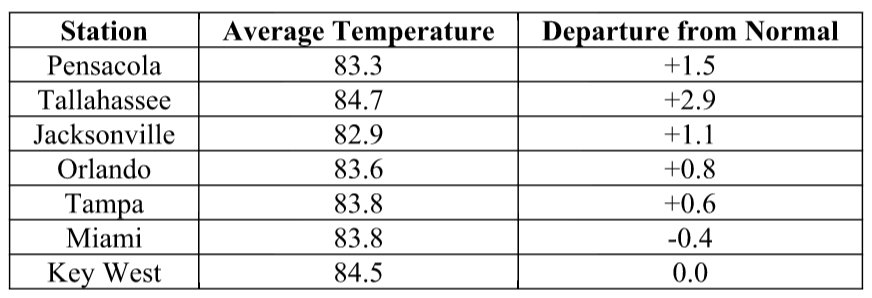
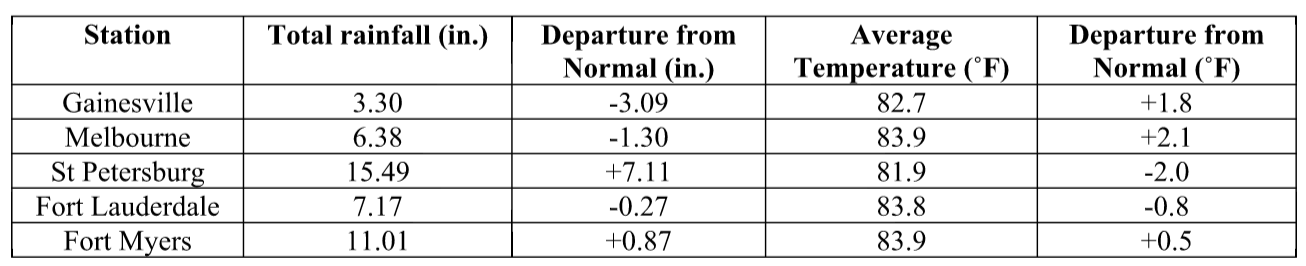
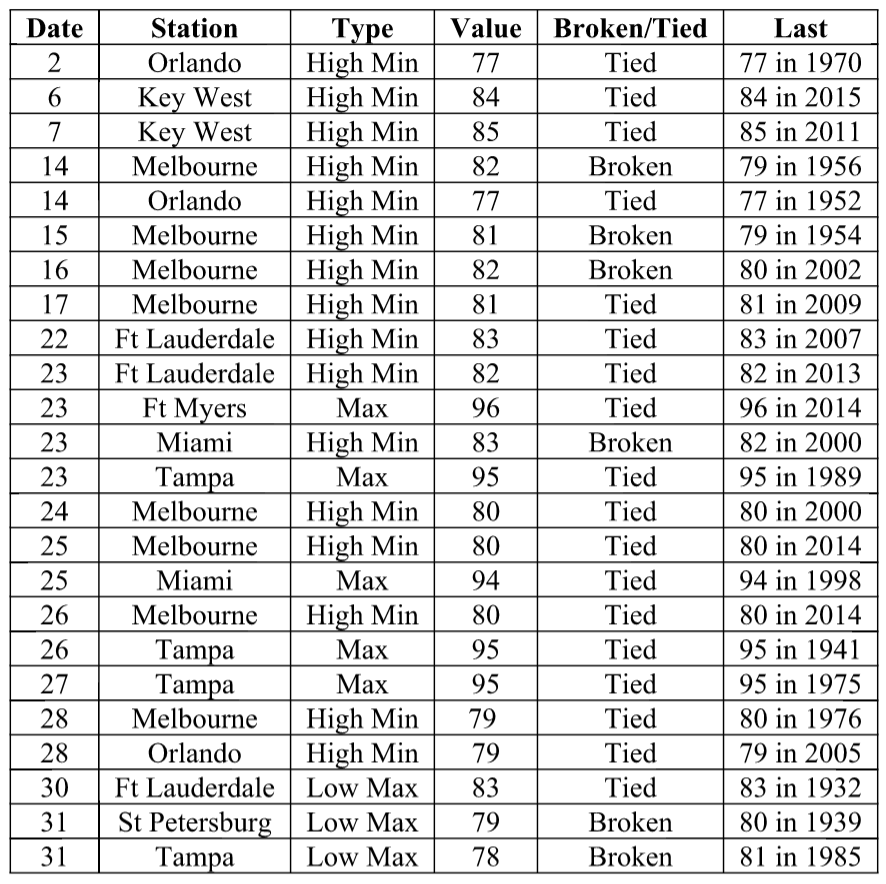
Average temperatures for August in Florida were mostly above normal. The average temperatures in August 2016 were above normal for most of the state, although some below-normal average monthly temperatures were also recorded. Average temperatures departure from normal ranged from -2.0˚F in St. Petersburg to +2.9˚F in Tallahassee (Table 1 and Appendix 1). August 2016 was the warmest on record in West Palm Beach, 2nd warmest for Daytona Beach, 3rd warmest in Tallahassee, 5th warmest for Vero Beach, 10th warmest for Tampa, yet also 10th coldest for St. Petersburg. Multiple maximum and minimum temperature records were tied or broken across the state in August (Appendix 2).
Table 1: August average temperatures and departures from normal (˚F) for selected cities.
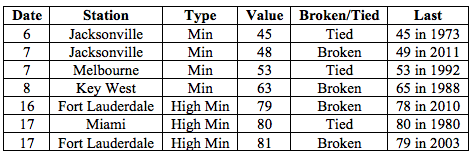
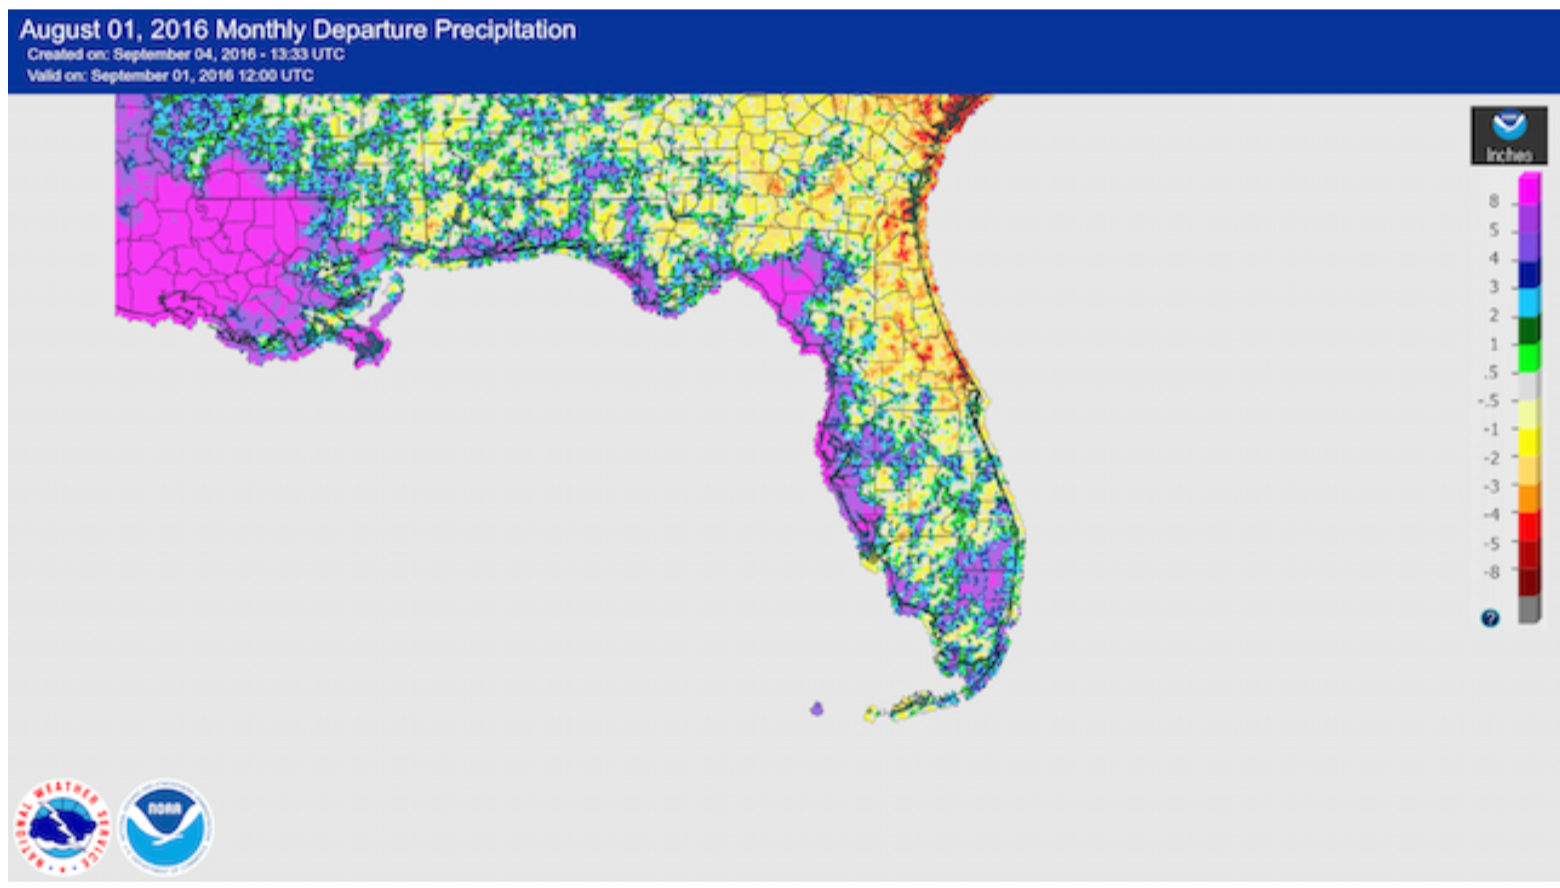
Rainfall totals in August were varied across the state. Rainfall totals were above normal along much of the Gulf Coast and parts of Central and South Florida, and below normal for most of the northeastern portion of the state (Figure 1). Major reporting stations registered departures from normal ranging from -4.15” in Jacksonville to +7.11” in St Petersburg (Table 2 and Appendix 1), although localized parts of the state saw rainfall totals that were as much as 5” below normal to over 8” above normal (Figure 1). August 2016 was the wettest on record in Tampa and Ocala, and 3rd wettest in St Petersburg. Several 24-hour precipitation records were broken for the month (Table 3), some stemming from precipitation associated with the approach of the tropical system that eventually became Hurricane Hermine at the end of the month.
Table 2: August precipitation totals and departures from normal (inches) for select cities.
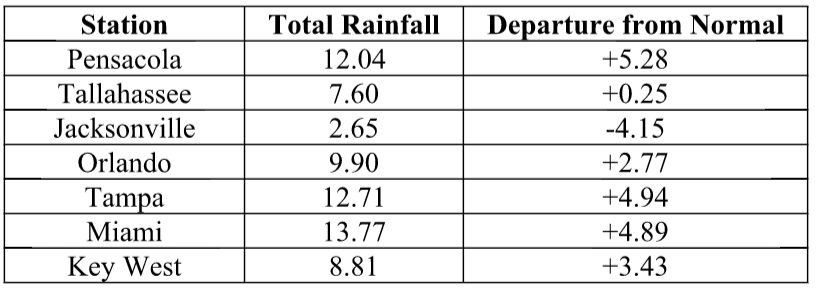
Table 3: Select daily rainfall records (inches) broken during August (compiled from NOAA, NWS).
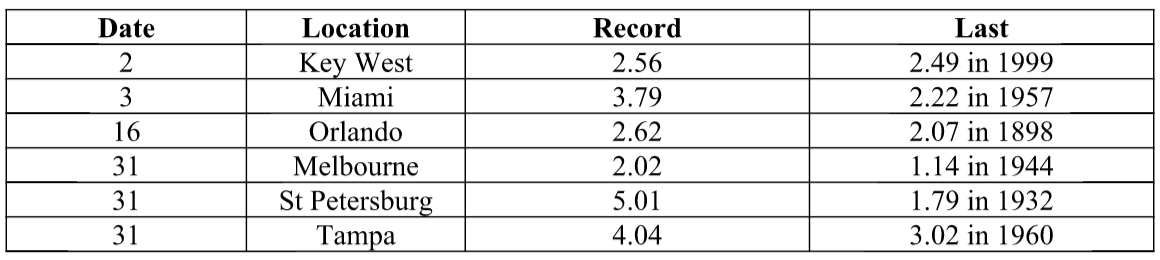
Figure 1: A graphical depiction of the monthly rainfall departure from normal (inches) for August is given in the figure below (courtesy of NOAA, NWS).
ENSO-Neutral Conditions are Present in the Pacific.
Based on current data and forecast models, the Climate Prediction Center (CPC) ENSO Alert System status is set to La Niña Watch. Equatorial sea surface temperatures (SST) anomalies in the east-central and eastern Pacific Ocean are near or below average. There is approximately a 55-60% chance for La Niña conditions during the fall and winter 2016-2017. CPC’s outlook suggests an increased likelihood of warmer than normal temperatures for Florida for September through November 2016.
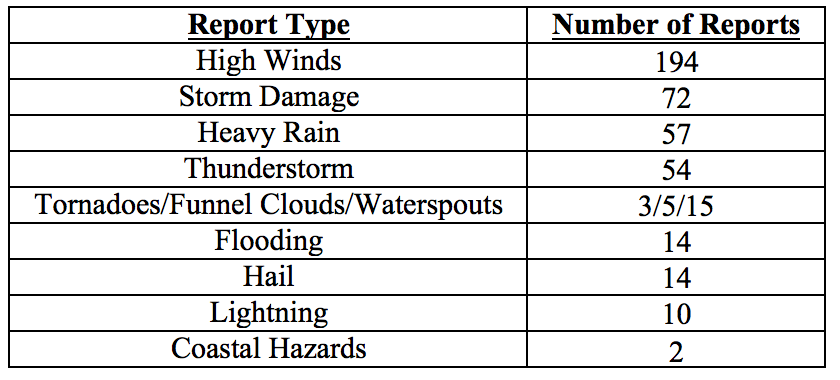
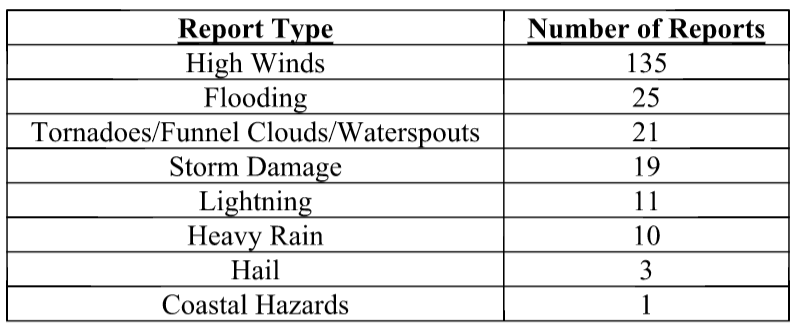
Hazardous Weather Events in August.
There were a total of 225 severe weather reports made in Florida during February. The bulk of these (208) were the result of just two cold front A total of 225 hazardous weather events were logged for August in Florida by the Southeast Regional Climate Center (see Table 4 for a breakdown by event type). The majority of reports were related to high winds. Of these, about half were related to the tropical system that eventually became hurricane Hermine by August 31. Localized thunderstorms and some instances of storm damage were reported at various locations throughout the month. Heavy rains and tidal flooding were an issue for residents from Sarasota to St. Petersburg on the 30th-31st. Earlier in the month, on the 4th, an EF-1 tornado with winds up to 100mph touched down in Nassau County on the 4th, causing damage to trees, power lines and homes, and overturning several vehicles. Multiple waterspouts were reported throughout the Florida Keys. Several lightning injuries were reported throughout the state on various dates, including two in Broward County on the 4th, one in Daytona Beach on the 14th, and in Orlando on the 16th; there were also two fatalities resulting from lightning strikes, in Okaloosa Island on the 5th and Sarasota on the 26th.
Table 4: Breakdown of storm reports submitted in Florida during the month of August (Compiled from Southeast Regional Climate Center.)
Agriculture Related Impacts.
Soil moisture conditions throughout the state have been mostly reported as adequate throughout the month, although some portions of the state (about 15-20%) are reporting short and a similar percentage are reporting surplus values. For most of the month the citrus growing counties were experiencing above normal temperatures and below normal rainfall, with some parts affected by abnormally dry conditions as defined by the US Drought Monitor. Most groves have required daily irrigation, and growers have been spraying against greening disease. Land preparation for fall fruit and vegetable planting is ongoing. Pastures and cattle have been in mostly good conditions, although pasture quality is beginning to seasonally decline as grasses mature. Some areas that have received large amounts of rainfall report standing water in pastures. Corn harvesting has been ongoing in the Panhandle. Cotton and soybeans were mostly in good condition although some farmers were reporting problems with fungus and insects. Peanut harvesting has begun in Lafayette and Gilchrist Counties, and anticipated to begin soon in Dixie, Levy, and Suwannee Counties. Sugarcane in Glades, Hendry, Lee and Palm Beach Counties is in good condition.
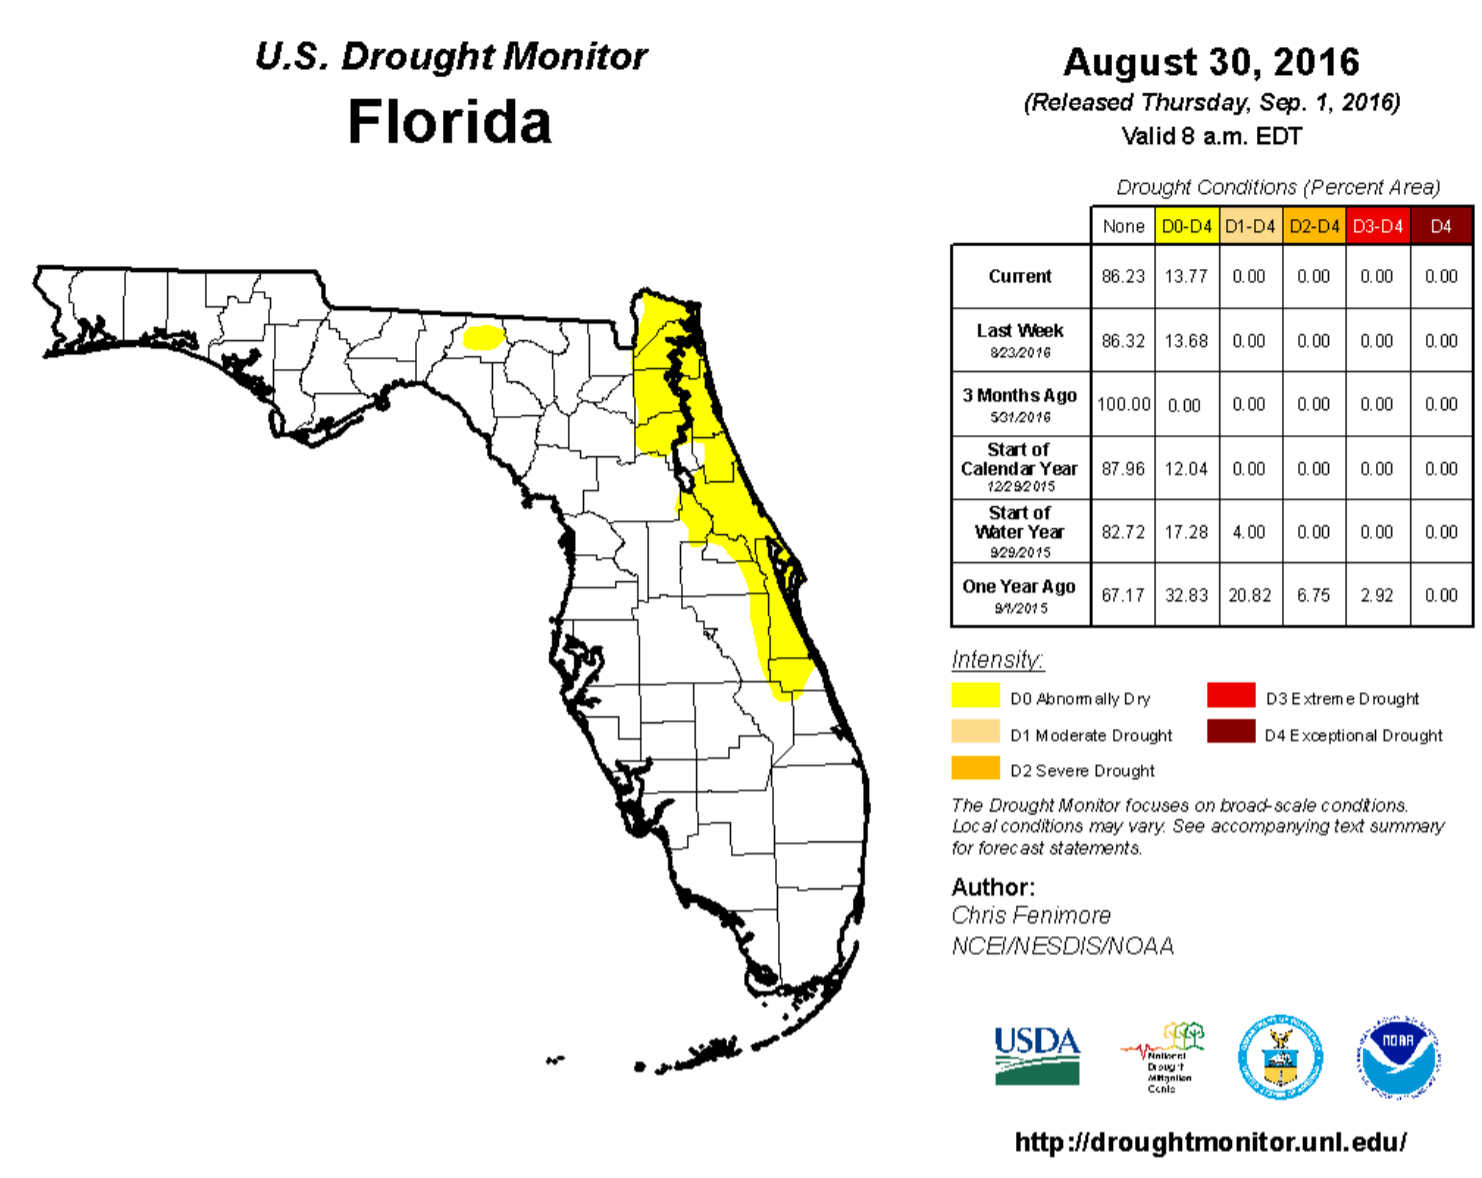
Drought Related Impacts.
At the beginning of August, most (83%) of the state was drought-free, while roughly 17% of the state (mainly northeastern Panhandle counties and along the Atlantic Coast) was experiencing abnormally dry (D0) conditions. Rainfall by the second week of the month lifted D0 conditions from Dade to St. Lucie Counties and most of the Panhandle. As the month progressed, new D0 conditions started creeping into the northeastern corner of the state (Clay, Duval, Flagler, Nassau, Putnam, and St. Johns Counties). As of the latest US Drought Monitor update (August 30th), approximately 86% of Florida was drought free, and 14% was affected by D0 conditions. Lake Okeechobee water levels at the end of the month were at 14.73 feet, which is above average for this time of the year.
Appendix 1: Additional August departures from normal data for Florida locations.
Appendix 2: Select daily maximum and minimum temperature records (° F) broken during August (compiled from NOAA, NWS).
Building A, Suite 292
Tallahassee, FL 32306-2741
Phone: (850) 644-3417 | (850) 644-0719
climate@coaps.fsu.edu