


The Florida Climate Center serves as the primary resource for climate data, information, and services in the state of Florida.

The Florida Climate Center achieves its mission by providing climate monitoring, research, and expertise to be applied by the people, institutions, and businesses of Florida and the surrounding region.
We provide direct service by fulfilling requests for climate and weather data and information in a variety of formats.
We perform research that advances the understanding of the climate variability and changes of Florida and the surrounding region.
We provide outreach in presentations and at events aimed at a variety of groups, interests, and ages.
Prepared by Florida Climate Center
The Florida State University
Tallahassee, FL

Average temperatures in October 2020 were above average across the state. Departures from normal averaged 2 to 5 ̊F above normal, ranging from +2.0 ̊F in Miami to over +5 ̊F in Tallahassee and Tampa (Table 1). Tampa observed its warmest October on record while Orlando had its second warmest October on record. Average minimum temperatures were well above average for the month throughout the state, ranging from +2 ̊F in Fort Lauderdale to +8 ̊F and +9 ̊F in Tallahassee and Perry, respectively. Several locations set record high average minimum temperatures, including Perry, Tampa, Perrine, and Punta Gorda. Average maximum temperatures were also above normal across most of the state. Many daily record high maximum temperatures were set (see additional departures and records in the appendices).
Table 1. October average temperatures and departures from normal ( ̊F) for selected cities.
| Station | Mean Temperature | Departure from Normal |
| Pensacola | 73.8 | +4.2 |
| Tallahassee | 74.5 | +5.1 |
| Jacksonville | 74.6 | +3.7 |
| Orlando | 79.6 | +4.6 |
| Tampa | 81.5 | +5.4 |
| Miami | 82.2 | +2.0 |
| Key West | 82.7 | +1.4 |
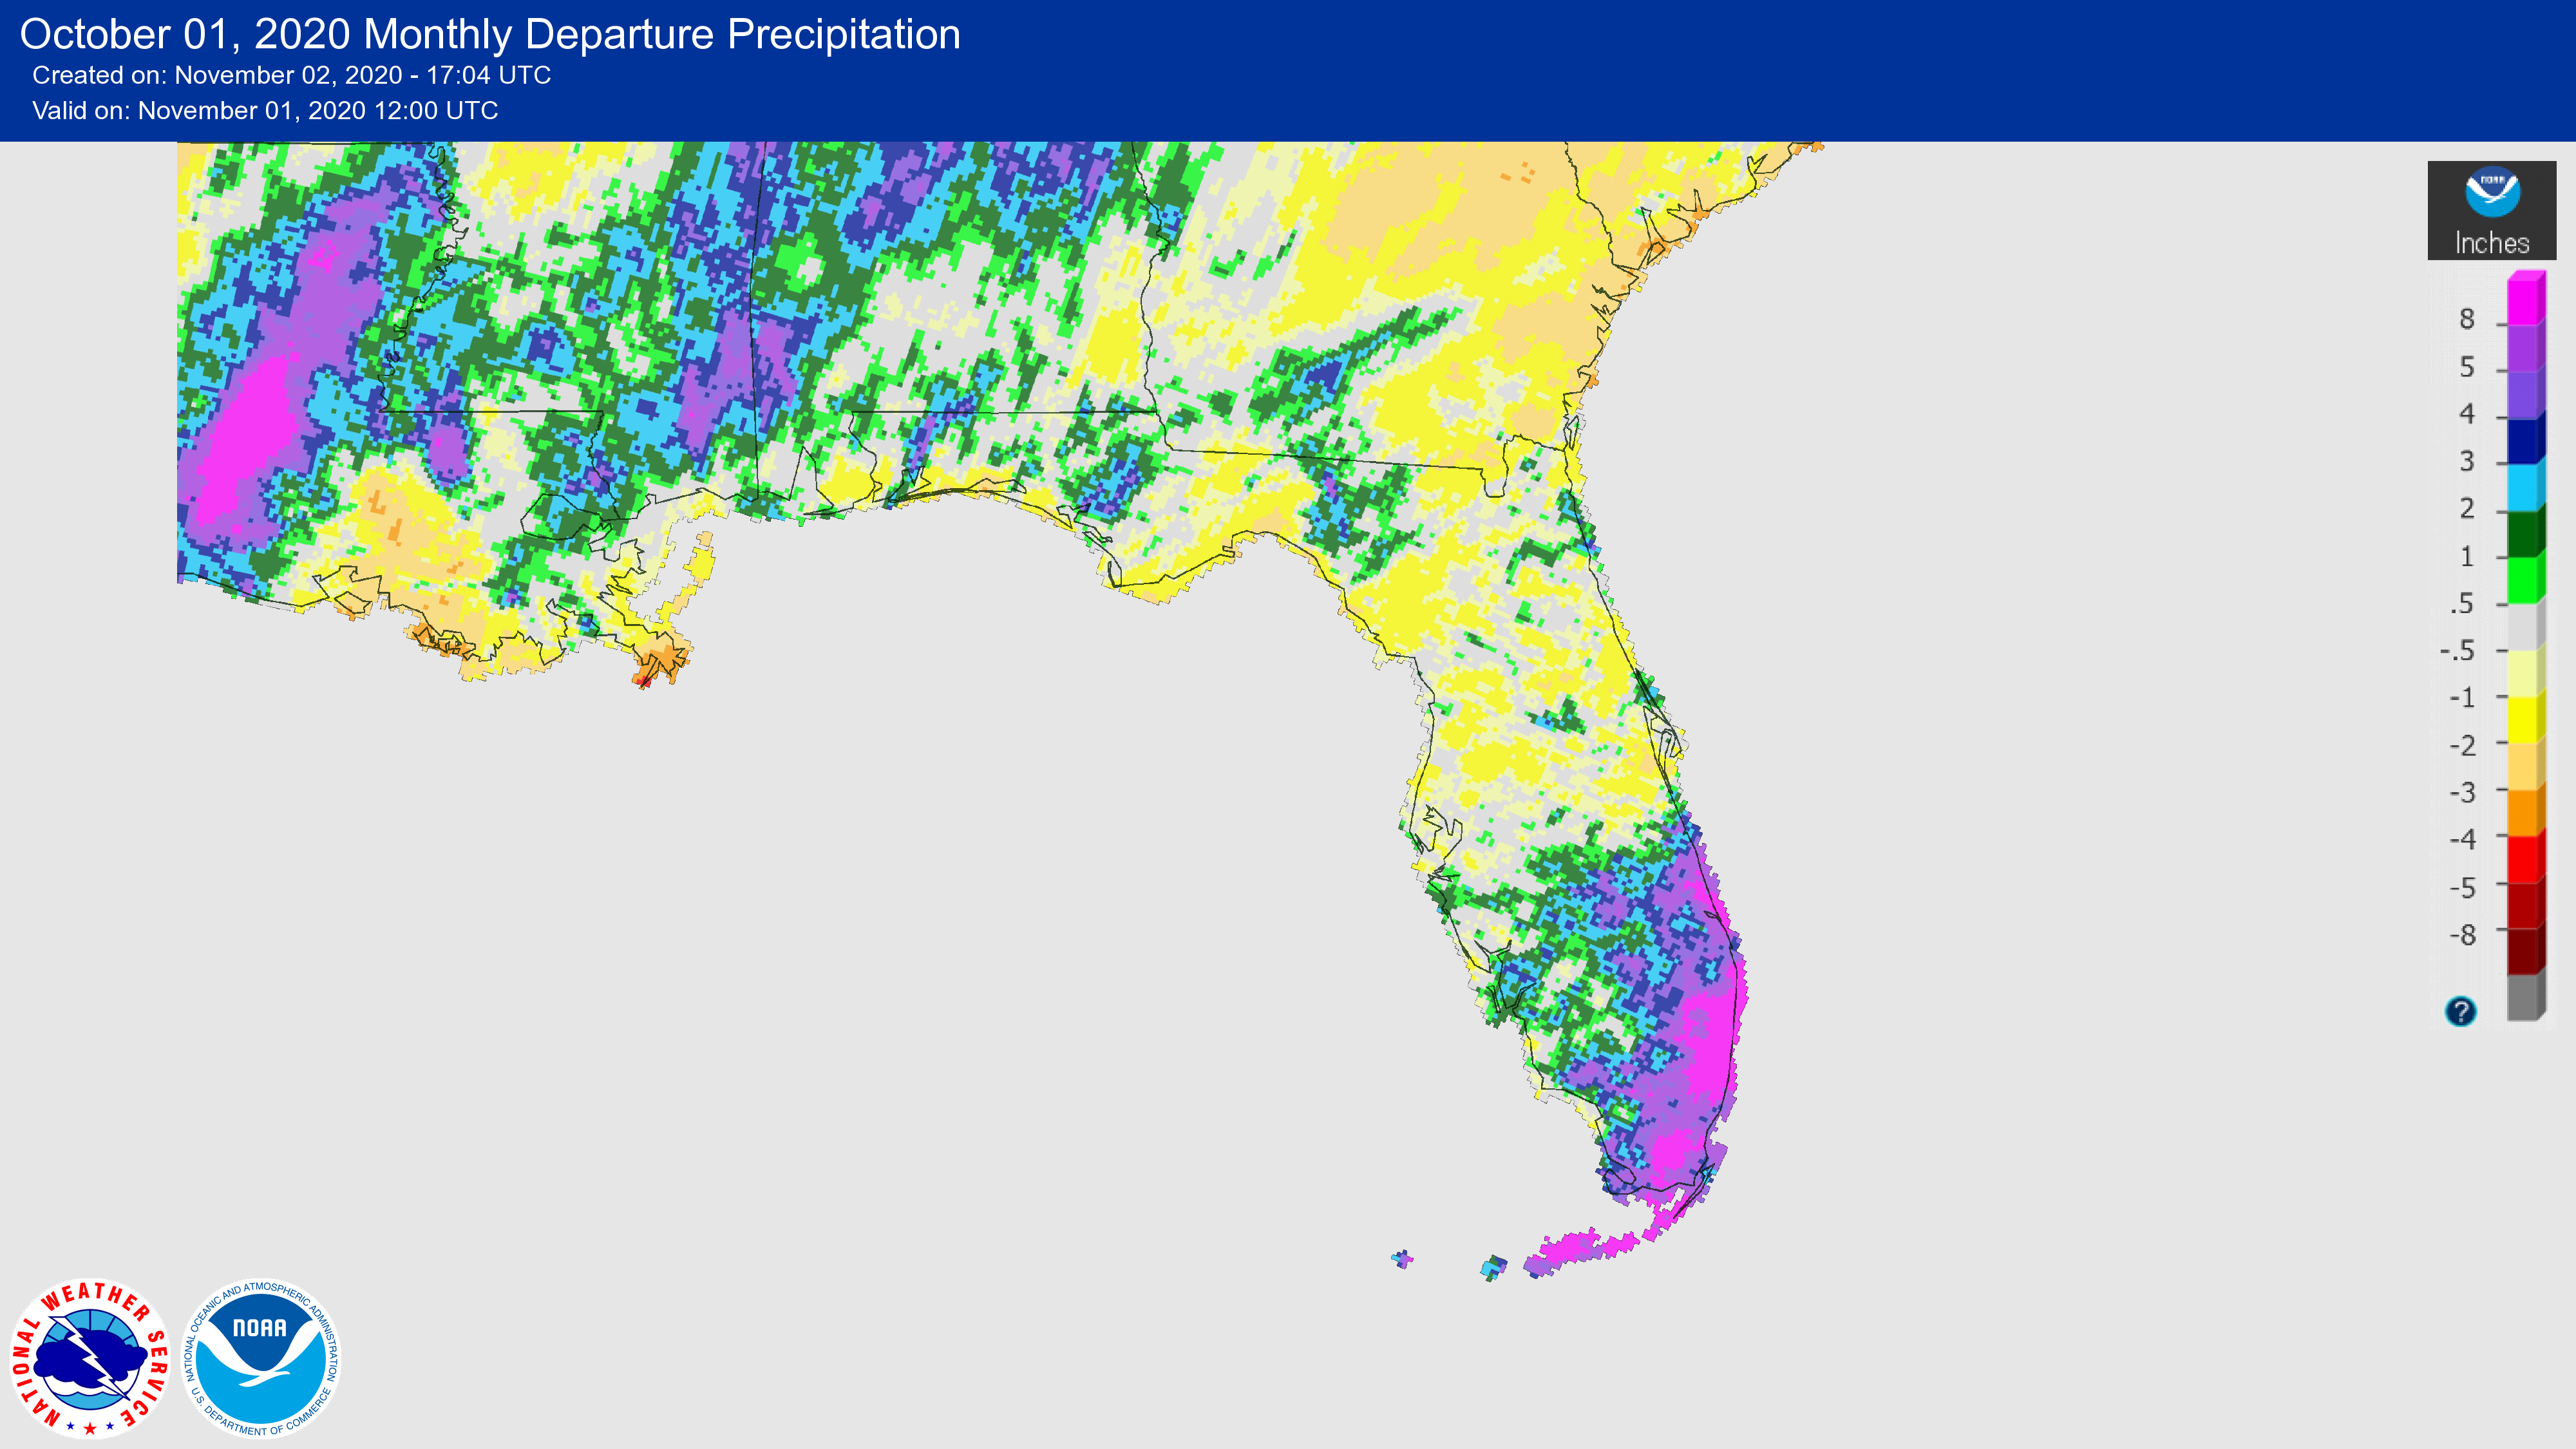
Rainfall totals in October were below normal across northern and central parts of the state and above normal in the southern peninsula (Table 2 and Figure 1). Perrine and Fort Lauderdale experienced their second wettest October on record, at +8.5 and +7.4 inches above normal for the month, respectively.
Table 2. October precipitation totals and departures from normal (inches) for selected cities.
| Station | Total Rainfall | Departure from Normal |
| Pensacola | 5.00 | -0.24 |
| Tallahassee | 2.01 | -1.22 |
| Jacksonville | 3.49 | -0.92 |
| Orlando | 2.01 | -1.22 |
| Tampa | 1.84 | -0.42 |
| Miami | 11.86 | +5.53 |
| Key West | 7.78 | +2.84 |
Figure 1. A graphical depiction of the monthly rainfall departure from normal (inches) for October 2020 (courtesy of NOAA, NWS).
La Niña Conditions Persist in the Pacific.
Strong La Niña is forecast for the rest of the fall, as the threshold for what is considered a strong La Niña has been crossed. There is a more than 90% chance of La Niña continuing through winter and a strong chance (approximately 60%) it will continue into the spring (February-April). La Niña conditions emerged in August with sea surface temperatures (SST) dipping below average across the central and eastern equatorial Pacific Ocean. La Niña is expected to affect temperatures and precipitation during the upcoming months, with above-average temperatures and dry conditions across the southern tier of the U.S.
Hazardous Weather Events in October.
There were 340 local reports of hazardous weather events recorded in Florida during the month of October (see Table 4 for a breakdown by event type). The active hurricane season in the Atlantic continued in October. Hurricane Zeta impacted the Gulf Coast late in the month of October, making landfall over southeast Louisiana on Wednesday the 28th and then moving northeast across southern Mississippi and Alabama. While there were some reports of wind gusts, Florida was spared from the worst impacts of Zeta.
Table 4. Breakdown of storm reports submitted in Florida during the month of October (compiled from Iowa State University/Iowa Environmental Mesonet).
| Report Type | Number of Reports |
| Coastal Flood | 21 |
| Flash Flood | 6 |
| Flood | 37 |
| Heavy Rain | 93 |
| Marine Thunderstorm Wind | 91 |
| Non-Thunderstorm Wind Damage | 0 |
| Non-Thunderstorm Wind Gust | 33 |
| Tornados/Waterspouts/Funnel Clouds | 0/8/1 |
| Thunderstorm Wind Damage | 0 |
| Thunderstorm Wind Gust | 19 |
| Lightning | 1 |
| High Tide | 7 |
| Rip Current | 3 | Tropical Storm | 20 |
Drought-Related Impacts.
During the month of October, drought did not impact any part of the state, according to the U.S. Drought Monitor. Drought-free conditions are expected to remain in the short term but continuing La Niña conditions are expected to lead to the onset of a dry winter pattern.
As of October 31, the Lake Okeechobee water level was at 16.26 ft. above sea level (Feet-NGVD29), which is above average for this time of the year. At the beginning of October, the water level was at 15.56 ft. above sea level.

Agriculture-Related Impacts.
By mid-October, topsoil moisture levels were adequate in 64% of the state, short in 14%, very short in 1%, and 21% of the state was in surplus. By the end of October, topsoil moisture levels were adequate in 67% of the state, short in 5%, very short in 1%, and 27% of the state had a surplus. For more information, consult the weekly Crop Progress and Condition reports published by the USDA’s National Agricultural Statistics Service.
Appendix 1
Additional October departures from normal data for Florida locations (Source: NWS).
| Station | Average Temperature (˚F) | Departure from Normal (˚F) | Total Rainfall (in.) | Departure from Normal (in.) |
| Gainesville | 75.2 | +4.4 | 1.74 | -1.14 |
| Sarasota | 81.2 | +4.9 | 3.76 | +0.64 |
| Melbourne | 79.4 | +3.4 | 4.89 | -0.17 |
| Fort Myers | 81.4 | +4.4 | 4.05 | +1.17 |
Appendix 2
Select daily maximum temperature records tied or broken during October (compiled from NOAA).
| Location | Date | Record (˚F) | Broken/Tied | Last |
| Key West | 1 | 92 | Broken | 91 in 2018 |
| Key West | 4 | 91 | Broken | 90 in 2018 |
| Key West | 5 | 92 | Broken | 91 in 2018 |
| Tampa | 6 | 94 | Broken | 93 in 2017 |
| Punta Gorda | 7 | 95 | Broken | 93 in 2018 |
| Orlando | 7 | 93 | Tied | 93 in 2009 |
| Tampa | 8 | 95 | Broken | 92 in 1990 |
| Key West | 9 | 92 | Tied | 93 in 2009 |
| Jacksonville | 12 | 90 | Broken | 89 in 2018 |
| Miami | 12 | 92 | Broken | 91 in 2011 |
| Fort Lauderdale | 13 | 93 | Broken | 92 in 2008 |
| Pensacola | 13 | 90 | Tied | 90 in 2017 |
| Fort Lauderdale | 14 | 93 | Broken | 92 in 2003 |
| Tampa | 15 | 93 | Broken | 92 in 2018 |
| Tampa | 19 | 90 | Broken | 89 in 2018 |
| Tarpon Springs | 26 | 90 | Tied | 90 in 2010 |
| Tampa | 26 | 92 | Broken | 90 in 1939 |
| Kissimmee | 27 | 91 | Broken | 90 in 2019 |
| Tampa | 27 | 92 | Broken | 89 in 2010 |
| Key West | 27 | 90 | Broken | 89 in 2019 |
| Key West | 28 | 91 | Broken | 90 in 2019 |
| Jacksonville Beach | 29 | 90 | Broken | 88 in 2019 |
| Vero Beach | 29 | 90 | Broken | 88 in 2019 |
| Jacksonville | 29 | 90 | Broken | 87 in 2019 |
| Daytona Beach | 30 | 90 | Broken | 88 in 2014 |
Prepared by Florida Climate Center
The Florida State University
Tallahassee, FL
Average temperatures in August were near or above normal. Departures from normal ranged from +0.3 ̊F in Jacksonville to +1.9 ̊F in Key West (Table 1). Sarasota observed its warmest August on record, as well as Miami, which tied with 2017 as the warmest month on record. Key West and Fort Myers had their 2nd warmest August, and Tampa observed its 4th warmest August on record (additional departures are provided in the appendix).
Table 1. August average temperatures and departures from normal ( ̊F) for selected cities.
| Station | Mean Temperature | Departure from Normal |
| Pensacola | 83.2 | +1.4 |
| Tallahassee | 82.6 | +0.4 |
| Jacksonville | 82.2 | +0.3 |
| Orlando | 83.8 | +1.3 |
| Tampa | 84.8 | +1.4 |
| Miami | 85.7 | +1.7 |
| Key West | 87.2 | +1.9 |
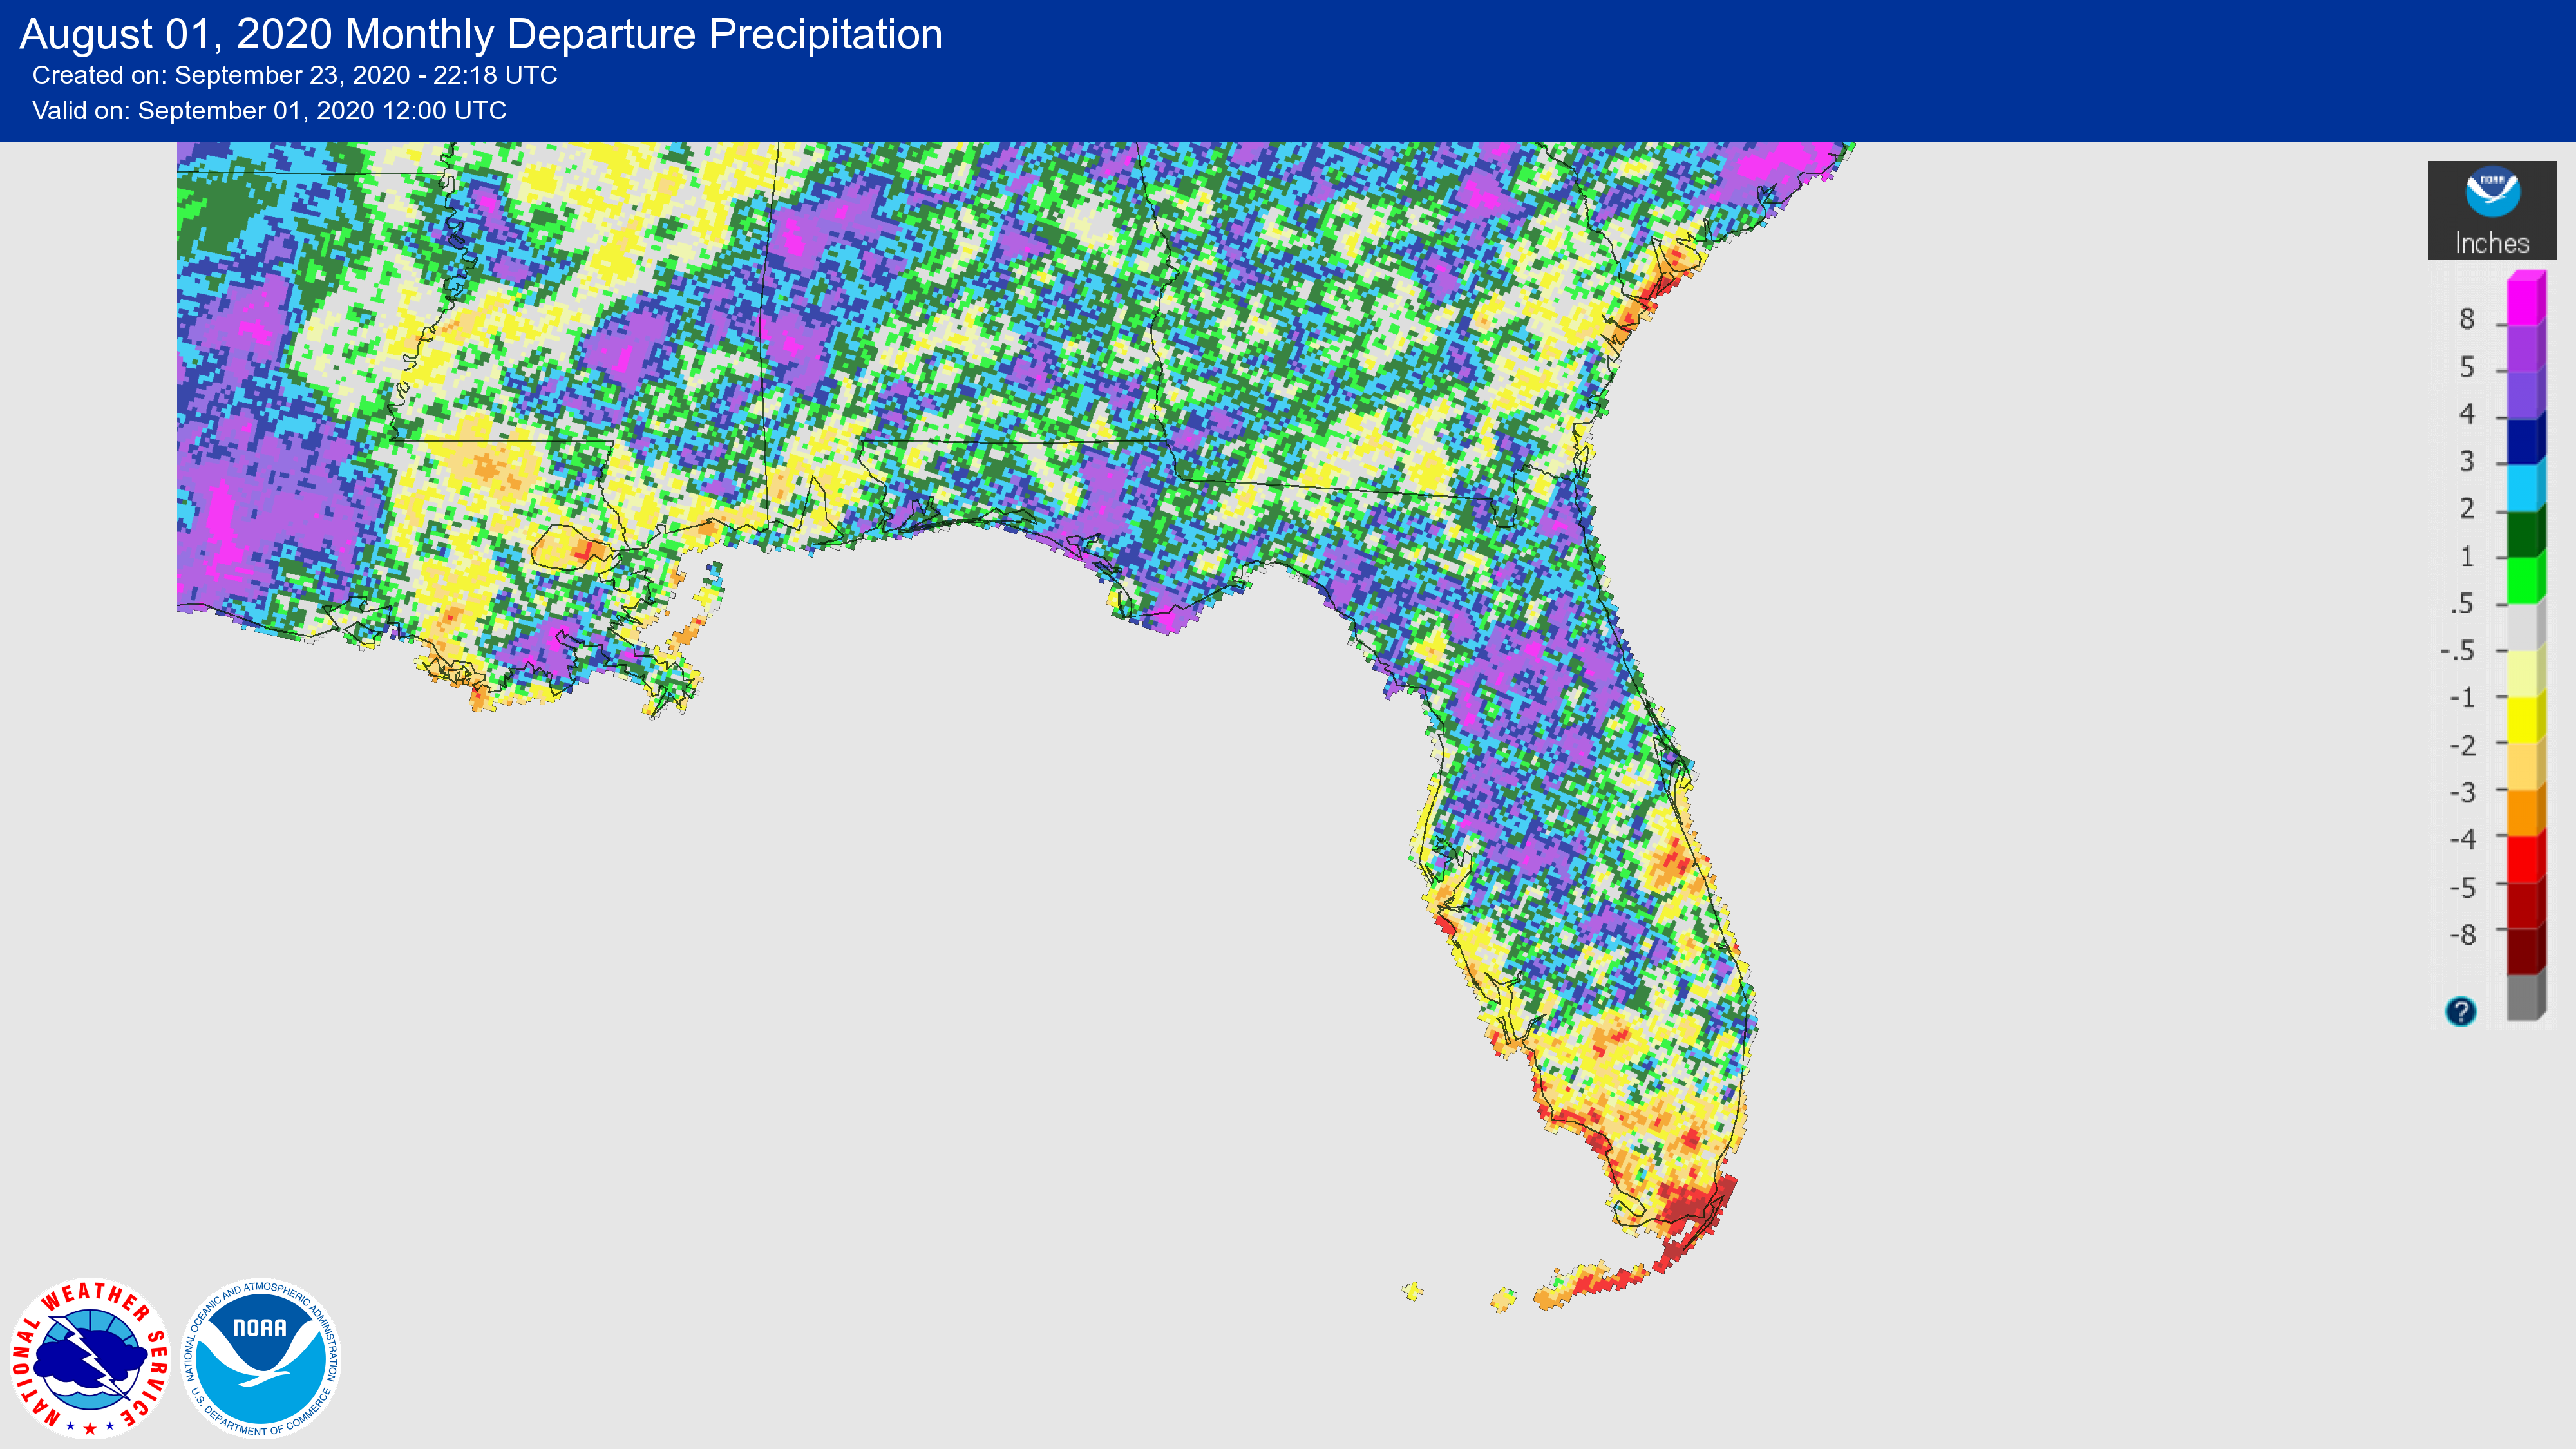
Rainfall totals in August were above normal across much of the state, including the western panhandle, north Florida, and parts of central Florida. However, much of central and south Florida were drier with below normal rainfall despite tropical cyclone activity during the month (Figure 1). Apalachicola experienced its 6th wettest August on record, while in South Florida August 2020 was the 5th driest on record for Perrine and the 9th driest on record for Key West. Departures from normal generally ranged from +6.45” in Pensacola to -4.47” in Sarasota, though some locations were wetter and drier (Table 2 and Appendix 1).
Table 2. August precipitation totals and departures from normal (inches) for selected cities.
| Station | Total Rainfall | Departure from Normal |
| Pensacola | 13.21 | +6.45 |
| Tallahassee | 8.52 | +1.17 |
| Jacksonville | 10.42 | +3.62 |
| Orlando | 7.42 | +0.29 |
| Tampa | 10.2 | +2.43 |
| Miami | 7.44 | -1.44 |
| Key West | 2.61 | -2.77 |
Figure 1. A graphical depiction of the monthly rainfall departure from normal (inches) for August 2020 (courtesy of NOAA, NWS).
La Niña conditions are present in the Pacific.
During August, the Climate Prediction Center issued a La Niña Advisory, as La Niña conditions emerged during August with sea surface temperatures (SST) below average across the central and eastern equatorial Pacific Ocean. These conditions are likely to continue through the Northern Hemisphere 2020-21 winter season (approximately 80% chance). La Niña winters tend to favor warm and dry conditions in the southern tier of the U.S.
Hazardous Weather Events in August.
According to the Local Storm Reports issued by the local National Weather Service (NWS) offices serving Florida, there were 490 reports of hazardous weather events in Florida during the month of August (see table 4 for a breakdown by event type). Nearly half of these reports came during days coinciding with tropical cyclone activity. Hurricane Isaias made landfall on August 1st on North Andros, Bahamas, and then traveled north, paralleling the east coast of Florida before continuing up the East Coast of the United States. The storm’s outer rainbands impacted the east coast of the Florida Peninsula causing heavy rainfall, flooding, and wind gusts. Later in the month, Hurricane Laura impacted the Florida Keys and South Florida with wind gusts and heavy rain before moving across the Gulf of Mexico and making landfall on August 27th in Cameron, Louisiana as a category 4 hurricane.
Table 4. Breakdown of storm reports submitted in Florida during the month of August. (Compiled from Iowa State University/Iowa Environmental Mesonet.)
| Report Type | Number of Reports |
| Coastal Flood | 3 |
| Flash Flood | 12 |
| Flood | 10 |
| Hail | 45 |
| Heavy Rain | 54 |
| Marine Thunderstorm Wind | 61 |
| Non-Thunderstorm Wind Damage | 1 |
| Non-Thunderstorm Wind Gust | 15 |
| Tornados/Waterspouts/Funnel Clouds | 5/23/3 |
| Thunderstorm Wind Damage | 69 |
| Thunderstorm Wind Gust | 184 |
| Lightning | 5 |
Drought-Related Impacts.
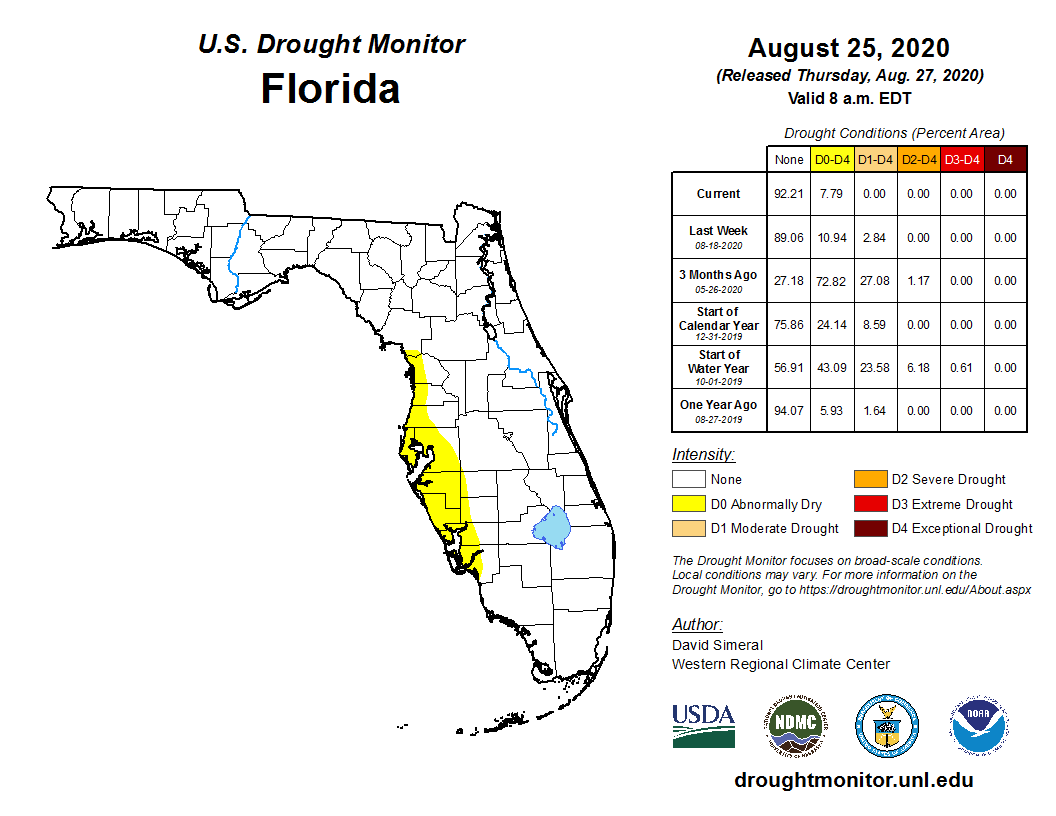
At the beginning of August, parts of west-central Florida had abnormally dry conditions, according to the U.S. Drought Monitor. By mid-month, moderate drought conditions developed in coastal regions of west-central Florida, but these gave way to abnormally dry conditions by the end of the month.
As of 18 September, the Lake Okeechobee water level was at 15.11 ft. above sea level (Feet-NGVD29), which is near but slightly above average for this time of the year.
Agriculture-Related Impacts.
At the beginning of August, soil moisture was adequate in 81% of the state, short in 9%, and 10% of the state had a surplus in soil moisture. By the end of the month, soil moisture was adequate in 80% of the state, short in 4%, very short in 1%, and 15% of the state had a surplus. For more information, consult the weekly Crop Progress and Condition reports published by the USDA’s National Agricultural Statistics Service.
Appendix 1
Additional August Departures from Normal Data for Florida Locations.
| Station | Average Temperature (˚F) | Departure from Normal (˚F) | Total Rainfall (in.) | Departure from Normal (in.) |
| Apalachicola | 82.8 | +1.1 | 16.50 | +8.28 |
| Gainesville | 81.7 | +0.8 | 7.00 | +0.61 |
| Sarasota | 85.2 | +3.0 | 4.67 | -4.47 |
| Melbourne | 83.3 | +1.5 | 4.58 | -3.1 |
| Fort Myers | 84.8 | +1.5 | 11.67 | +1.46 |
Prepared by Florida Climate Center
The Florida State University
Tallahassee, FL
Average temperatures in September 2020 were above average across most of the state. Departures from normal ranged from +0.3 ̊F in Tallahassee to +1.6 ̊F in Key West (Table 1). Stuart observed its warmest September on record and Plant City tied for its warmest September on record. Key West observed its second warmest September while Sarasota observed its third warmest September on record (additional departures are provided in the appendix). In addition, two record low high temperatures occurred in the Pensacola area, including a record low high of 77 ̊F on the 15th, which tied the previous record on this date set back in 1945, and a record low high of 69 ̊F on the 20th, which was well below the previous record of 76 ̊F set on this date back in 1929, according to the National Weather Service. Much of Florida experienced above average minimum temperatures throughout the month, with record high average minimum temperatures set in Miami, Perrine, and Plant City.
Table 1. September average temperatures and departures from normal ( ̊F) for selected cities.
| Station | Mean Temperature | Departure from Normal |
| Pensacola | 78.8 | +0.4 |
| Tallahassee | 79.0 | +0.3 |
| Jacksonville | 78.8 | +0.6 |
| Orlando | 82.0 | +1.3 |
| Tampa | 82.9 | +0.9 |
| Miami | 83.9 | +1.2 |
| Key West | 85.6 | +1.6 |
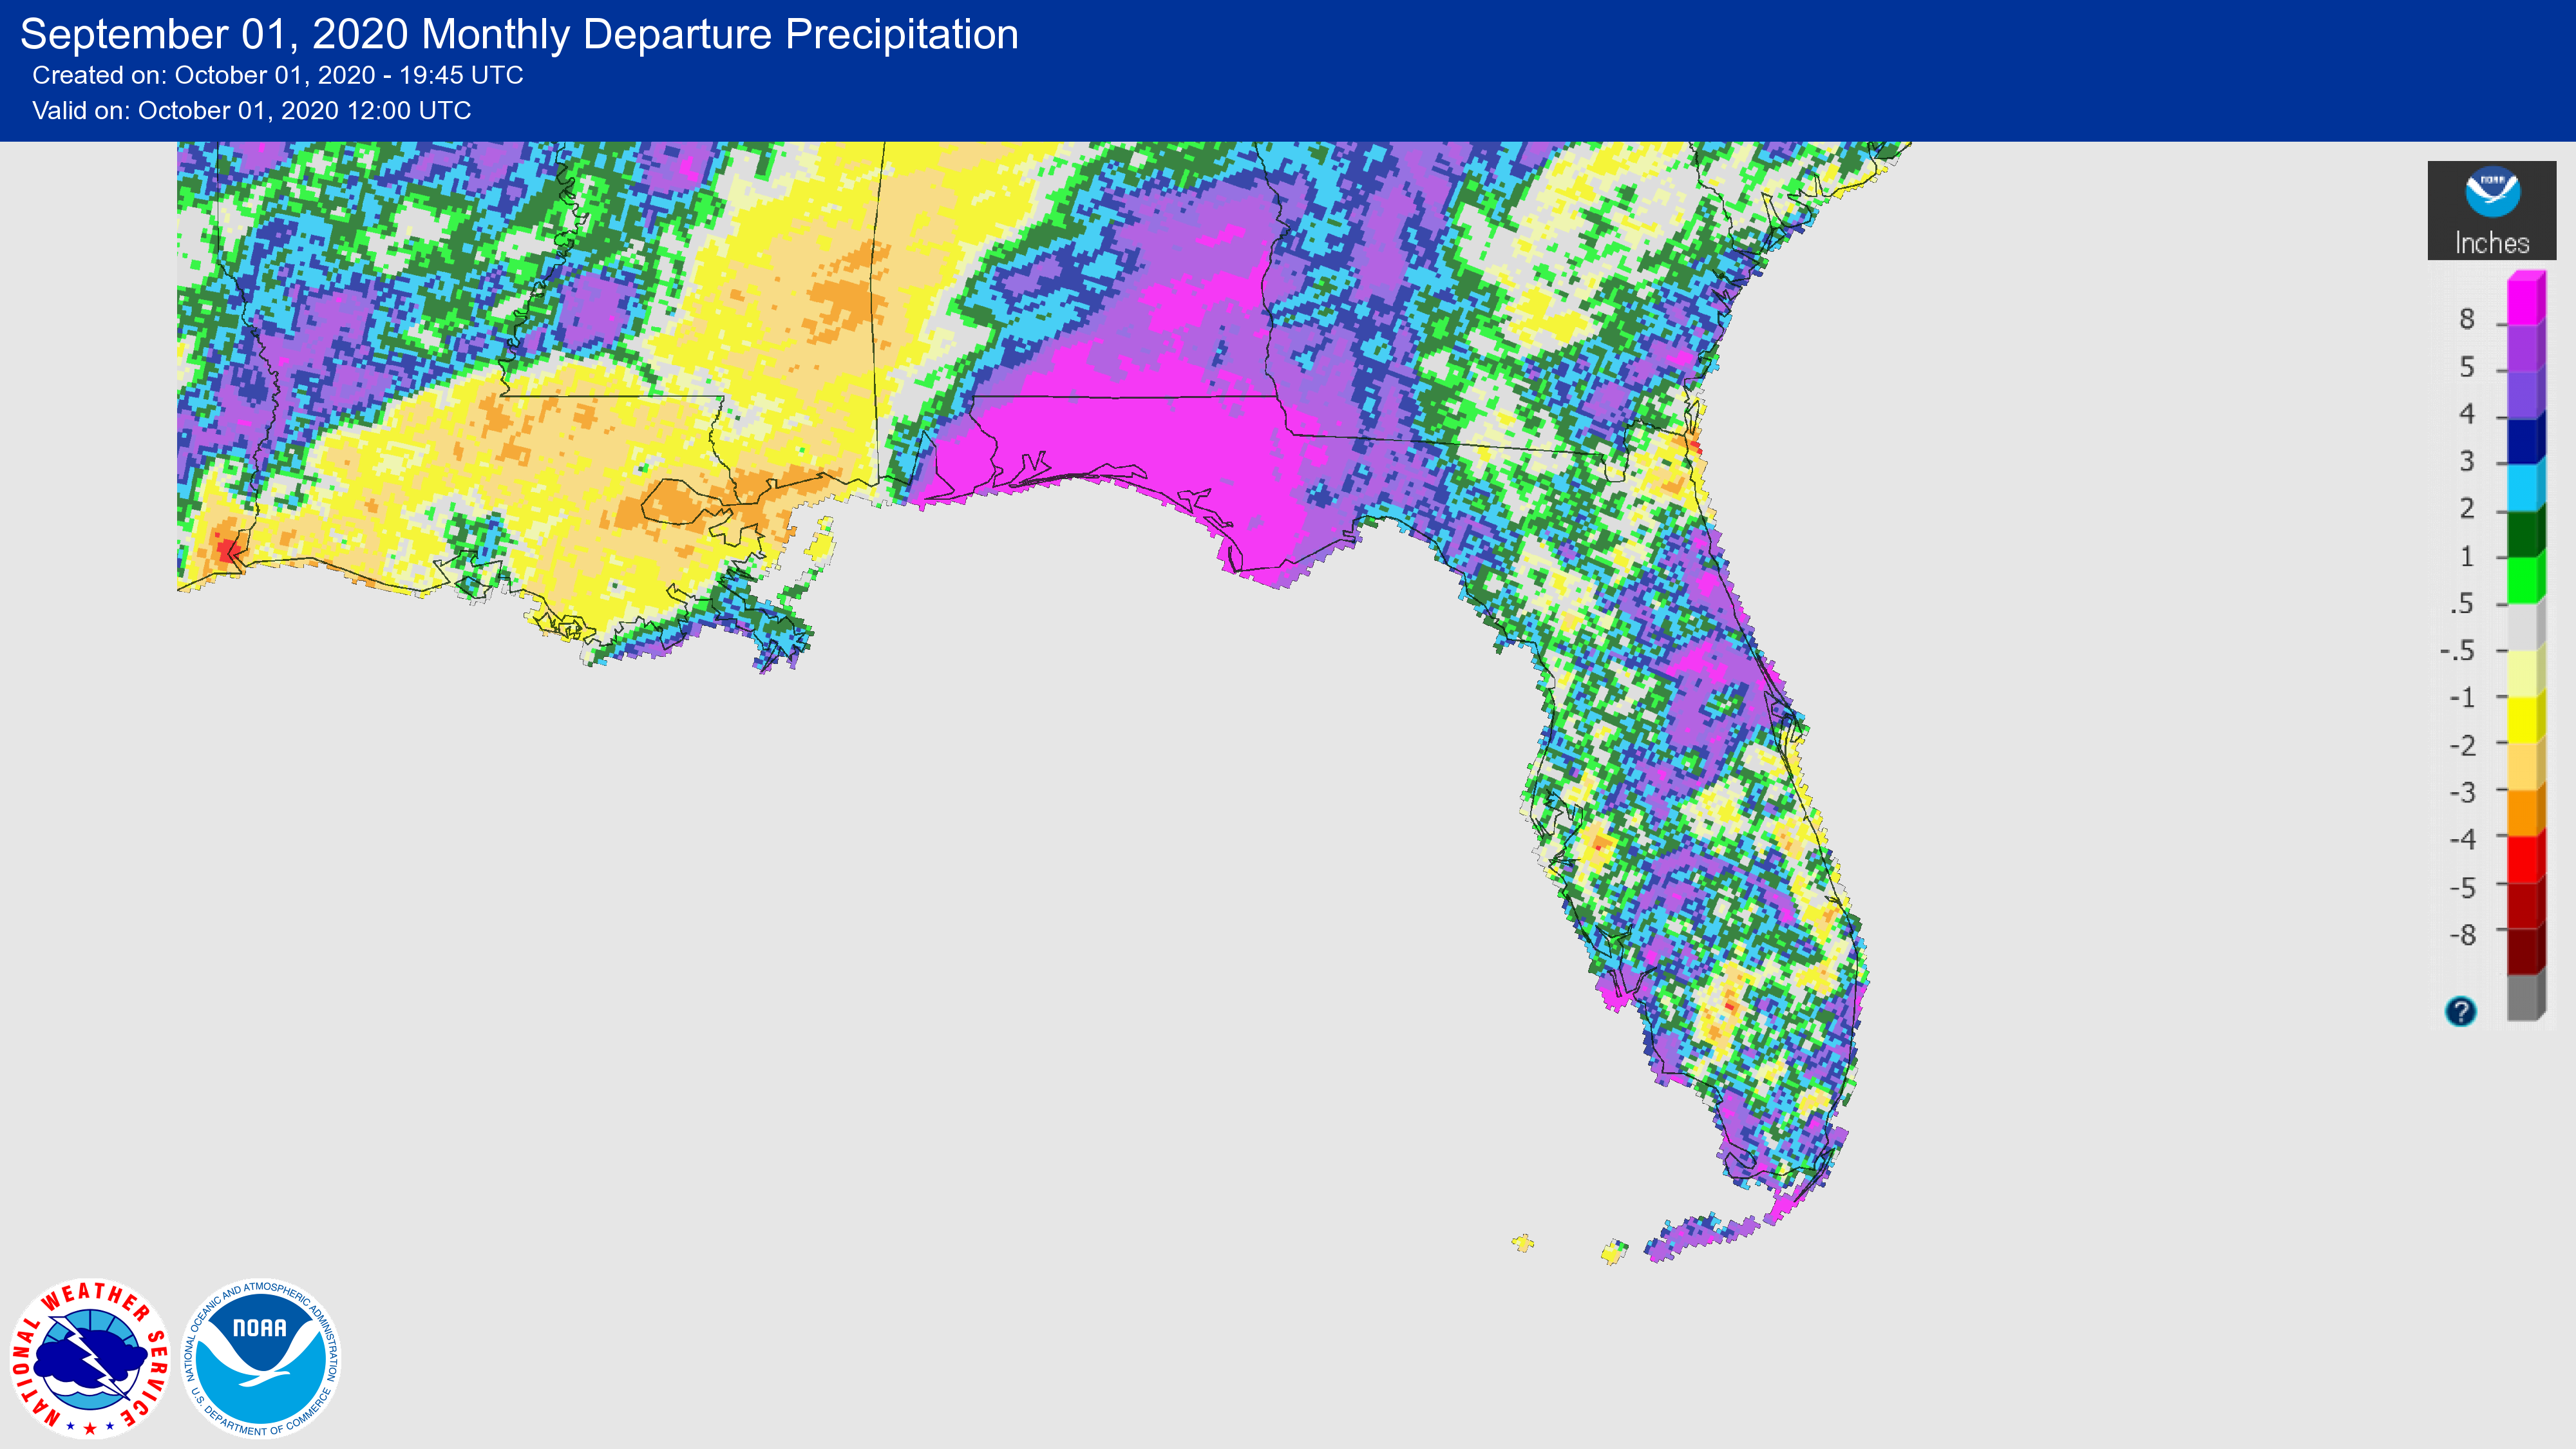
Rainfall totals in September were mostly above normal across the state, especially in the western panhandle. Pensacola had its wettest September on record with 18.51 inches of rain due to Hurricane Sally, which made landfall as a category 2 storm on September 16 in Gulf Shores, Alabama. Figure 1 below shows Sally’s impact across the western Panhandle. The majority of Pensacola’s rain (11.85 inches) fell on the 16th, which became a new 1-day record and the top monthly 1-day record rainfall. Key West observed its 9th wettest September on record. Departures from normal for the month ranged from +12.53” in Pensacola to -0.82” in Tampa (Table 2 and Figure 1).
Table 2. September precipitation totals and departures from normal (inches) for selected cities.
| Station | Total Rainfall | Departure from Normal |
| Pensacola | 18.51 | +12.53 |
| Tallahassee | 9.56 | +4.87 |
| Jacksonville | 8.81 | +0.62 |
| Orlando | 10.74 | +4.68 |
| Tampa | 5.48 | -0.82 |
| Miami | 10.93 | +1.07 |
| Key West | 12.21 | +5.78 |
Figure 1. A graphical depiction of the monthly rainfall departure from normal (inches) for September 2020 (courtesy of NOAA, NWS).
La Niña Conditions Continue in the Pacific.
During August, the Climate Prediction Center issued a La Niña Advisory, as La Niña conditions emerged in August with sea surface temperatures (SST) dipping below average across the central and eastern equatorial Pacific Ocean. La Niña conditions persisted through the month of September and are expected to continue through the Northern Hemisphere 2020-21 winter season (approximately 85% chance). La Niña winters tend to favor warm and dry conditions in the southern tier of the U.S. Expect a drying pattern following the end of the 2020 hurricane season.
Hazardous Weather Events in September.
There were 402 reports of hazardous weather events recorded in Florida during the month of September (see table 4 for a breakdown by event type). Hurricane Sally, which made landfall on September 16 in Gulf Shores, Alabama, impacted much of the state with continuous thunderstorms from September 12-16. Sally caused heavy rainfall in South Florida and the Florida Keys, with over 10 inches recorded in Key West. However, the Panhandle area received the brunt of the impacts. Tiger Point received 36 inches of rain; Pensacola received nearly 17 inches of rain from the storm with catastrophic flooding. Storm surge heights reached 5.6 feet. The storm damaged a section of the Pensacola Bay Bridge and a water main break occurred in Pensacola Beach.
Table 4. Breakdown of storm reports submitted in Florida during the month of September. (Compiled from Iowa State University/Iowa Environmental Mesonet.)
| Report Type | Number of Reports |
| Coastal Flood | 36 |
| Flash Flood | 86 |
| Flood | 26 |
| Heavy Rain | 65 |
| Marine Thunderstorm Wind | 49 |
| Non-Thunderstorm Wind Damage | 2 |
| Non-Thunderstorm Wind Gust | 44 |
| Tornados/Waterspouts/Funnel Clouds | 3/23/2 |
| Thunderstorm Wind Damage | 19 |
| Thunderstorm Wind Gust | 42 |
| Lightning | 1 |
| High Tide | 2 |
| Storm Surge | 2 |
Drought-Related Impacts.
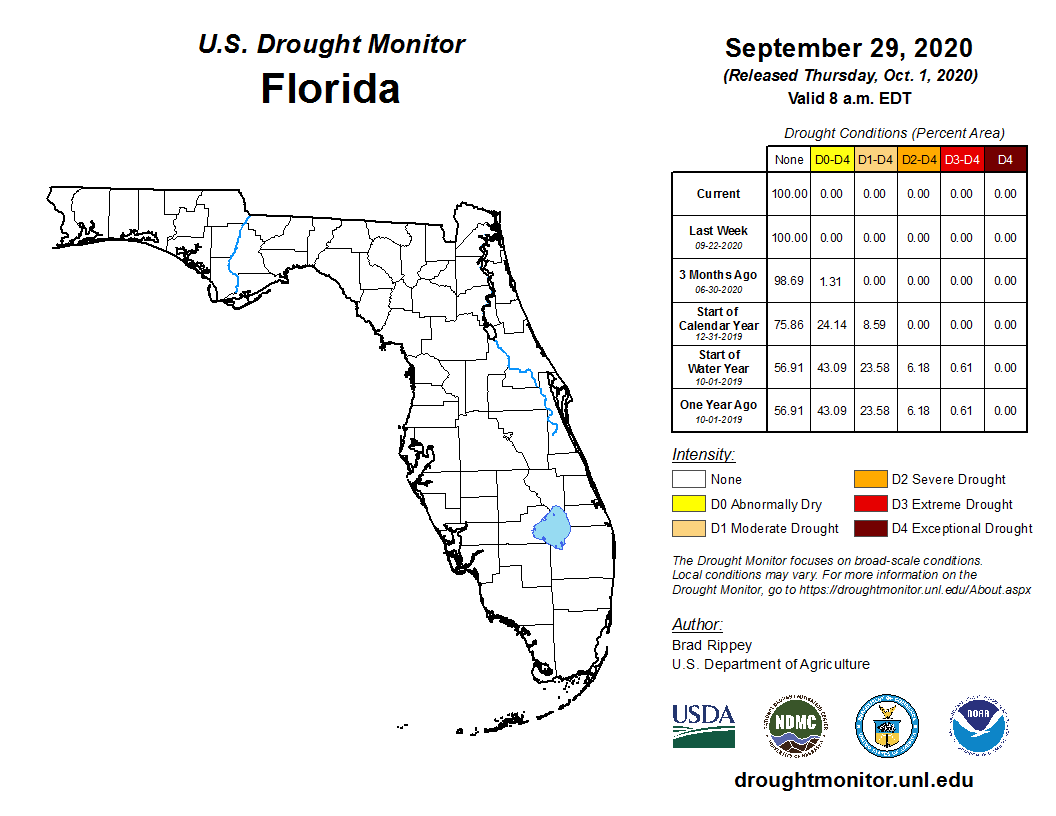
During the month of September, drought did not impact any part of the state, according to the U.S. Drought Monitor. In August, abnormally dry conditions affected west-central Florida, but by early September these abnormally dry conditions dissipated. Drought-free conditions are expected to remain in the short term, but La Niña conditions are expected to lead to the onset of a winter dry pattern.
As of October 1, the Lake Okeechobee water level was at 15.56 ft. above sea level (Feet-NGVD29), which is slightly above average for this time of the year. At the beginning of September, the water level was at 14.37 ft. above sea level.
Agriculture-Related Impacts.
By mid-September, topsoil moisture levels were adequate in 68% of the state, short in 3%, very short in 1%, and 28% of the state was in surplus. By the end of the month, after passage of Hurricane Sally, topsoil moisture levels were adequate in most (77%) of the state, short in 2%, and 21% of the state had a surplus. For more information, consult the weekly Crop Progress and Condition reports published by the USDA’s National Agricultural Statistics Service.
Appendix 1
Additional September departures from normal data for Florida locations (Source: NWS).
| Station | Average Temperature (˚F) | Departure from Normal (˚F) | Total Rainfall (in.) | Departure from Normal (in.) |
| Gainesville | 79.1 | +0.9 | 7.60 | +3.18 |
| Sarasota | 83.2 | +1.8 | 7.83 | +0.73 |
| Melbourne | 81.8 | +1.2 | 7.10 | -0.54 |
| Fort Myers | 82.8 | +0.7 | 14.10 | +5.55 |
Prepared by Daniel J. Brouillette
Florida Climate Center
The Florida State University
Tallahassee, FL
Prepared by Daniel J. Brouillette
Florida Climate Center
The Florida State University
Tallahassee, FL
Building A, Suite 292
Tallahassee, FL 32306-2741
Phone: (850) 644-3417 | (850) 644-0719
climate@coaps.fsu.edu