


The Florida Climate Center serves as the primary resource for climate data, information, and services in the state of Florida.

The Florida Climate Center achieves its mission by providing climate monitoring, research, and expertise to be applied by the people, institutions, and businesses of Florida and the surrounding region.
We provide direct service by fulfilling requests for climate and weather data and information in a variety of formats.
We perform research that advances the understanding of the climate variability and changes of Florida and the surrounding region.
We provide outreach in presentations and at events aimed at a variety of groups, interests, and ages.
Prepared by Florida Climate Center
Florida State University
Tallahassee, FL

Summary:
- Monthly mean temperatures in December were near to above normal across Florida.
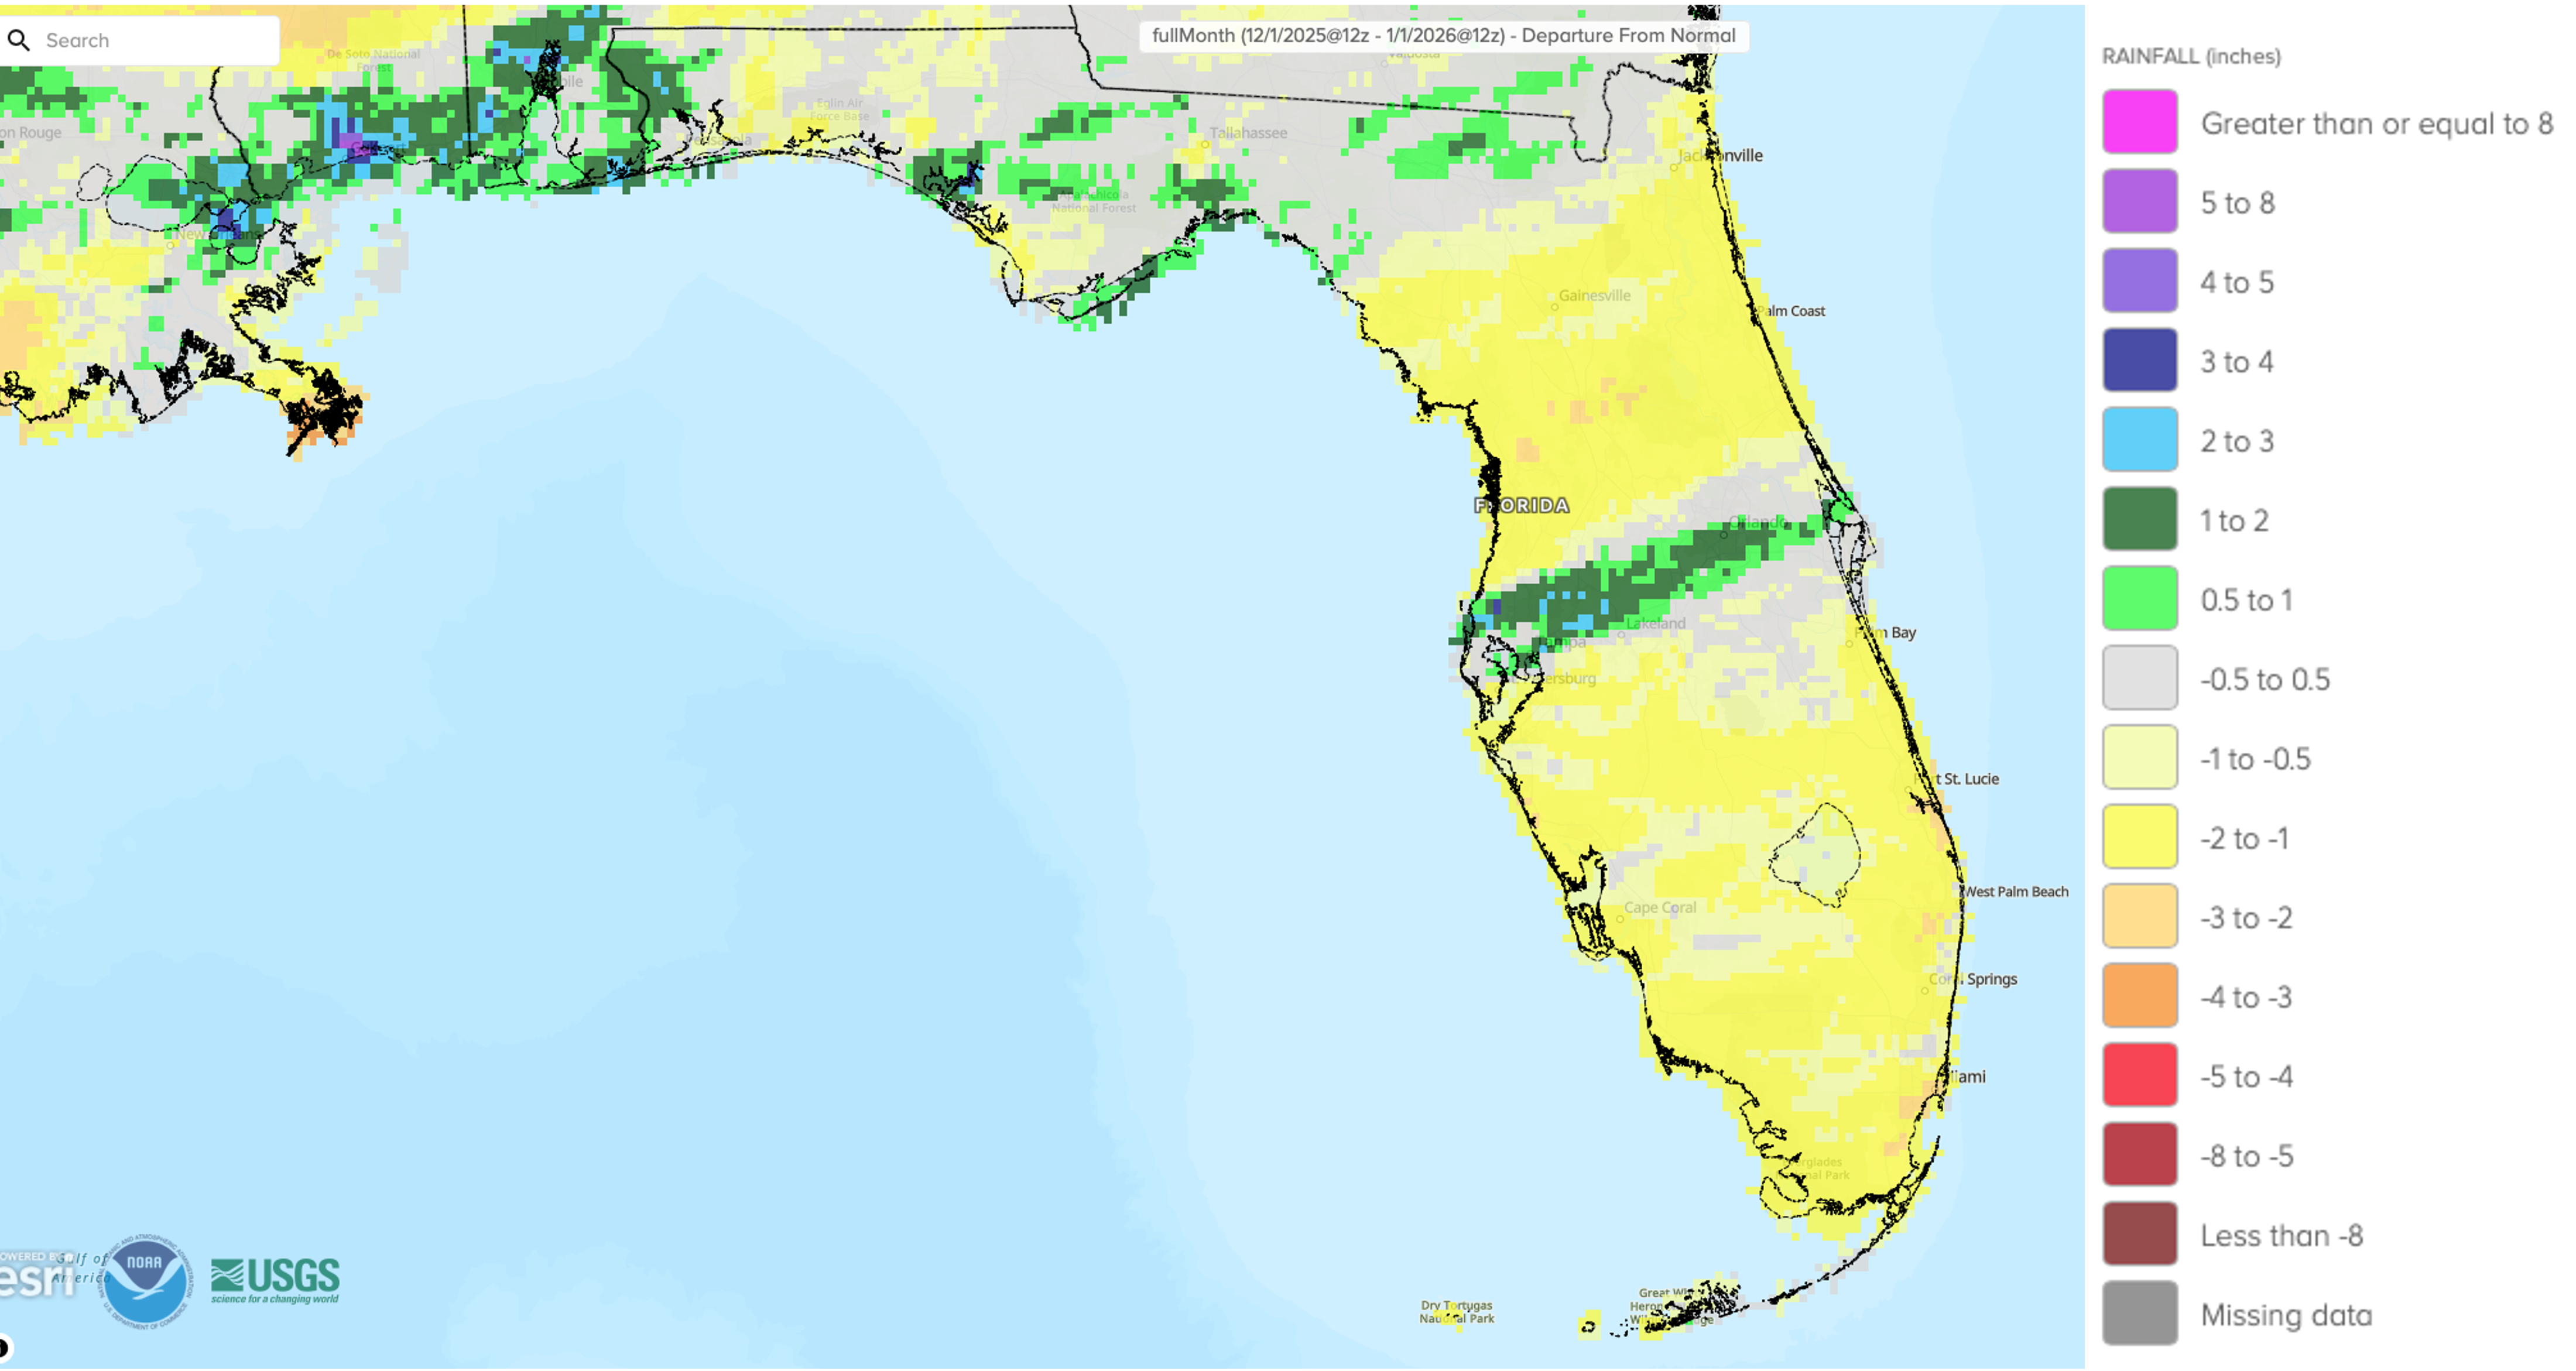
- Monthly precipitation totals in December were generally below normal, with the exception of parts of central Florida and the Panhandle.
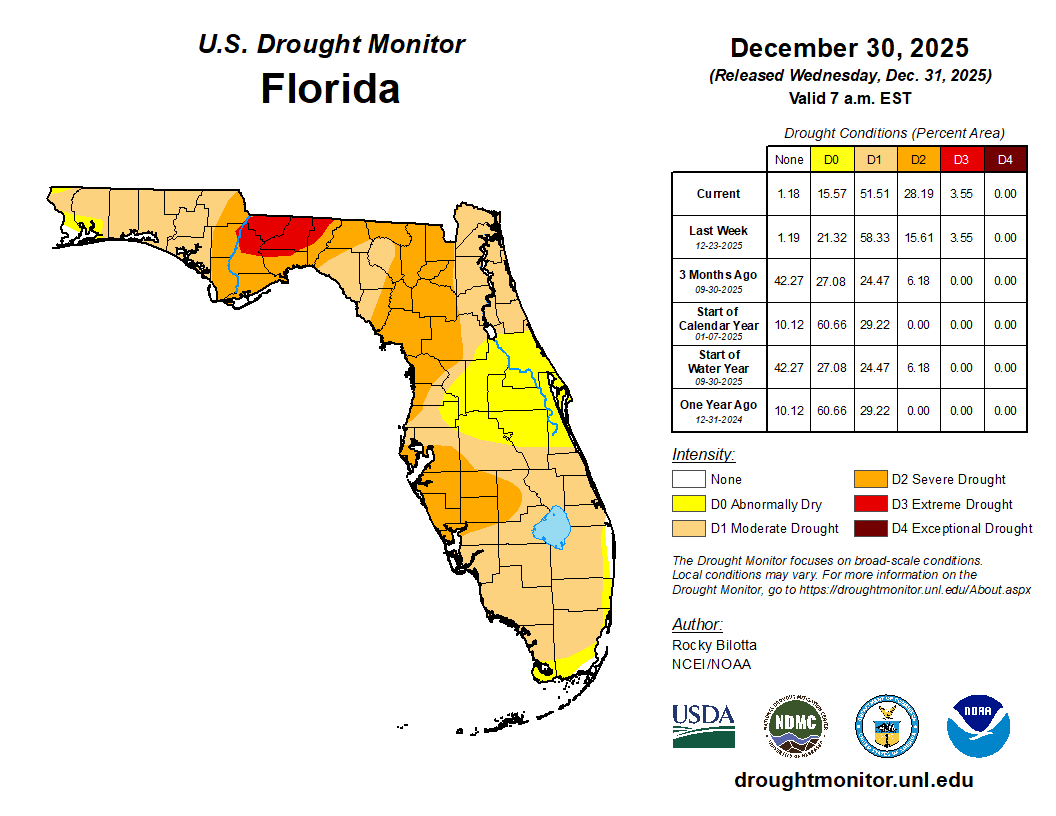
- Drought conditions improved but persisted in the Florida Panhandle, and drought expansion and degradation occurred in the Peninsula during the month.
- A La Niña advisory continued in the equatorial Pacific Ocean and a transition to ENSO-neutral is expected during January-March 2026 (75% chance).
Table 1. December average temperatures and departures from normal ( ̊F) for select cities.
| Station | Mean Temperature | Departure from Normal |
| Pensacola | 55.3 | -0.2 |
| Tallahassee | 54.4 | 0.0 |
| Jacksonville | 57.1 | +0.4 |
| Orlando | 65.5 | +2.2 |
| Tampa | 66.6 | +1.7 |
| Miami | 73.3 | +2.1 |
| Key West | 74.2 | +1.2 |
Figure 1. Monthly average temperature departures from normal (°F) in Florida for December 2025.
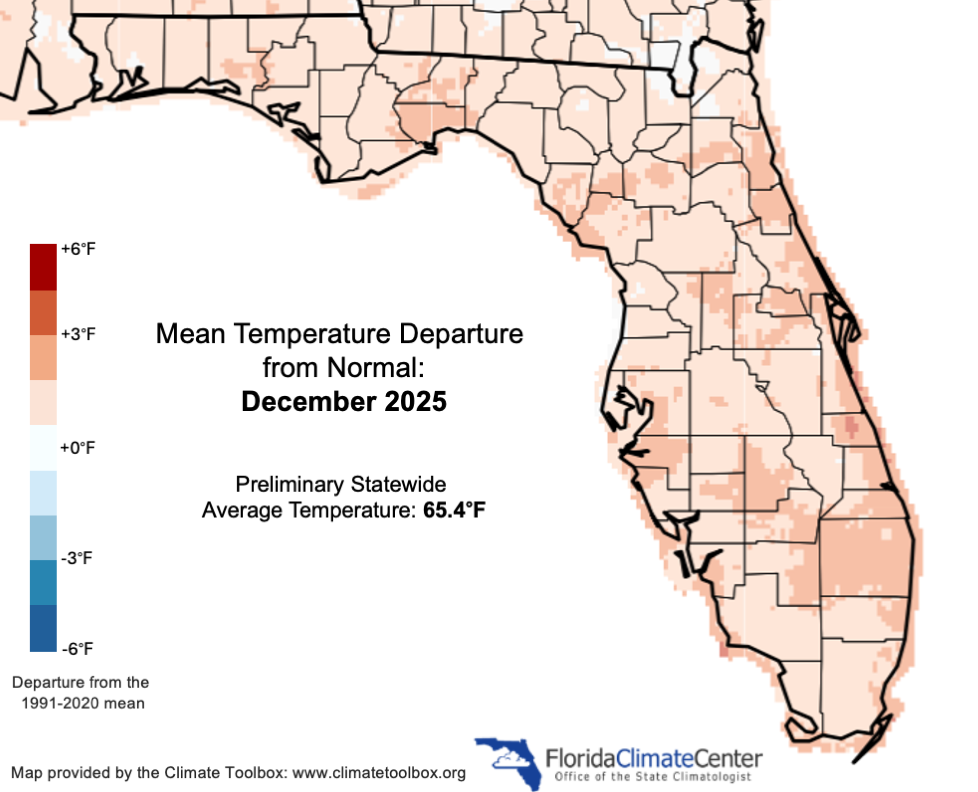
Table 2. December precipitation totals and departures from normal (inches) for selected cities.
| Station | Total Rainfall | Departure from Normal |
| Pensacola | 5.21 | -0.19 |
| Tallahassee | 3.45 | -0.79 |
| Jacksonville | 2.18 | -0.60 |
| Orlando | 3.13 | +0.65 |
| Tampa | 2.88 | +0.32 |
| Miami | 0.72 | -1.72 |
| Key West | 0.97 | -1.19 |
Figure 2. A graphical depiction of the monthly rainfall departure from normal (inches) for December 2025 (courtesy of NOAA, NWS).
La Niña Advisory.
La Niña conditions persisted over the past month in the tropical equatorial Pacific Ocean. Below-average sea surface temperatures continued across the east-central region of the equatorial Pacific Ocean. The latest weekly Niño-3.4 index was -0.5°C and the Niño-3 and Niño-1+2 indices were -0.8°C and -0.7°C, respectively. Subsurface temperature anomalies became slightly positive, and atmospheric anomalies across the tropical Pacific remained consistent with La Niña. A transition to ENSO-neutral is expected during January-March 2026 (75% chance). ENSO-neutral is likely to continue through the Northern Hemisphere late spring 2026.
Hazardous Weather Events in December.
According to the Local Storm Reports issued by the local National Weather Service offices serving Florida, there were 48 individual local reports of hazardous weather events recorded across the state during the month of December (see Table 3 for a breakdown by event type). Multiple reports of strong wind gusts and heavy rain were reported on the 7th and 8th along a frontal boundary in central Florida, stretching from Pasco to Brevard County. Overall it was another relatively quiet month for severe weather.
Table 3. Breakdown of storm reports submitted in Florida during the month of December (compiled from Iowa State University/Iowa Environmental Mesonet).
| Report Type | Number of Reports |
| Heavy Rain | 19 |
| Dense Fog | 2 |
| Flood | 0 |
| Marine Thunderstorm Wind | 5 |
| Non-Thunderstorm Wind Gust | 11 |
| Tornado/Waterspout/Funnel Cloud | 0 / 0 / 0 |
| Thunderstorm Wind Damage | 1 |
| Non-Thunderstorm Wind Damage | 0 |
| Thunderstorm Wind Gust | 10 |
Daily Record Events in December.
Table 4. Summary of daily records broken or set in Florida in December (source: NCEI Daily Weather Records).
| Category | Number of Records |
| Highest daily max. temp. | 14 |
| Highest daily min. temp. | 5 |
| Lowest daily max. temp. | 0 |
| Lowest daily min. temp. | 0 |
| Highest daily precipitation | 21 |
| Total | 40 |
Drought-Related Impacts.
Drought conditions improved but persisted in the Panhandle, with sufficient rainfall early in the month to remove exceptional drought (D4). Meanwhile, moderate to severe drought expanded in the Florida Peninsula. In mid-December, approximately 4% of the state was in extreme drought (D3), 14% was in severe drought (D2), and 51% was in moderate drought (D1); about 19% of the state was abnormally dry (D0), according to the U.S. Drought Monitor. By month’s end, roughly 4% of the state was in extreme drought (D3), 28% was in severe drought (D2), 52% was in moderate drought (D1), and 16% of the state was abnormally dry (D0) (Figure 2 below).
As of December 31, the Lake Okeechobee water level was 13.35 ft. above sea level (Feet-NGVD29), which is below average for this time of year. At the first of December, the water level was 13.66 ft. above sea level.
Figure 3. A graphical depiction of the latest drought conditions in Florida according to the U.S. Drought Monitor (courtesy of the National Drought Mitigation Center, University of Nebraska-Lincoln).
Agriculture-Related Impacts.
Appendix 1
Additional December departures from normal data for select Florida locations (source: NWS).
| Station | Average Temperature (˚F) | Departure from Normal (˚F) | Total Rainfall (in.) | Departure from Normal (in.) |
| Gainesville | 59.8 | +2.5 | 1.75 | -1.13 |
| Sarasota | 68.1 | +2.9 | 1.71 | -0.62 |
| Melbourne | 66.6 | +1.9 | 1.28 | -1.08 |
| Fort Myers | 69.6 | +2.3 | 0.64 | -1.26 |
| West Palm Beach | 72.1 | +3.1 | 0.83 | -2.65 |
Appendix 2
Christmas Day maximum temperatures, departures from normal and all-time daily records for select locations (source: NWS).
| Station | Max Temperature Dec. 25, 2025 (˚F) | Departure from Normal(˚F) | Warmest Christmas on Record (˚F) |
| Pensacola | 78 | +14 | 78 in 2023, 1974, 1955 |
| Tallahassee | 80 | +15 | 82 in 2016 |
| Jacksonville | 80 | +14 | 82 in 2015 |
| Gainesville | 81 | +13 | 83 in 2015 |
| Tampa | 80 | +7 | 86 in 2016, 2015 |
| Orlando | 79 | +6 | 86 in 2015 |
| Melbourne | 79 | +4 | 83 in 2015 |
| Miami | 81 | +4 | 85 in 2016, 1941 |
| Sarasota/Bradenton | 81 | +8 | 85 in 2016, 2015 |
| Fort Myers | 82 | +6 | 88 in 2016 |
| Key West | 77 | +0 | 83 in 2015 |
Prepared by Florida Climate Center
Florida State University
Tallahassee, FL
Summary:
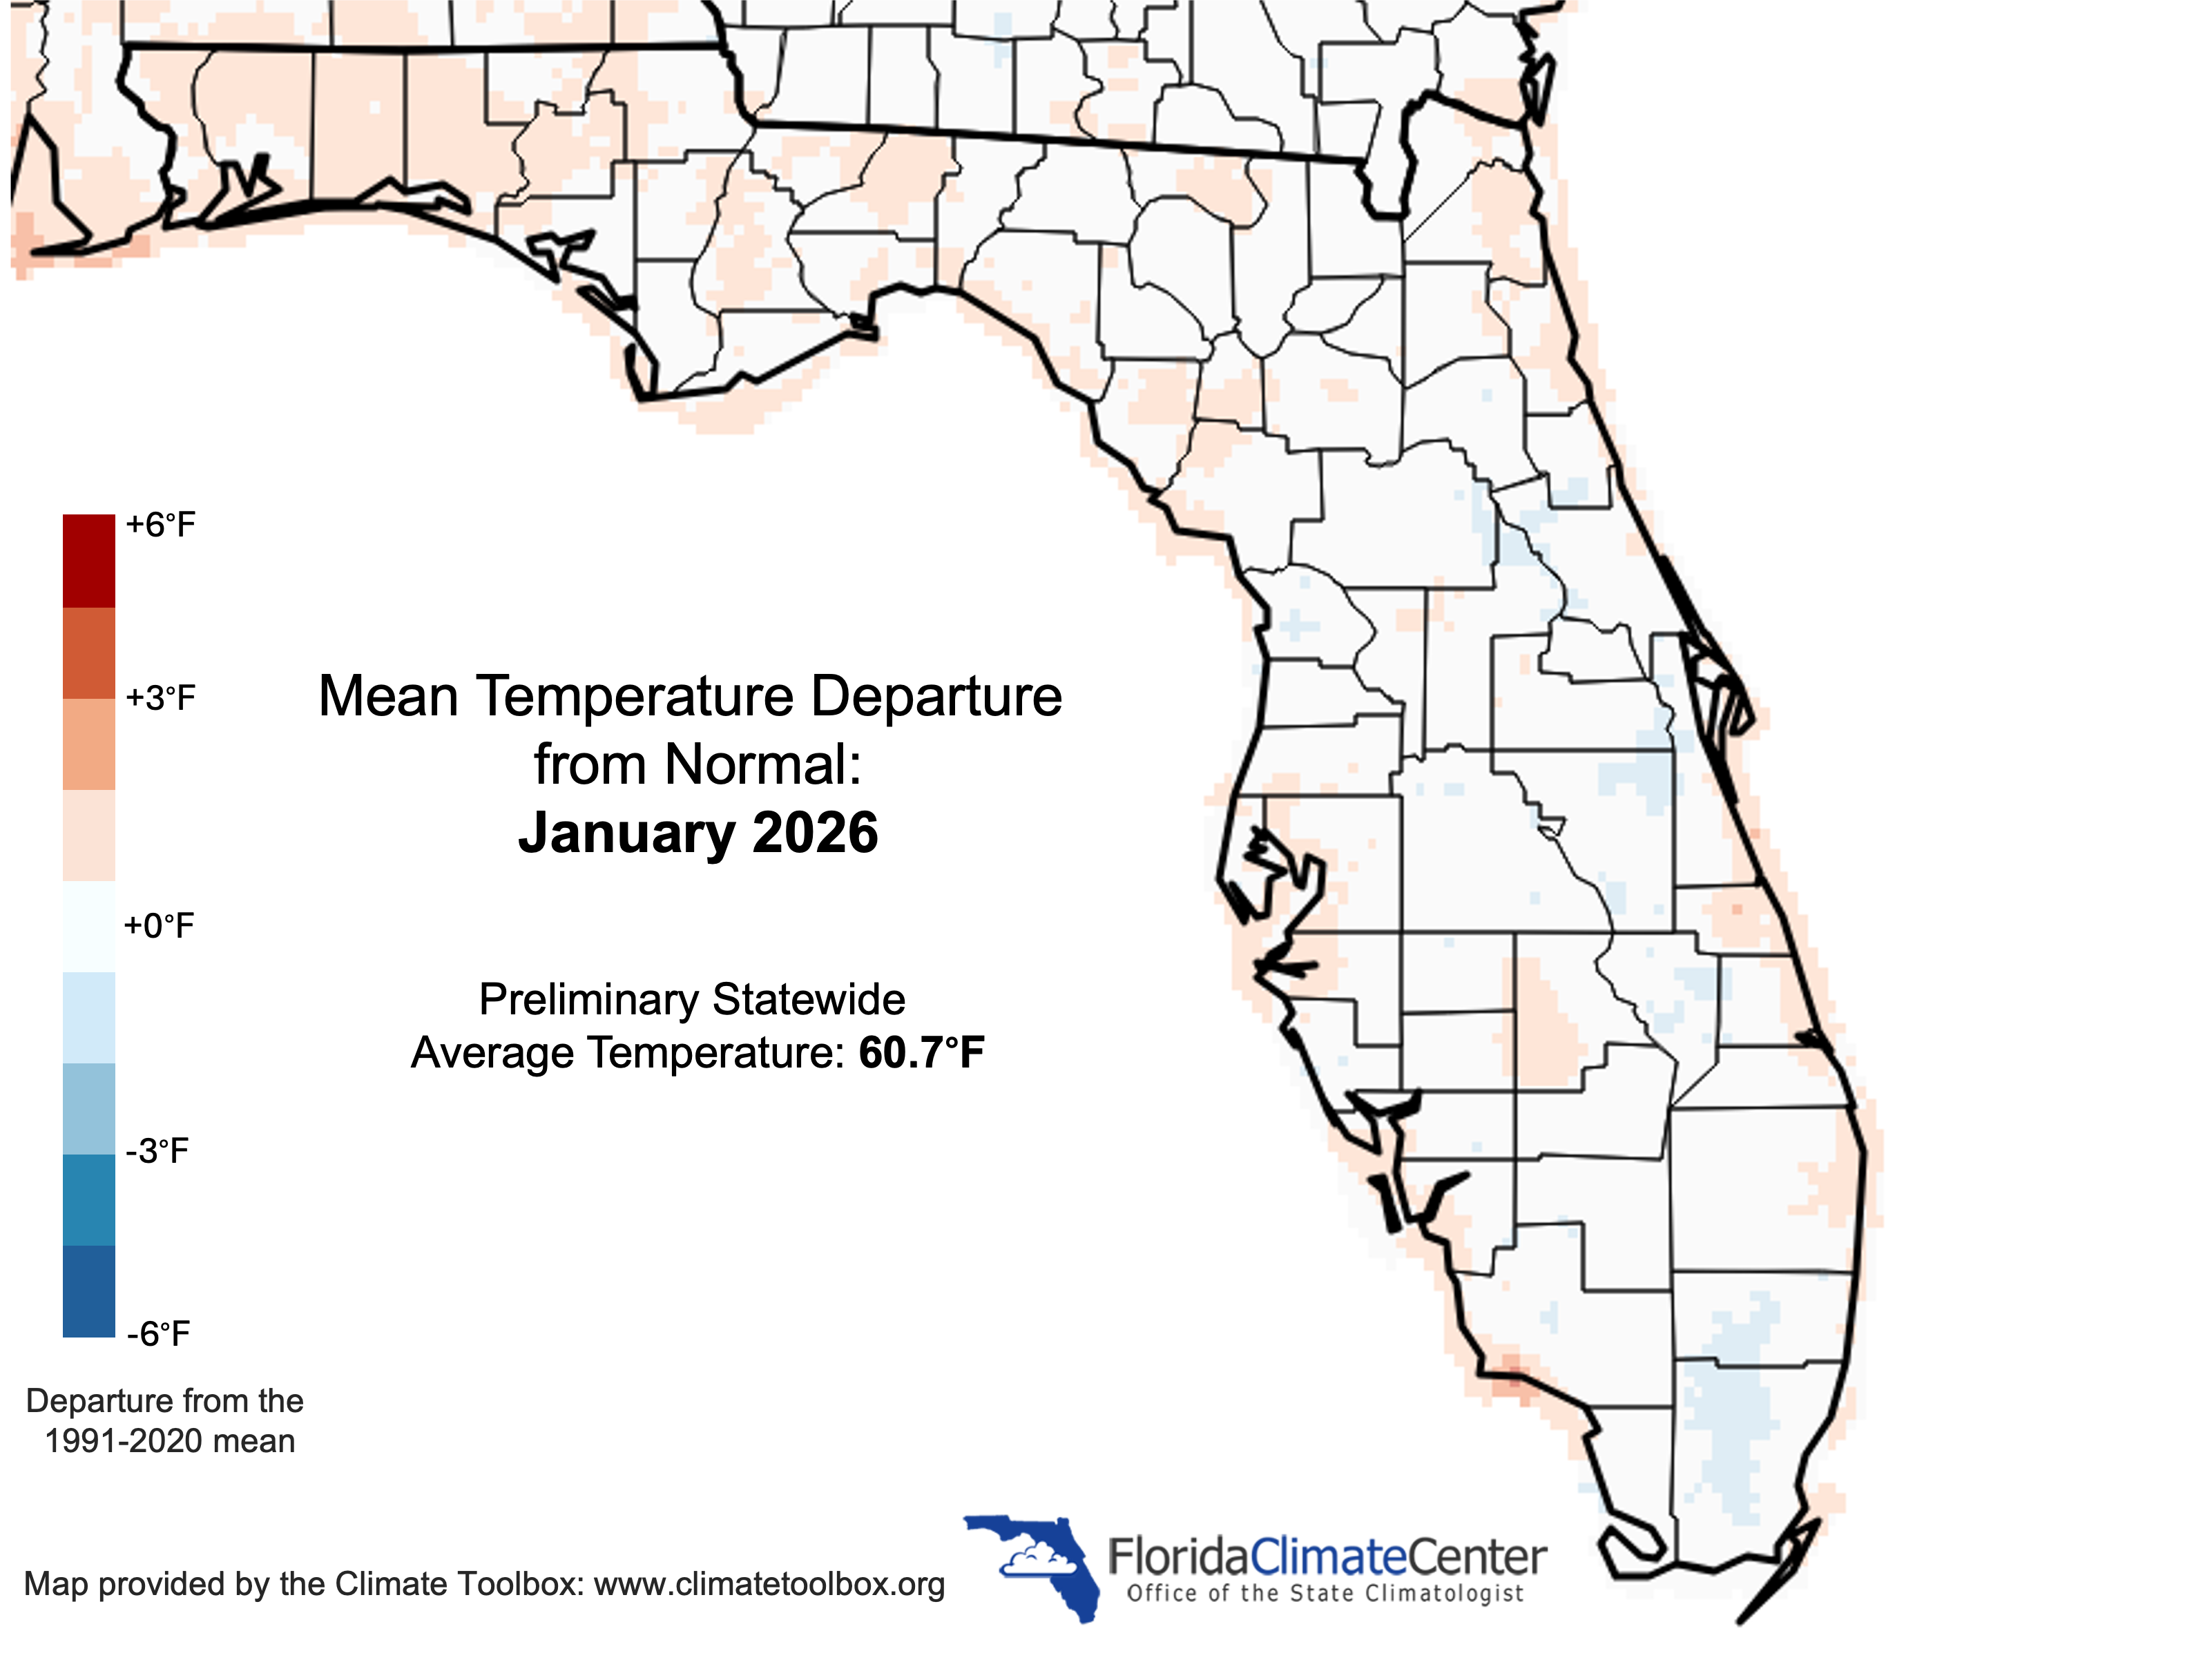
- Monthly mean temperatures in January averaged out to near normal across Florida.
- Monthly precipitation totals in January were below normal across Florida, with two rounds of wintry precipitation during the month.
- Drought conditions persisted or deteriorated in Florida during January and 94% of the state was in some level of drought (D1-D4) by month’s end.
- A La Niña advisory continued in the equatorial Pacific Ocean and a transition to ENSO-neutral is expected during January-March 2026 (75% chance) that will likely persist through at least spring 2026.
Monthly temperatures in January averaged out to near normal in Florida. Average monthly temperature departures from normal ranged from -1.1 ̊F in Miami to +0.8 ̊F in West Palm Beach for the month (see Table 1 and Appendix 1 for select cities). January was a month of temperature whiplash in Florida. The early part of the month experienced mostly above average temperatures. Two new daily record highs were set on the 7th, including Tallahassee at 80 ̊F (previous record was 79 ̊F in 1916) and Apalachicola at 77 ̊F (tied with 1974). This warm spell was followed by a strong cold front mid-month during the MLK weekend, bringing cold air and snow to the Florida Panhandle on the morning of the 18th. Temperatures climbed to above freezing that day, so any snow accumulations melted quickly. As the front moved south through the state on the 18th, strong wind gusts of 40-60 mph were reported across central Florida accompanied by rapid temperature drops of -20 ̊F, or more, in one hour! The largest temperature drop was reported in Kissimmee with a drop of 31 ̊F in one hour. A major ice and snowstorm impacted the U.S. South, from Texas to Georgia and the Carolinas, on January 24-25, but Florida stayed south of the wintry weather. Parts of South Florida were record warm on the 25th and 26th before another strong cold front moved through the state on the 26-27th, which was reinforced by more Arctic air that kept temperatures well below normal across the state for the remainder of the month. In the overnight hours of January 31 to February 1, single-digit wind chill temperatures were felt in the interior portions of the western Panhandle, wind chills below 20 ̊F were felt as far south as Lake Okeechobee, and wind chills in South Florida were generally 25 ̊F – 30 ̊F. Freezing temperatures were observed across the Florida Peninsula, except along the southwest and southeast coasts. Tallahassee experienced 10 nights in January with minimum temperatures at or below 26 ̊F which ties as the 4th highest number of nights in January on record. Select daily record low minimum temperatures tied or broken during January are provided in Appendix 2.
Table 1. January average temperatures and departures from normal ( ̊F) for select cities.
| Station | Mean Temperature | Departure from Normal |
| Pensacola | 52.8 | -0.4 |
| Tallahassee | 51.2 | -1.0 |
| Jacksonville | 54.1 | -0.1 |
| Orlando | 60.4 | -0.2 |
| Tampa | 61.4 | -0.6 |
| Miami | 67.5 | -1.1 |
| Key West | 69.6 | -1.0 |
Figure 1. Monthly average temperature departures from normal (°F) in Florida for January 2026.
Monthly precipitation totals in January were below normal across Florida. The monthly precipitation departures from normal ranged from -3.04 inches in West Palm Beach to -0.19 inches in Miami (see Table 2 and Appendix 1 for select locations). Overall monthly precipitation was below normal across the state with widespread deficits of 1-3 inches. Northwest Florida saw snow on the morning of the 18th, almost one year to the day from last year’s record snowfall. A trace of snow was reported in Pensacola and Crestview, while CoCoRaHS observers reported snowfall totals of 0.1 inches in Niceville (OK-1), 1.0 inch in Baker (OK-52), and 0.7 and 0.5 inches in Santa Rosa County (SR-42 and SR-43, respectively). Snow accumulated on grass, trees and other surfaces, but roadways stayed clear as temperatures stayed above freezing. On January 31st, snow flurries were observed again in the Panhandle and across North Florida, with Tallahassee, Jacksonville and Lake City seeing a trace of snow. Flurries were also reported along the west coast of Florida from Levy to Lee Counties. The Tampa Bay area has recorded snow two times before dating back to 1892, including 0.2 inches on January 19, 1977 and 0.1 inches on February 13, 1899, and several other years have recorded a trace of snow.
Table 2. January precipitation totals and departures from normal (inches) for selected cities.
| Station | Total Rainfall | Departure from Normal |
| Pensacola | 2.60 | -2.43 |
| Tallahassee | 3.01 | -1.40 |
| Jacksonville | 1.30 | -1.98 |
| Orlando | 0.69 | -1.79 |
| Tampa | 0.99 | -1.66 |
| Miami | 1.64 | -0.19 |
| Key West | 0.59 | -1.24 |
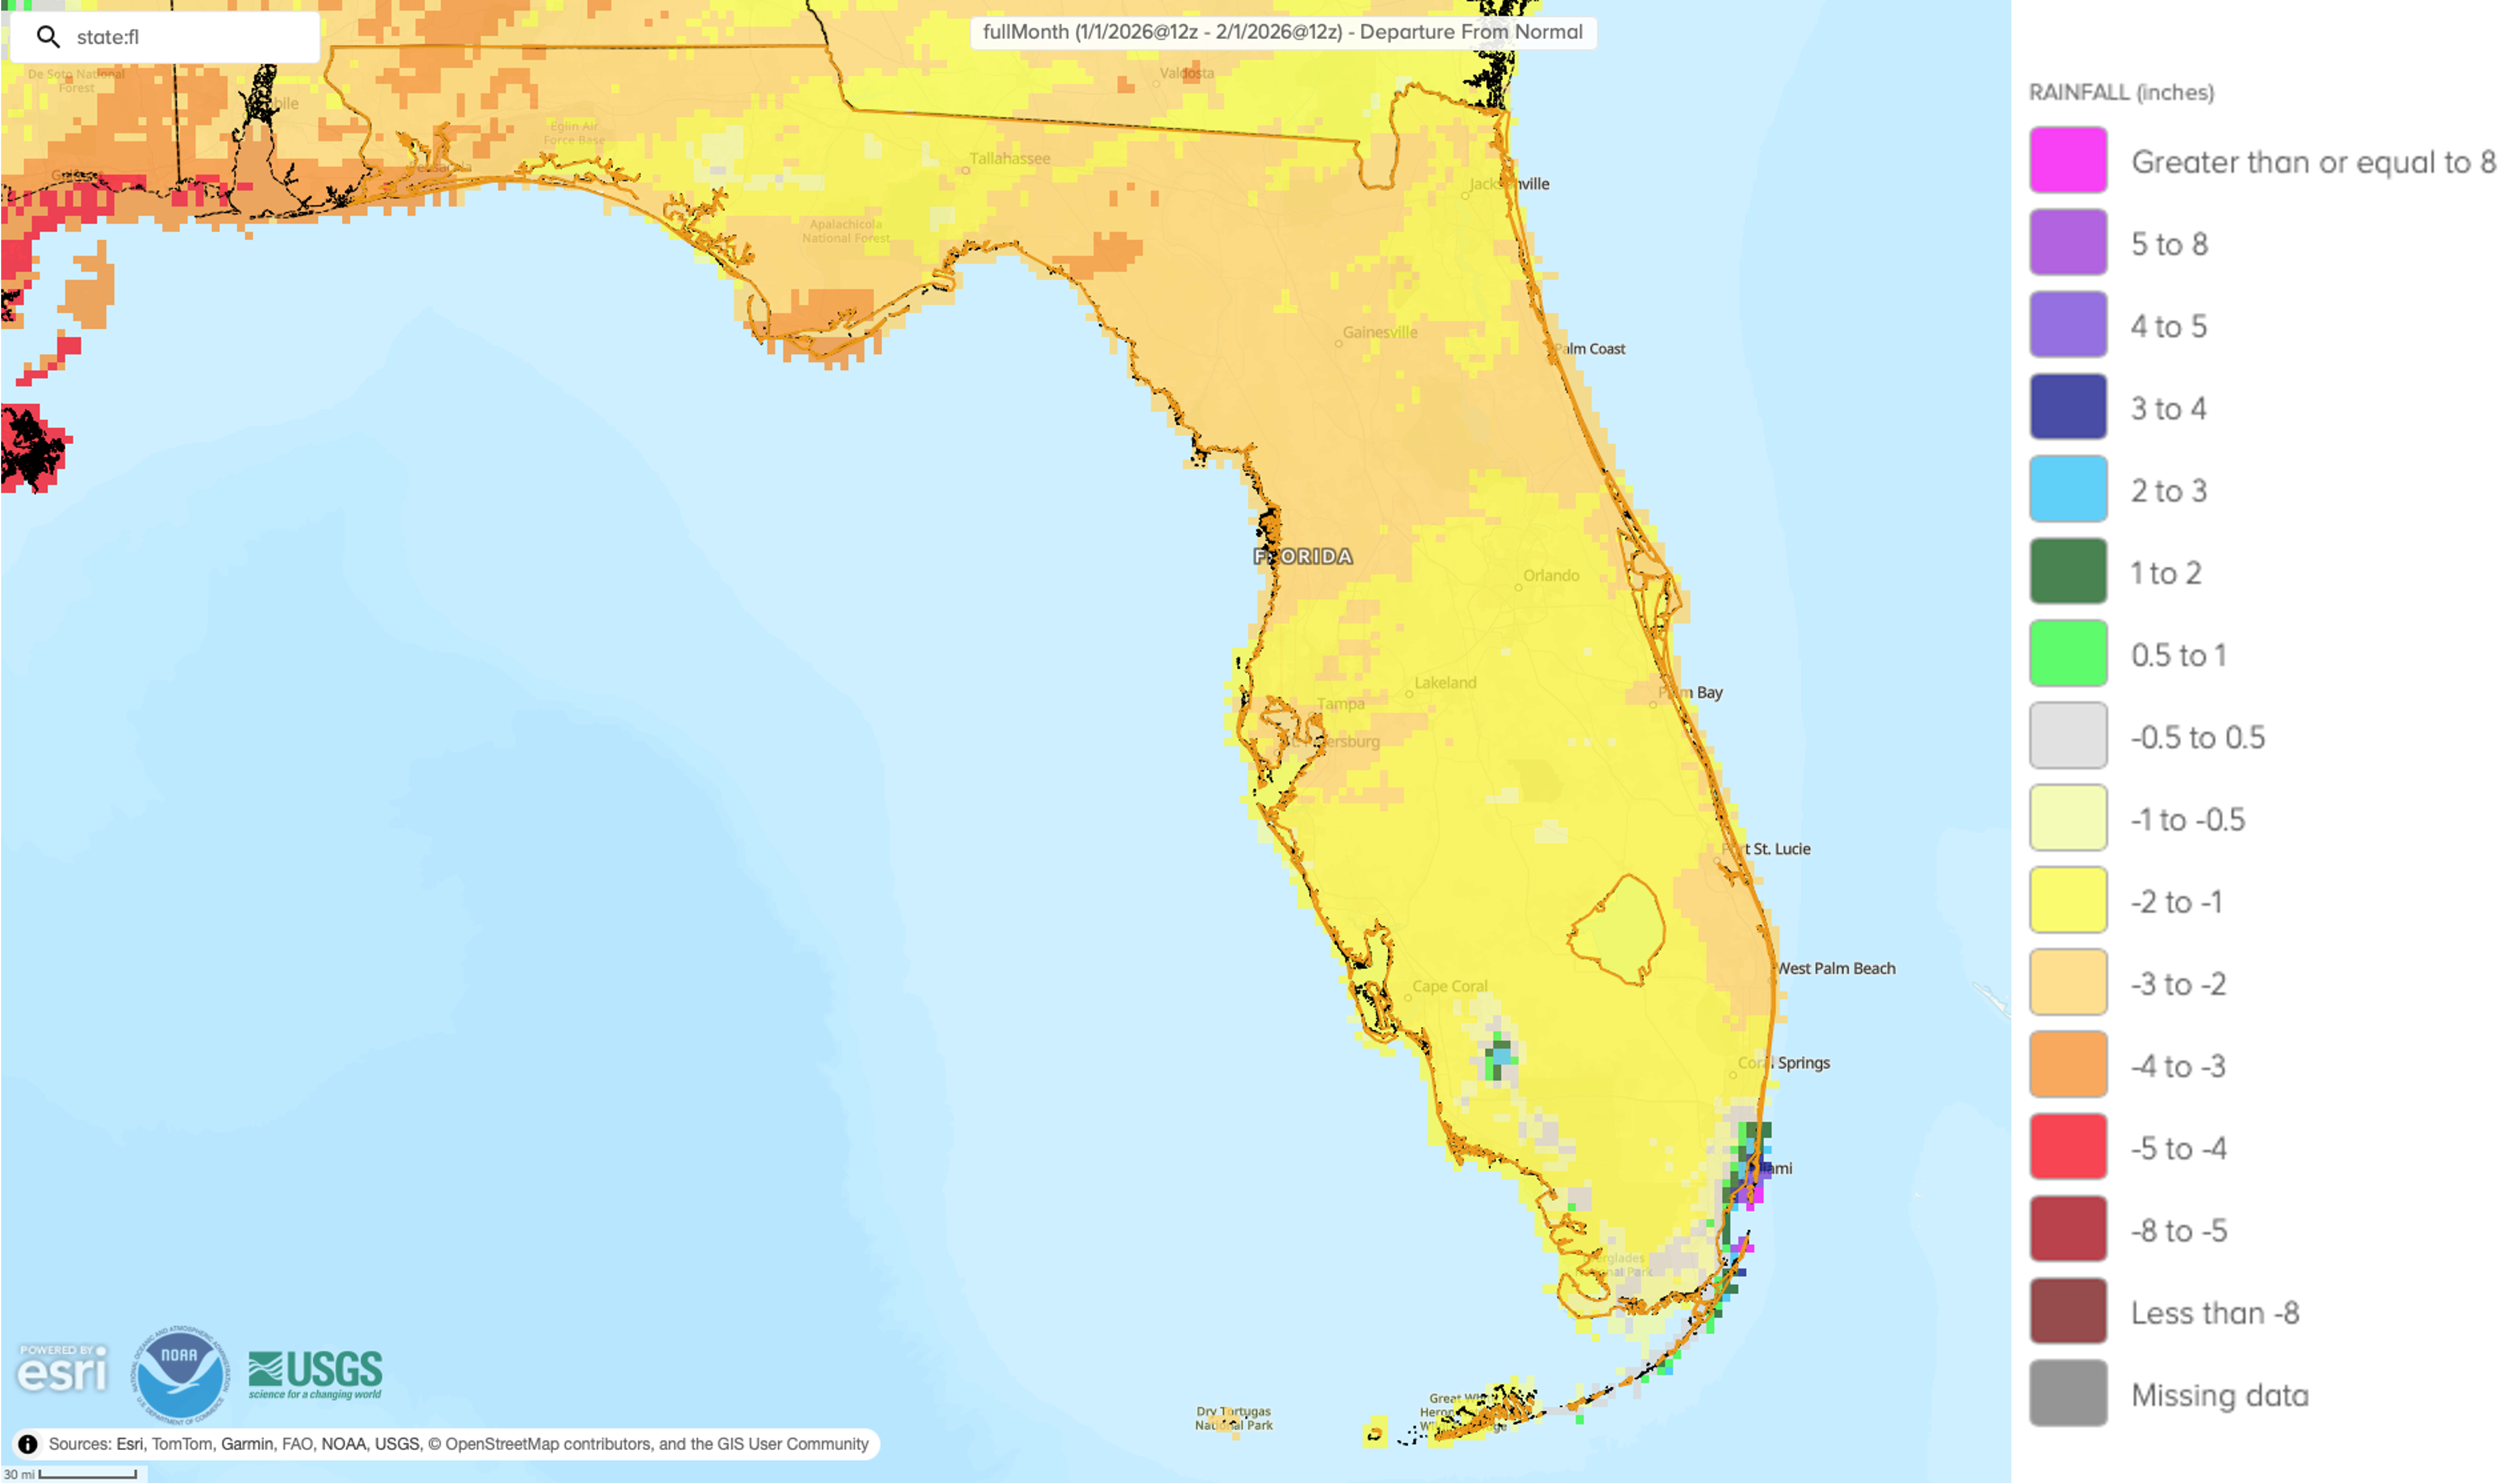
Figure 2. A graphical depiction of the monthly rainfall departure from normal (inches) for January 2026 (courtesy of NOAA, NWS).
La Niña Advisory.
As of mid-January, the tropical equatorial Pacific Ocean remained in a La Niña state. Below-average sea surface temperatures continued across the east-central region of the equatorial Pacific Ocean. Subsurface temperature anomalies became slightly positive, and atmospheric anomalies across the tropical Pacific remained consistent with La Niña. A transition to ENSO-neutral is expected during January-March 2026 (75% chance). ENSO-neutral is likely to continue through at least the Northern Hemisphere late spring 2026. The probability for an El Niño increases (48%-51% chance) beyond the May-July 2026 timeframe.
Hazardous Weather Events in January.
According to the Local Storm Reports issued by the local National Weather Service offices serving Florida, there were 214 individual local reports of hazardous weather events recorded across the state during the month of January (see Table 3 for a breakdown by event type). There were many reports of snow, as well as strong wind gusts that caused damages due to downed trees and power lines.
Table 3. Breakdown of storm reports submitted in Florida during the month of January (compiled from Iowa State University/Iowa Environmental Mesonet).
| Report Type | Number of Reports |
| Heavy Rain | 0 |
| Dense Fog | 0 |
| Hail | 1 |
| Marine Thunderstorm Wind | 16 |
| Non-Thunderstorm Wind Gust | 108 |
| Tornado/Waterspout/Funnel Cloud | 1 / 3 / 0 |
| Thunderstorm Wind Damage | 27 |
| Non-Thunderstorm Wind Damage | 9 |
| Thunderstorm Wind Gust | 18 |
| Snow | 31 |
Daily Record Events in January.
Table 4. Summary of daily records broken or set in Florida in January 2026 (source: NCEI Daily Weather Records).
| Category | Number of Records |
| Highest daily max. temp. | 43 |
| Highest daily min. temp. | 13 |
| Lowest daily max. temp. | 10 |
| Lowest daily min. temp. | 23 |
| Highest daily precipitation | 4 |
| Total | 93 |
Drought-Related Impacts.
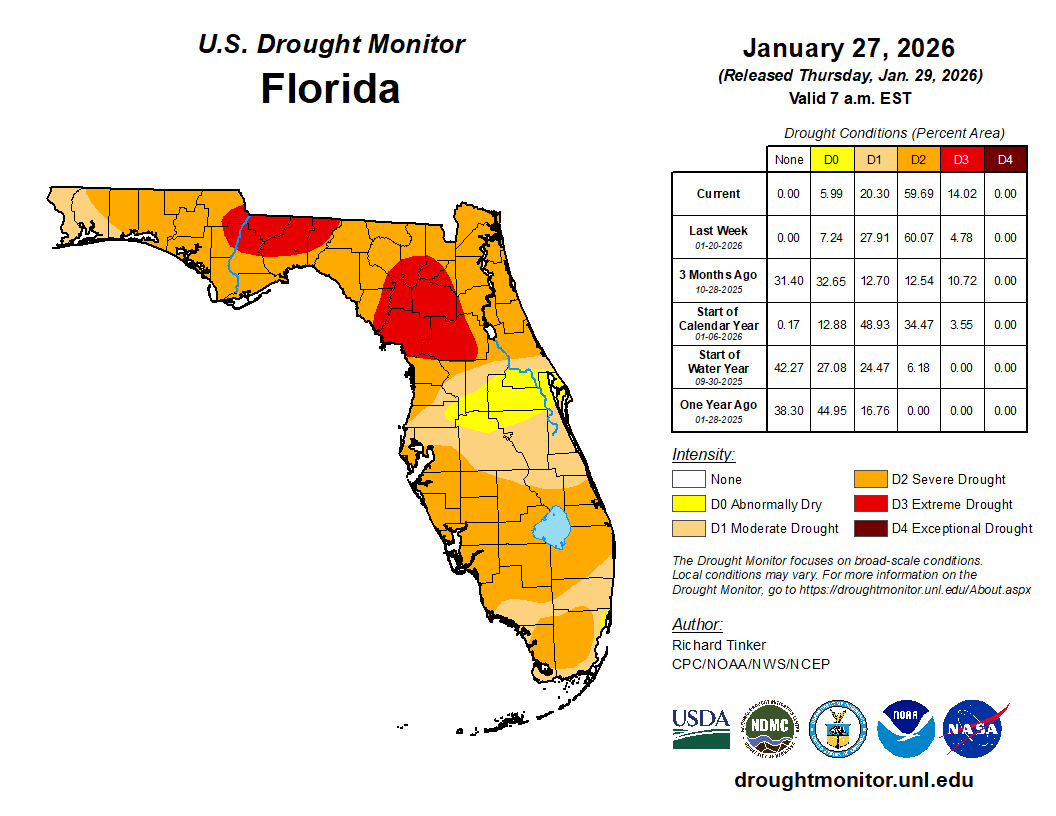
By mid-month, drought continued to affect nearly all of Florida with 92% of the state in some level of drought (D1-D4). Drought conditions have caused some harm to agricultural pasture conditions, elevated fire risk, and decreased streamflows and some reservoir levels. In mid-January, approximately 5% of the state was in extreme drought (D3), 50% was in severe drought (D2), and 37% was in moderate drought (D1); about 8% of the state was abnormally dry (D0), according to the U.S. Drought Monitor. By the end of the month, approximately 14% of the state was in extreme drought (D3), 60% was in severe drought (D2), 20% was in moderate drought (D1), and 6% of the state was abnormally dry (D0) (Figure 2 below).
As of January 31, the Lake Okeechobee water level was 12.77 ft. above sea level (Feet-NGVD29), which is below average for this time of year. At the first of January, the water level was 13.33 ft. above sea level.
Figure 3. A graphical depiction of the latest drought conditions in Florida according to the U.S. Drought Monitor (courtesy of the National Drought Mitigation Center, University of Nebraska-Lincoln).
Agriculture-Related Impacts.
Appendix 1
Additional January departures from normal data for select Florida locations (source: NWS).
| Station | Average Temperature (˚F) | Departure from Normal (˚F) | Total Rainfall (in.) | Departure from Normal (in.) |
| Gainesville | 55.0 | +0.2 | 1.23 | -2.06 |
| Sarasota | 62.2 | -0.2 | 1.54 | -1.25 |
| Melbourne | 61.0 | -0.7 | 0.31 | -2.32 |
| Fort Myers | 64.6 | -0.1 | 0.51 | -1.92 |
| West Palm Beach | 67.1 | +0.8 | 0.43 | -3.04 |
Appendix 2
Select daily record low minimum temperatures tied or broken during January (compiled from NOAA).
| Station | Date | Record (˚F) | Broken/Tied | Last |
| Homestead | 2 | 40 | Broken | 44 in 2001 |
| Apalachicola | 16 | 25 | Broken | 27 in 1978 |
| Hastings | 16 | 28 | Tied | 28 in 1985 |
| Homestead | 16 | 36 | Broken | 40 in 2023 |
| Usher Tower | 16 | 21 | Broken | 23 in 1978 |
| Ochopee | 16 | 34 | Broken | 39 in 2023 |
| Marianna | 16 | 22 | Broken | 25 in 1959 |
| Gainesville | 16 | 24 | Broken | 28 in 1985 |
| Orlando | 16 | 31 | Broken | 35 in 1968 |
| Crestview | 16 | 22 | Broken | 23 in 1983 |
| Jacksonville | 16 | 22 | Broken | 25 in 1983 |
| Tallahassee | 16 | 19 | Broken | 20 in 1978 |
| Glen St. Mary | 20 | 9 | Broken | 19 in 1977 |
| Whiting Field NAS | 26 | 27 | Tied | 27 in 2001 |
| Mayo | 27 | 19 | Tied | 19 in 1985 |
| Niceville | 27 | 21 | Broken | 22 in 1985 |
| Marianna | 27 | 22 | Broken | 27 in 2000 |
| Pensacola | 27 | 22 | Broken | 24 in 1986 |
| Crestview | 27 | 21 | Broken | 23 in 2011 |
| Apalachicola | 29 | 26 | Broken | 28 in 2007 |
| Ochopee | 29 | 39 | Tied | 39 in 2022 |
| Tallahassee | 29 | 22 | Broken | 23 in 2004 |
| Quincy | 30 | 24 | Tied | 24 in 1973 |
Prepared by Florida Climate Center
Florida State University
Tallahassee, FL
Summary:
- Monthly mean temperatures in February were above normal in the Florida Panhandle and below normal in the Peninsula.
- Monthly precipitation totals in February were mostly below normal in Florida.
- Drought conditions persisted and extreme drought (D3) expanded across Florida during the month.
- A La Niña advisory continued during the past month with a transition to ENSO-neutral expected in February-April 2026 (60% chance).
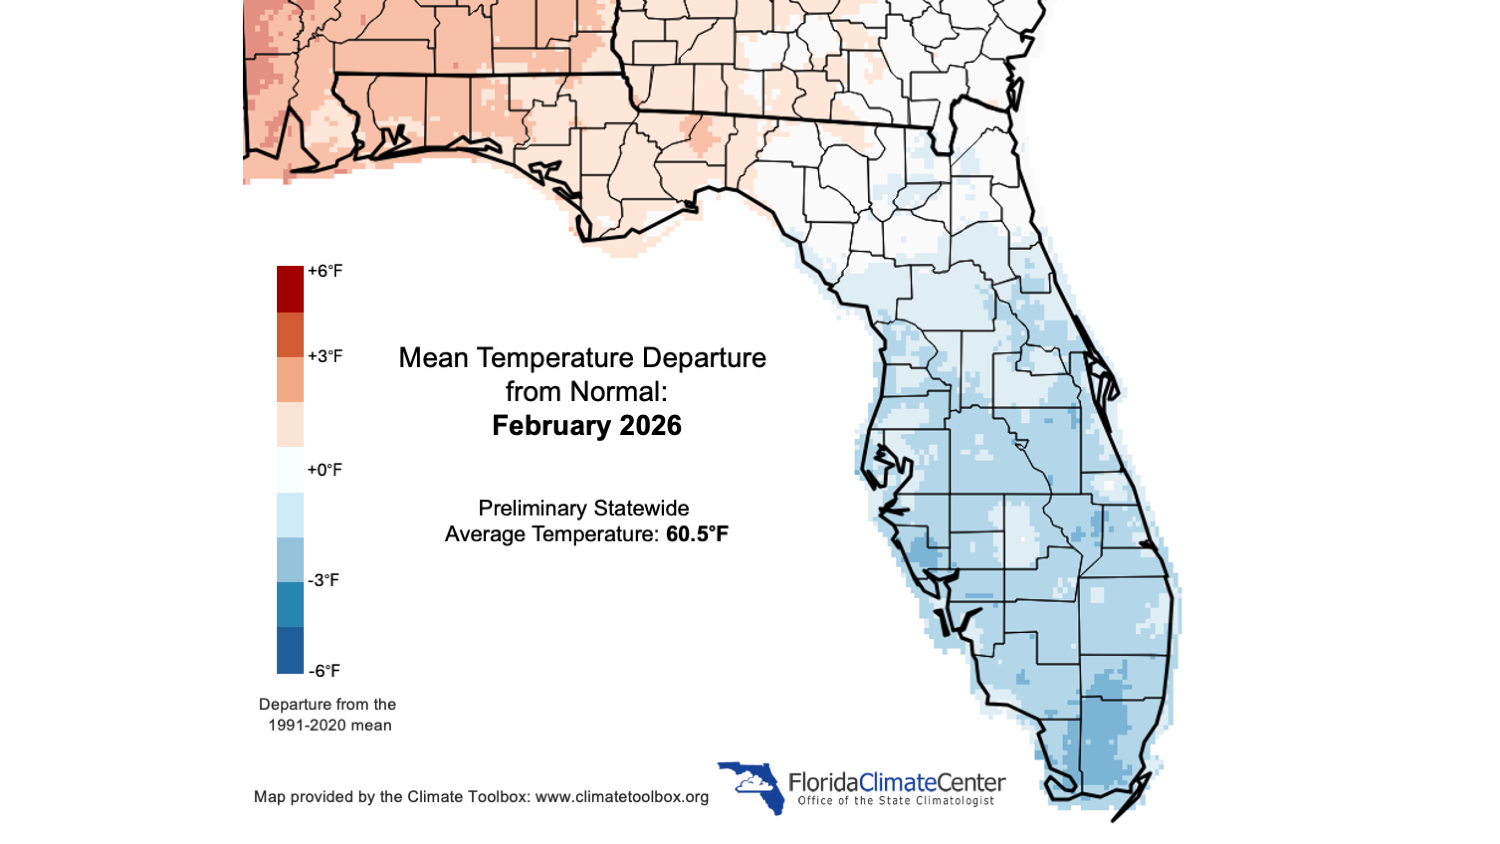
Monthly average temperatures in February were above normal in the Florida Panhandle and below normal in the Peninsula. Average monthly temperature departures from normal ranged from -5.3 ̊F at the Archbold Bio Station (near Lake Placid) to +1.4 ̊F in Pensacola for the month (see Table 1 and Appendix 1 for select cities). The frigid weather in late January continued in early February, and it was the coldest, or 2nd-coldest, start to February on record across the Florida Peninsula. In addition, the period from January 27 to February 9 was the coldest or one of the top 5 coldest periods across Florida. Most places were impacted with at least 2-4 consecutive nights of hard freezes, including as far south as Port Charlotte and West Palm Beach. Tallahassee and Gainesville each saw 8 consecutive nights below 30 ̊F. Many new daily record low minimum temperatures were broken early in the month. The record cold start to the month was followed by a warmup mid month but another round of much below average temperatures impacted the state during the last week of February. Large temperature swings this winter resulted in near average mean temperatures for winter overall (Dec-Feb). Appendix 2 provides select daily record low temperatures tied or broken during the month.
Table 1. February average temperatures and departures from normal ( ̊F) for select cities.
| Station | Mean Temperature | Departure from Normal |
| Pensacola | 58.2 | +1.4 |
| Tallahassee | 56.1 | +0.5 |
| Jacksonville | 56.1 | -1.4 |
| Orlando | 60.4 | -3.2 |
| Tampa | 61.4 | -3.3 |
| Miami | 66.4 | -4.3 |
| Key West | 68.6 | -3.7 |
Figure 1. Monthly average temperature departures from normal (°F) in Florida for February 2026.
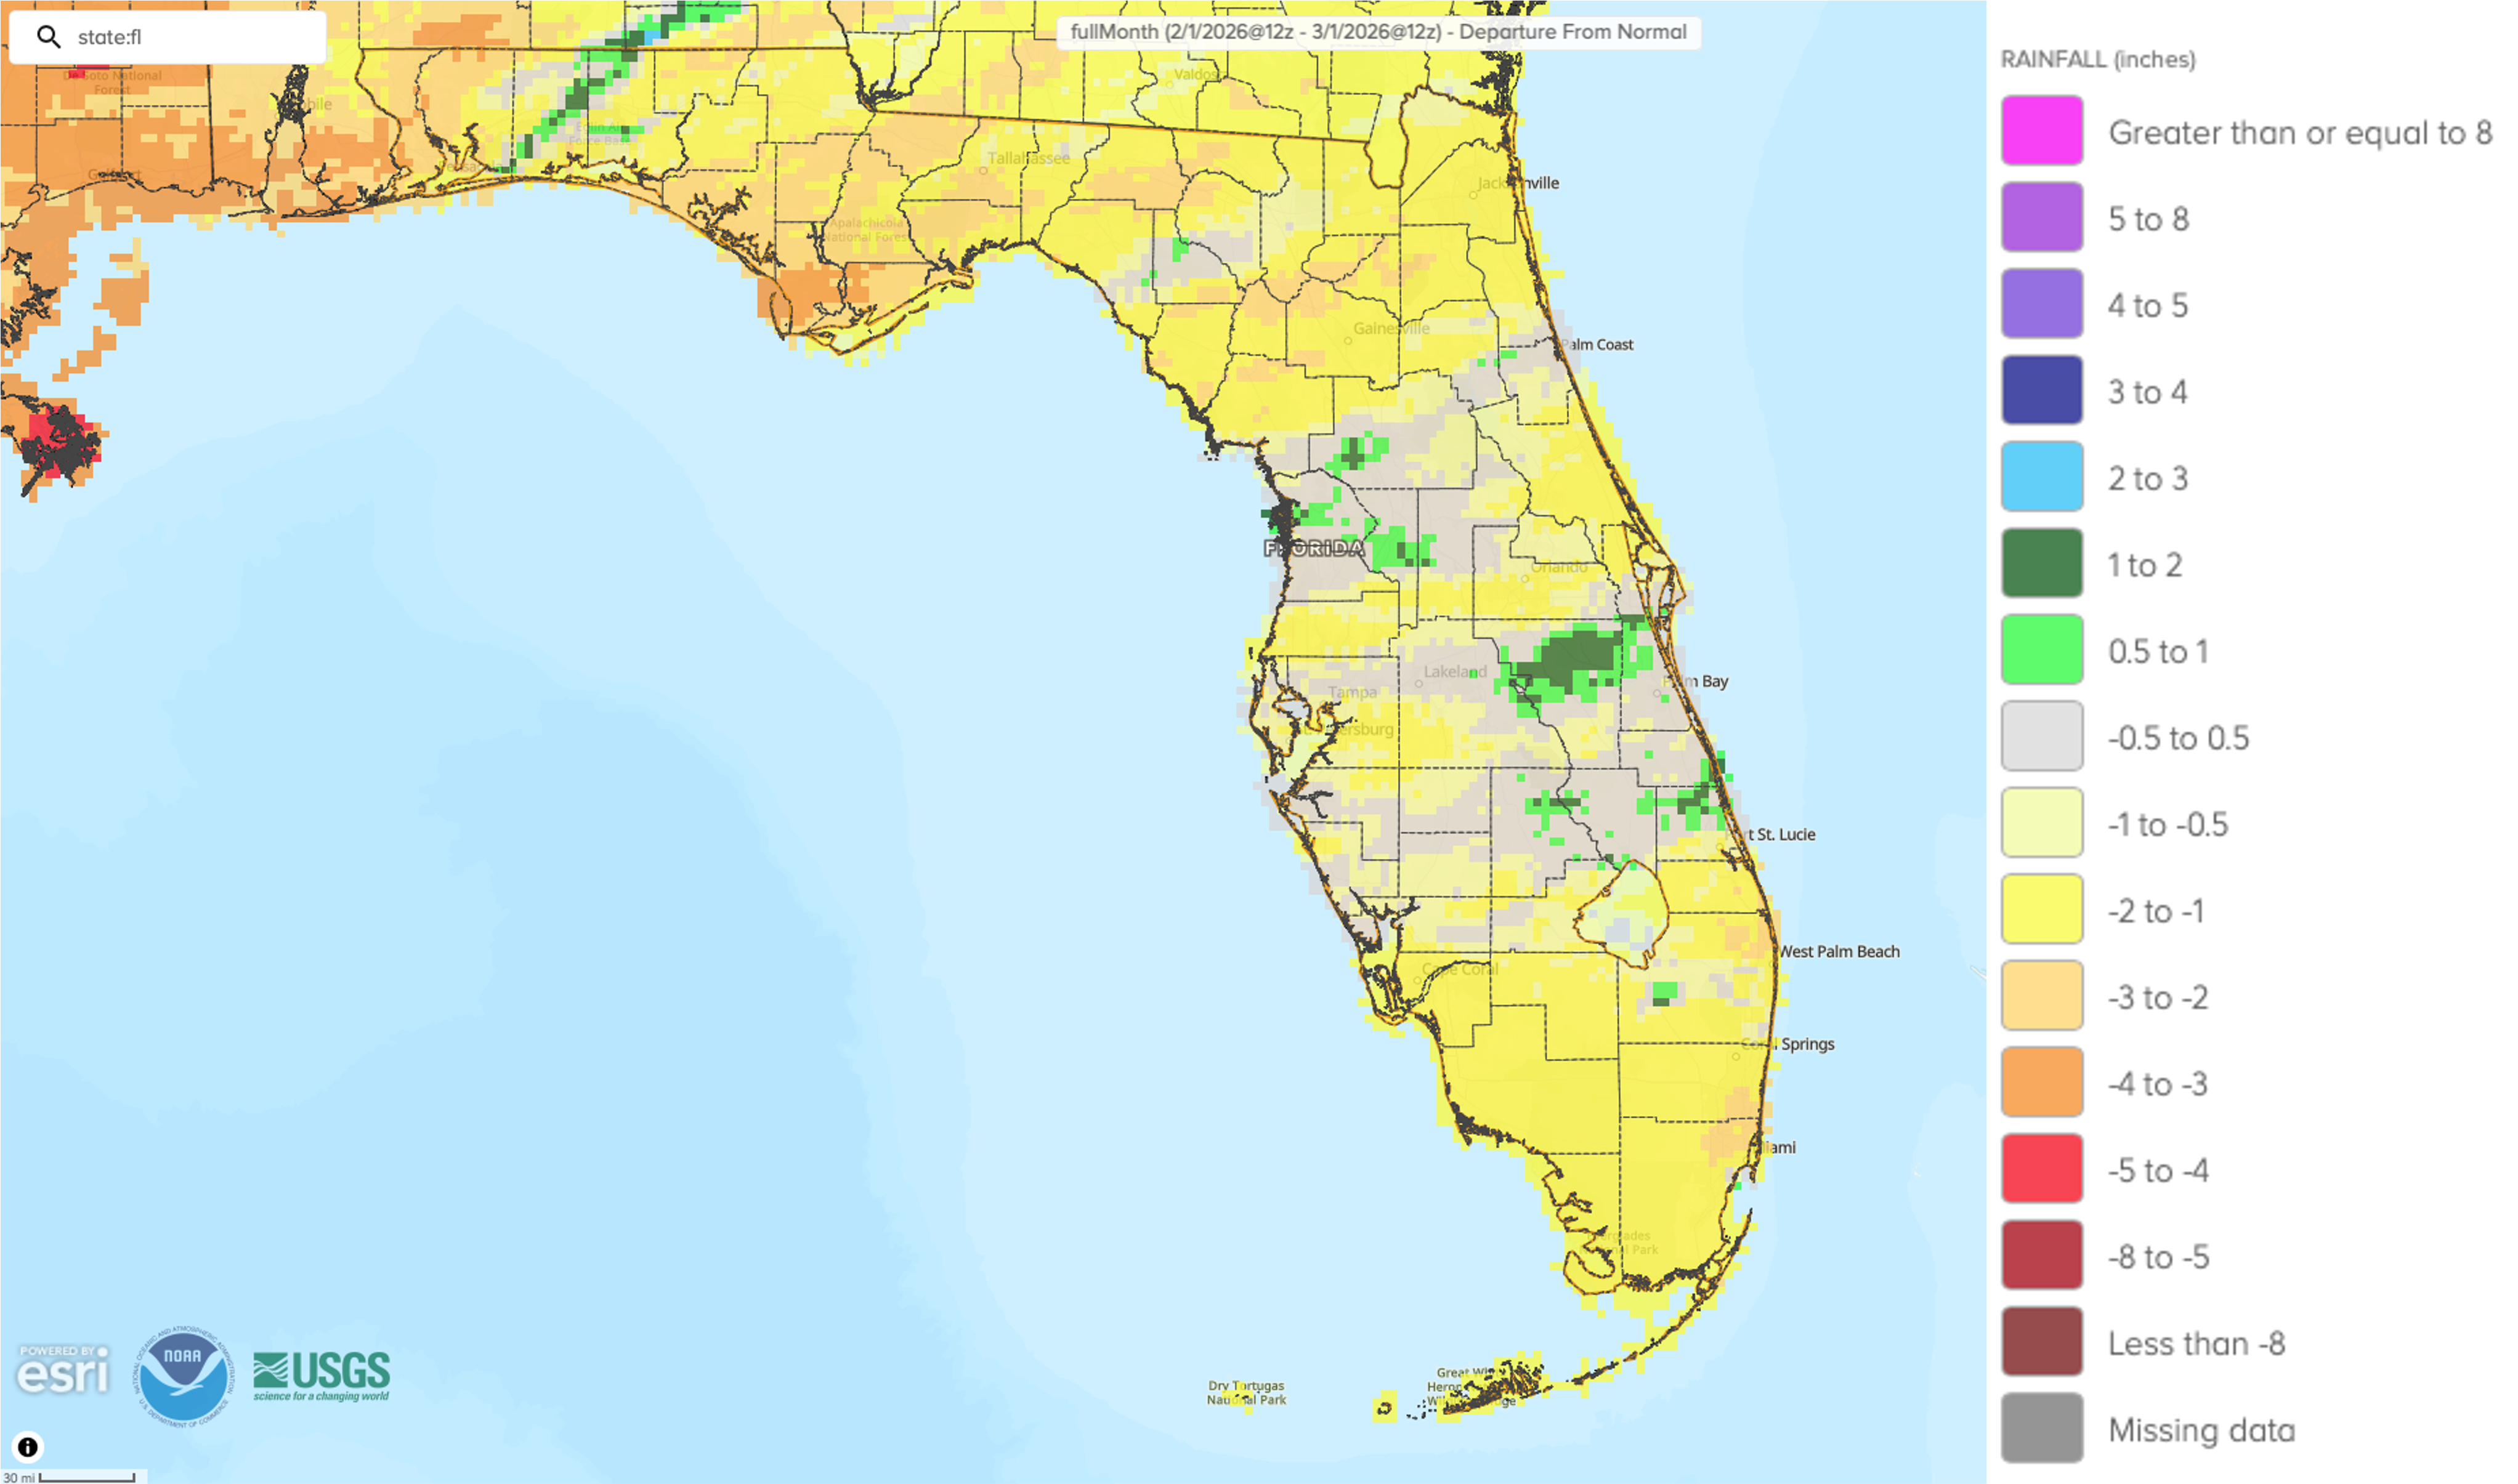
Monthly precipitation totals in February were mostly below normal. The monthly precipitation departures from normal ranged from -2.40 inches in Tallahassee to +0.24 inches in Sarasota (see Table 2 and Appendix 1 for select locations). February saw a continuation of below-average rainfall with widespread deficits of 1-2.5 inches and only isolated parts of central Florida registering near to above average rainfall for the month. Several locations experienced one of their top 10 driest months of February on record, including Jacksonville (3rd-driest based on 87 years), Miami (4th-driest based on 89 years), Clermont (5th-driest based on 66 years), and Ft. Lauderdale (6th-driest based on 87 years). Winter seasonal precipitation (DJF) had deficits on the order of 4-5 inches in the Panhandle, 2-3 inches in Central Florida, and 3-7 inches in South Florida. West Palm Beach tied for its 2nd-driest winter on record with 7.57 inches below average for the season (128 years); winter precipitation in Stuart was also 2nd-driest on record with 7.27 inches below average (66 years). The lack of rainfall over the past 6 months has led to very low streamflows in Florida.
Table 2. February precipitation totals and departures from normal (inches) for selected cities.
| Station | Total Rainfall | Departure from Normal |
| Pensacola | 3.26 | -1.51 |
| Tallahassee | 1.88 | -2.40 |
| Jacksonville | 0.67 | -2.19 |
| Orlando | 0.60 | -1.44 |
| Tampa | 2.04 | -0.58 |
| Miami | 0.08 | -2.07 |
| Key West | 0.09 | -1.45 |
Figure 2. A graphical depiction of the monthly rainfall departure from normal (inches) for February 2026 (courtesy of NOAA, NWS).
La Niña Advisory.
The tropical equatorial Pacific Ocean has remained in a La Niña state with below-average sea surface temperatures in the east-central region of the equatorial Pacific Ocean. Subsurface temperature anomalies increased with expanding above-average subsurface temperatures across the tropical Pacific Ocean. A transition to ENSO-neutral is favored in February-April 2026 (60% chance). ENSO-neutral is likely to continue through the Northern Hemisphere summer 2026 (56% chance in June-August 2026). The probability for an El Niño increases during late summer and beyond, with a 50-60% chance, though large uncertainty remains that far out.
Hazardous Weather Events in February.
According to the Local Storm Reports issued by the local National Weather Service offices serving Florida, there were 148 individual local reports of hazardous weather events recorded across the state during the month of February (see Table 3 for a breakdown by event type). Snow flurries were reported in the overnight hours of January 31st to February 1st in west-central and southwest Florida, including in Manatee, Sarasota, Hillsborough, Pinellas, Charlotte, and Lee Counties, but no accumulation occurred. Wildfires picked up during the month with continued dry conditions and gusty winds. During the first week of February, wildfires in Putnam County led to school and road closures. On the 2nd, bush fires broke out in Brevard County and a fire shut down a 7-mile stretch of I-95 in both directions due to low visibility but was quickly contained. On the 5th, a wildfire in Flagler County forced the evacuation of 25 residences and a building. Two wildfires broke out late during the month, one in western Broward County near I-75 and US 27 in the Everglades and another wildfire near the runway of the Homestead General Airport. The largest wildfire was the National Fire in the Big Cypress National Preserve in South Florida which had burned more than 35,000 acres, affected visibility in the region, and closed several roadways including a portion of I-75 known as Alligator Alley.
Table 3. Breakdown of storm reports submitted in Florida during the month of February (compiled from Iowa State University/Iowa Environmental Mesonet).
| Report Type | Number of Reports |
| Heavy Rain | 0 |
| Dense Fog | 0 |
| Hail | 9 |
| Marine Thunderstorm Wind | 24 |
| Non-Thunderstorm Wind Gust | 45 |
| Tornado/Waterspout/Funnel Cloud | 0 / 1 / 2 |
| Thunderstorm Wind Damage | 13 |
| Non-Thunderstorm Wind Damage | 2 |
| Thunderstorm Wind Gust | 20 |
| Wildfire | 22 |
| Snow Flurries | 10 |
Daily Record Events in February.
Table 4. Summary of daily records broken or set in Florida in February 2026 (source: NCEI Daily Weather Records).
| Category | Number of Records |
| Highest daily max. temp. | 59 |
| Highest daily min. temp. | 19 |
| Lowest daily max. temp. | 72 |
| Lowest daily min. temp. | 120 |
| Highest daily precipitation | 6 |
| Total | 276 |
Drought-Related Impacts.
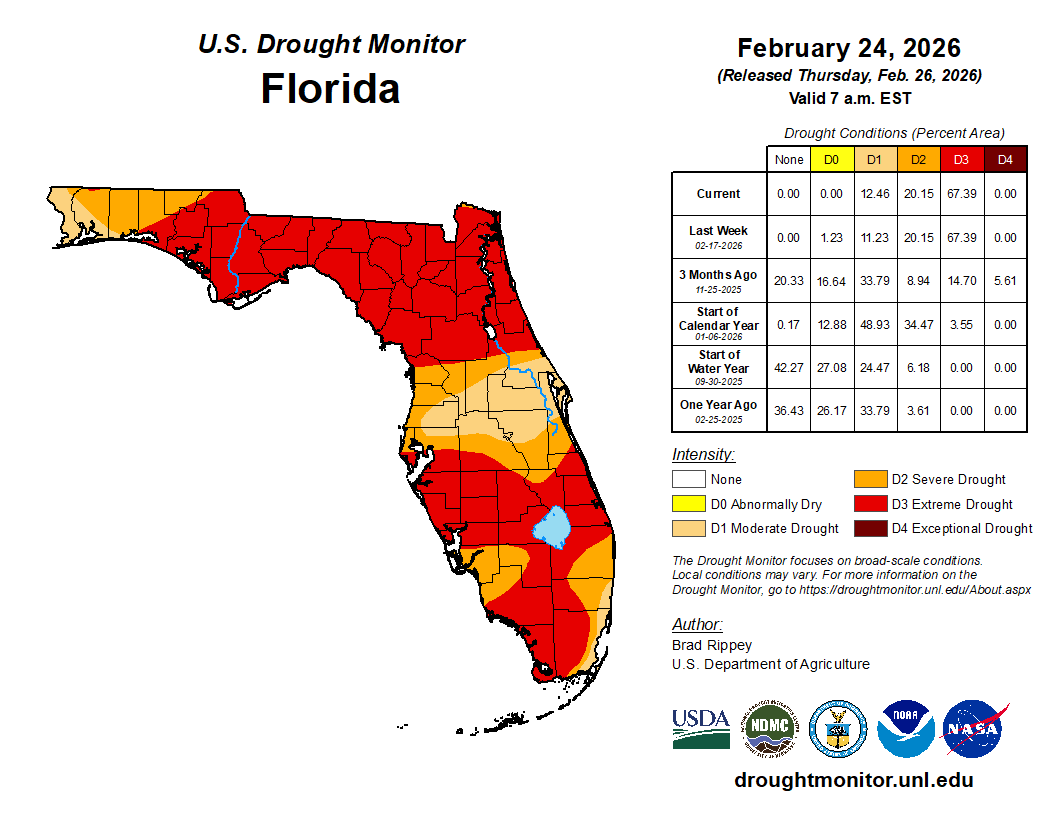
By mid-month, drought continued to affect virtually all of Florida with 99% of the state in some level of drought (D1-D4). As of February 17, approximately 67% of the state was in extreme drought (D3), 20% was in severe drought (D2), and 11% was in moderate drought (D1); about 1% of the state was abnormally dry (D0), according to the U.S. Drought Monitor. By the end of the month, approximately 67% of the state was in extreme drought (D3), 20% was in severe drought (D2), and 12% was in moderate drought (D1); no areas were considered abnormally dry (D0) (Figure 2 below).
As of February 28, the Lake Okeechobee water level was 12.27 ft. above sea level (Feet-NGVD29), which is below average for this time of year. At the first of February, the water level was 12.72 ft. above sea level.
Figure 3. A graphical depiction of the latest drought conditions in Florida according to the U.S. Drought Monitor (courtesy of the National Drought Mitigation Center, University of Nebraska-Lincoln).
Agriculture-Related Impacts.
Following a dry fall and winter, concerns for spring crops are increasing for producers. At the end of February, the entire state was experiencing some level of drought conditions. The continuation of dry weather in most areas along with widespread hard freezes during the first part of the month impacted crop conditions. The hard freezes damaged strawberries, blueberries, sugarcane, citrus, and vegetable crops. The availability of water for freeze protection during the ongoing drought was a concern as well. Winter freezes overall have led to an estimated $3.2 billion in losses to Florida agriculture this season. Ongoing rainfall deficits impacted winter grazing and cover crops, and watermelon and rice planting were halfway completed by month’s end. Hay and supplemental feeding for livestock continued, though hay supplies were tight due to poor pasture quality due to months of dry, cold conditions. For more information, consult the Crop Progress - State Stories, which are published by the USDA’s National Agricultural Statistics Service each year from December – March.
Appendix 1
Additional February departures from normal data for select Florida locations (source: NWS).
| Station | Average Temperature (˚F) | Departure from Normal (˚F) | Total Rainfall (in.) | Departure from Normal (in.) |
| Gainesville | 55.9 | -2.5 | 0.87 | -1.80 |
| Sarasota | 61.7 | -3.1 | 2.16 | +0.24 |
| Melbourne | 60.3 | -3.7 | 2.06 | +0.08 |
| Fort Myers | 63.9 | -3.4 | 0.47 | -1.31 |
| West Palm Beach | 65.3 | -3.1 | 0.75 | -1.88 |
Appendix 2
Select daily record low minimum temperatures tied or broken during February (compiled from NOAA).
| Station | Date | Record (˚F) | Broken/Tied | Last |
| Apalachicola | 1 | 20 | Broken | 26 in 1977 |
| Daytona Beach | 1 | 23 | Broken | 31 in 1965 |
| Deland | 1 | 22 | Broken | 26 in 1936 |
| Fernandina Beach | 1 | 22 | Broken | 25 in 1936 |
| Inverness | 1 | 22 | Broken | 23 in 2022 |
| Lake City | 1 | 19 | Broken | 22 in 1909 |
| Lisbon | 1 | 23 | Broken | 30 in 1979 |
| Ocala | 1 | 20 | Broken | 24 in 1977 |
| Stuart | 1 | 28 | Broken | 36 in 1979 |
| Titusville | 1 | 25 | Broken | 30 in 1965 |
| Wauchula | 1 | 24 | Broken | 26 in 2022 |
| Marianna | 1 | 20 | Broken | 22 in 1951 |
| Orlando | 1 | 24 | Broken | 33 in 1979 |
| Gainesville | 1 | 20 | Broken | 28 in 1965 |
| Miami | 1 | 35 | Broken | 43 in 1979 |
| Tampa | 1 | 29 | Broken | 33 in 1965 |
| West Palm Beach | 1 | 30 | Broken | 38 in 1979 |
| Lakeland | 1 | 24 | Broken | 33 in 1979 |
| Jacksonville | 1 | 22 | Broken | 24 in 1977 |
| Fort Lauderdale | 2 | 34 | Broken | 38 in 1979 |
| Fort Pierce | 2 | 27 | Broken | 34 in 1980 |
| Homestead | 2 | 33 | Broken | 42 in 2003 |
| Kissimmee | 2 | 24 | Broken | 31 in 1980 |
| Lake City | 2 | 19 | Broken | 21 in 2005 |
| Melbourne | 2 | 26 | Broken | 33 in 1980 |
| Plant City | 2 | 26 | Tied | 26 in 1936 |
| Gainesville | 2 | 22 | Broken | 30 in 2013 |
| Vero Beach | 2 | 27 | Broken | 37 in 1951 |
| Tallahassee | 2 | 18 | Broken | 19 in 1951 |
| Melbourne | 3 | 29 | Broken | 35 in 1979 |
| Orlando | 3 | 30 | Broken | 33 in 1976 |
| Marianna | 24 | 26 | Broken | 31 in 2002 |
| Gainesville | 24 | 25 | Tied | 25 in 1989 |
| Crestview | 24 | 24 | Tied | 24 in 1978 |
| Fort Lauderdale | 25 | 44 | Broken | 49 in 2010 |
| Usher Tower | 25 | 22 | Broken | 24 in 1989 |
Prepared by Florida Climate Center
Florida State University
Tallahassee, FL
Summary:
- Monthly mean temperatures in March were above normal in Florida.
- Monthly precipitation totals in March were generally below normal, except in portions of South Florida which received above-average rainfall.
- Widespread drought conditions persisted with degradation in northern Florida; by the end of the month nearly all of Florida remained in drought (D1-D4) with about 80% of the state in either extreme (D3) or exceptional (D4) drought.
- A La Niña advisory continued during the past month but a transition to ENSO-neutral is expected soon and is favored to continue through May-July 2026 (55% chance), with increasing chances of El Niño during summer (62% chance June-August 2026).
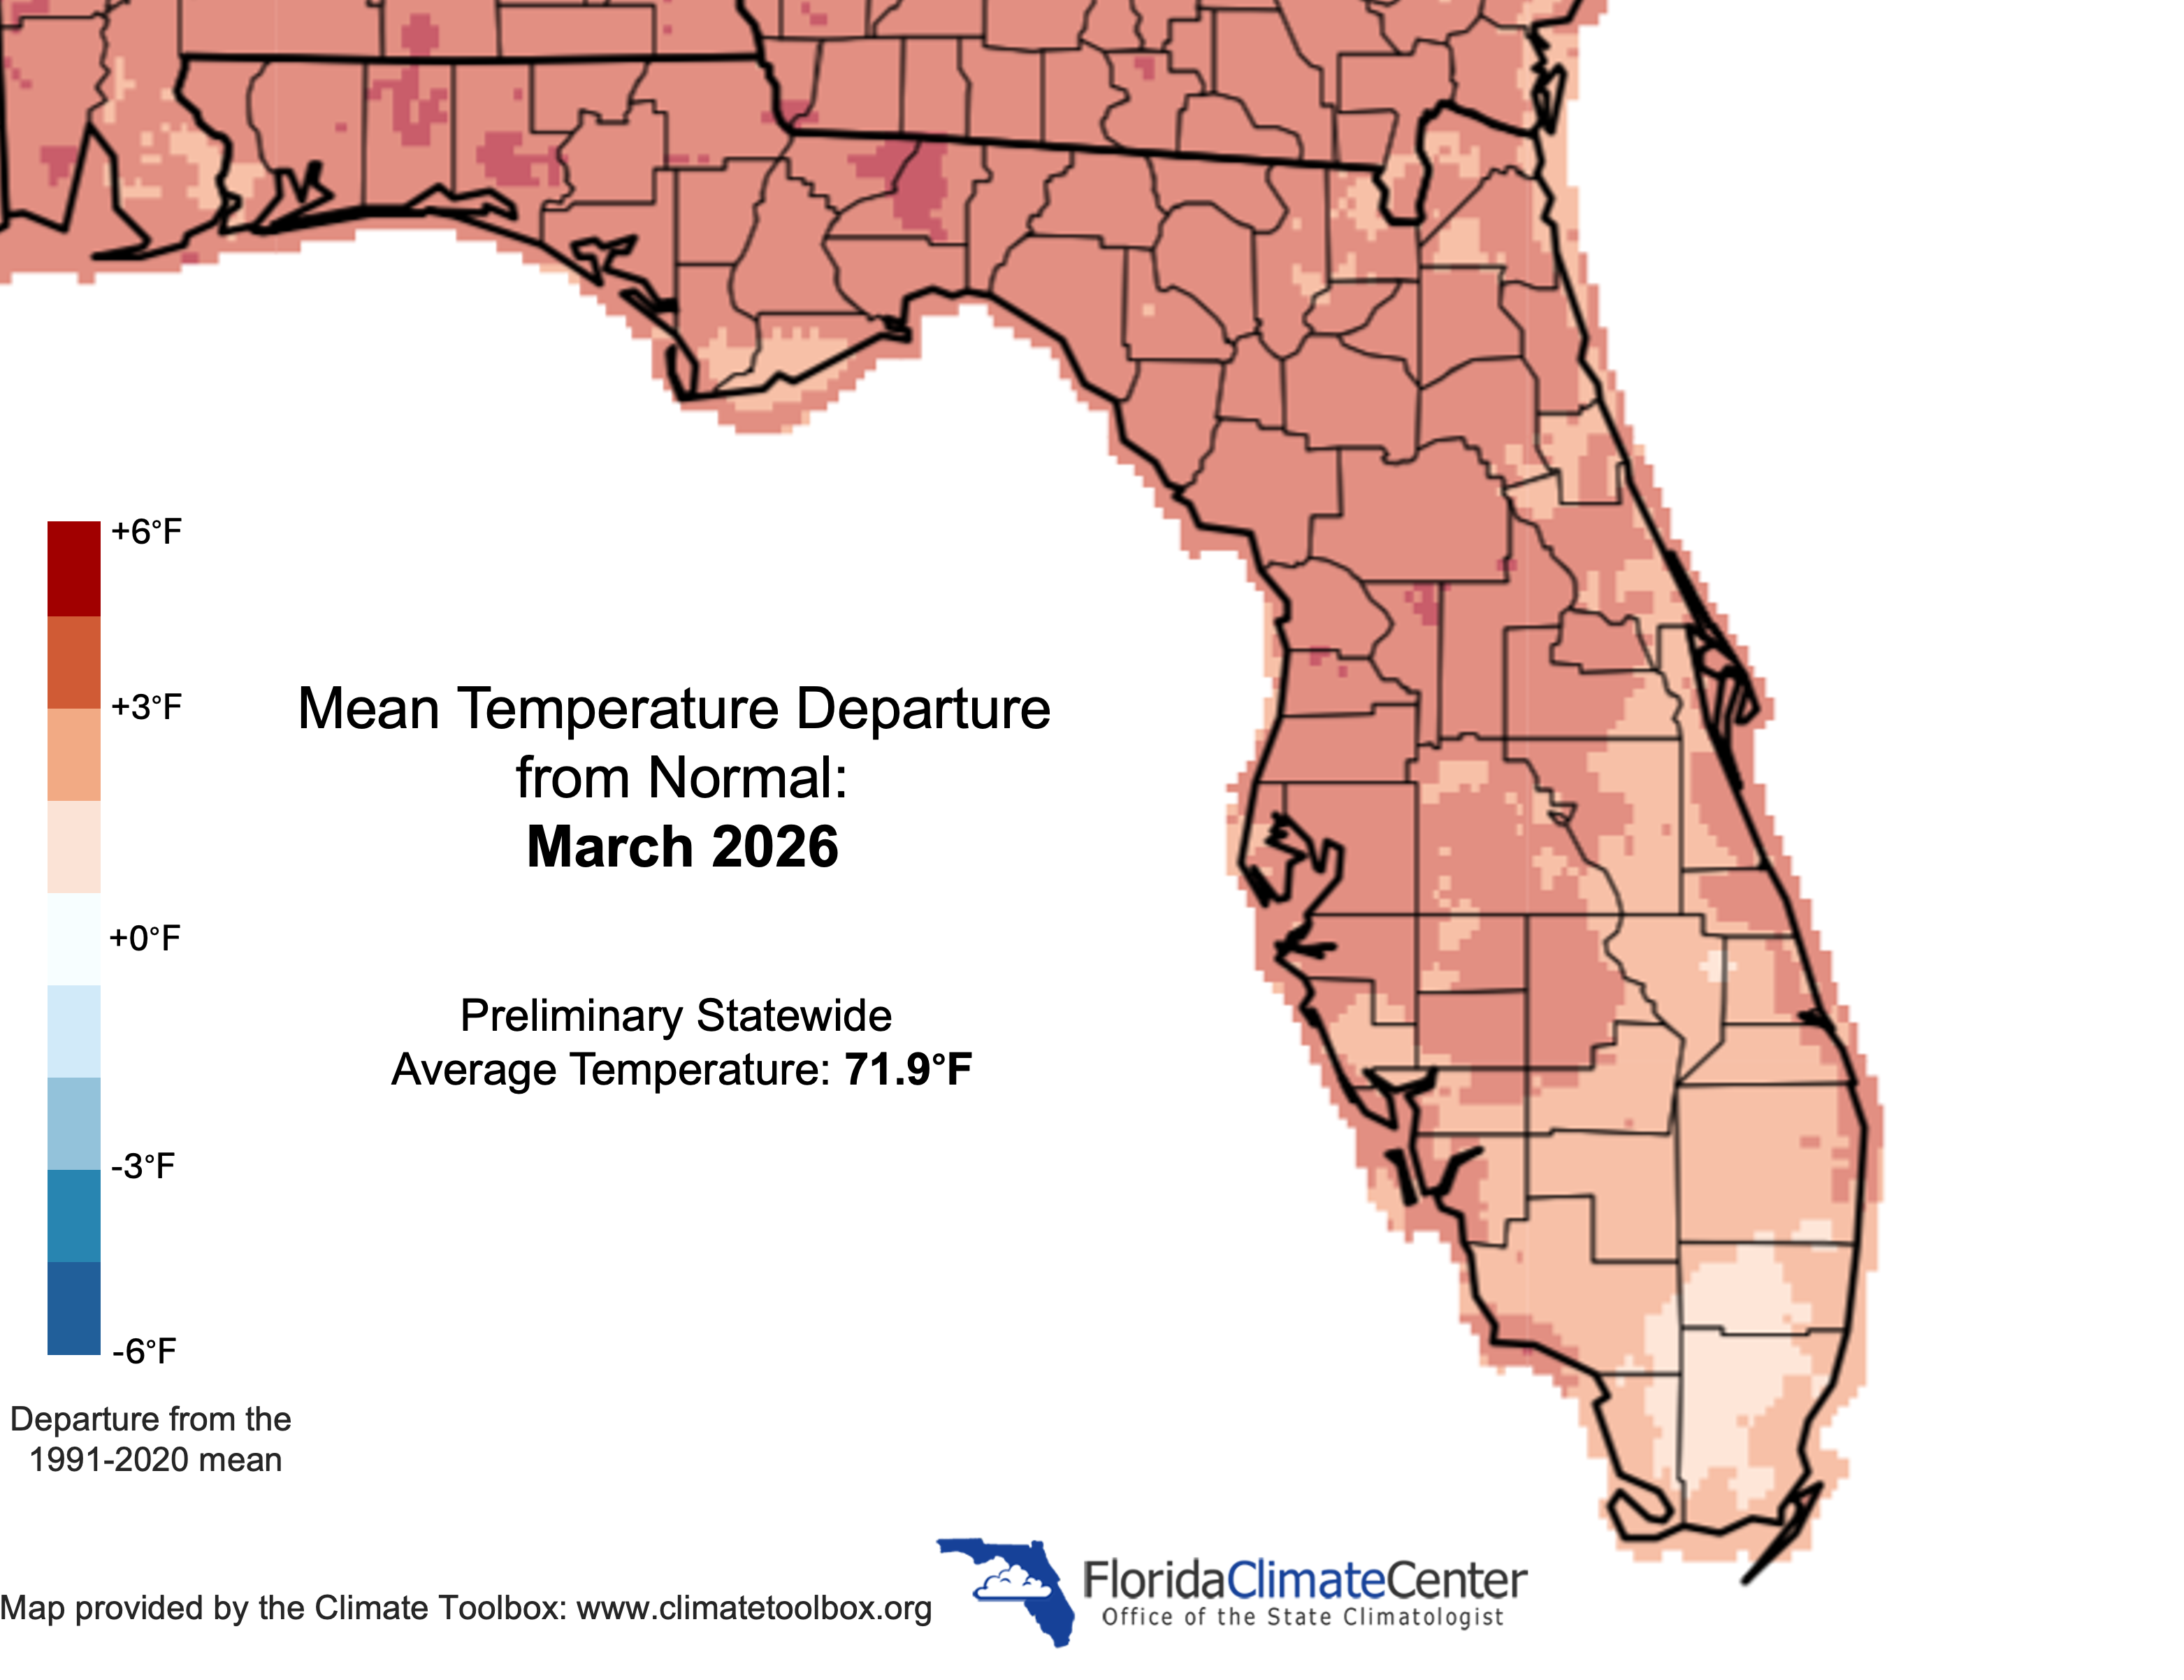
Monthly average temperatures in March were above normal in Florida. Average monthly temperature departures from normal ranged from +1.9 ̊F in Miami to +5.1 ̊F in Gainesville for the month (see Table 1 and Appendix 1 for select cities). Warm and even summer-like temperatures were felt across the state in March. On March 6, Tampa reached a maximum temperature of 90 ̊F which was the earliest 90 ̊F day in the season on record (prior record was March 16, 1945). On March 10, Jacksonville reached a maximum temperature of 92 ̊F which was the earliest 92 ̊F day or higher on record (prior record was March 28, 2020 at 94 ̊F). On March 11, maximum temperatures in the upper 80s to low 90s were felt across northern Florida, but a strong cold front affected the state mid-month (16-20th), bringing mean temperatures well below normal across the state along with a late-season freeze on the 18th that affected the Panhandle and north-central Florida. Monthly average temperatures for most stations ended up ranking in the top 10 warmest on record for March statewide. Select daily record high maximum temperatures tied or broken during March are provided in Appendix 2.
Table 1. March average temperatures and departures from normal ( ̊F) for select cities.
| Station | Mean Temperature | Departure from Normal |
| Pensacola | 65.5 | +3.2 |
| Tallahassee | 65.5 | +4.1 |
| Jacksonville | 66.3 | +3.9 |
| Orlando | 72.2 | +4.9 |
| Tampa | 72.8 | +4.2 |
| Miami | 75.0 | +1.9 |
| Key West | 77.0 | +2.6 |
Figure 1. Monthly average temperature departures from normal (°F) in Florida for March 2026.
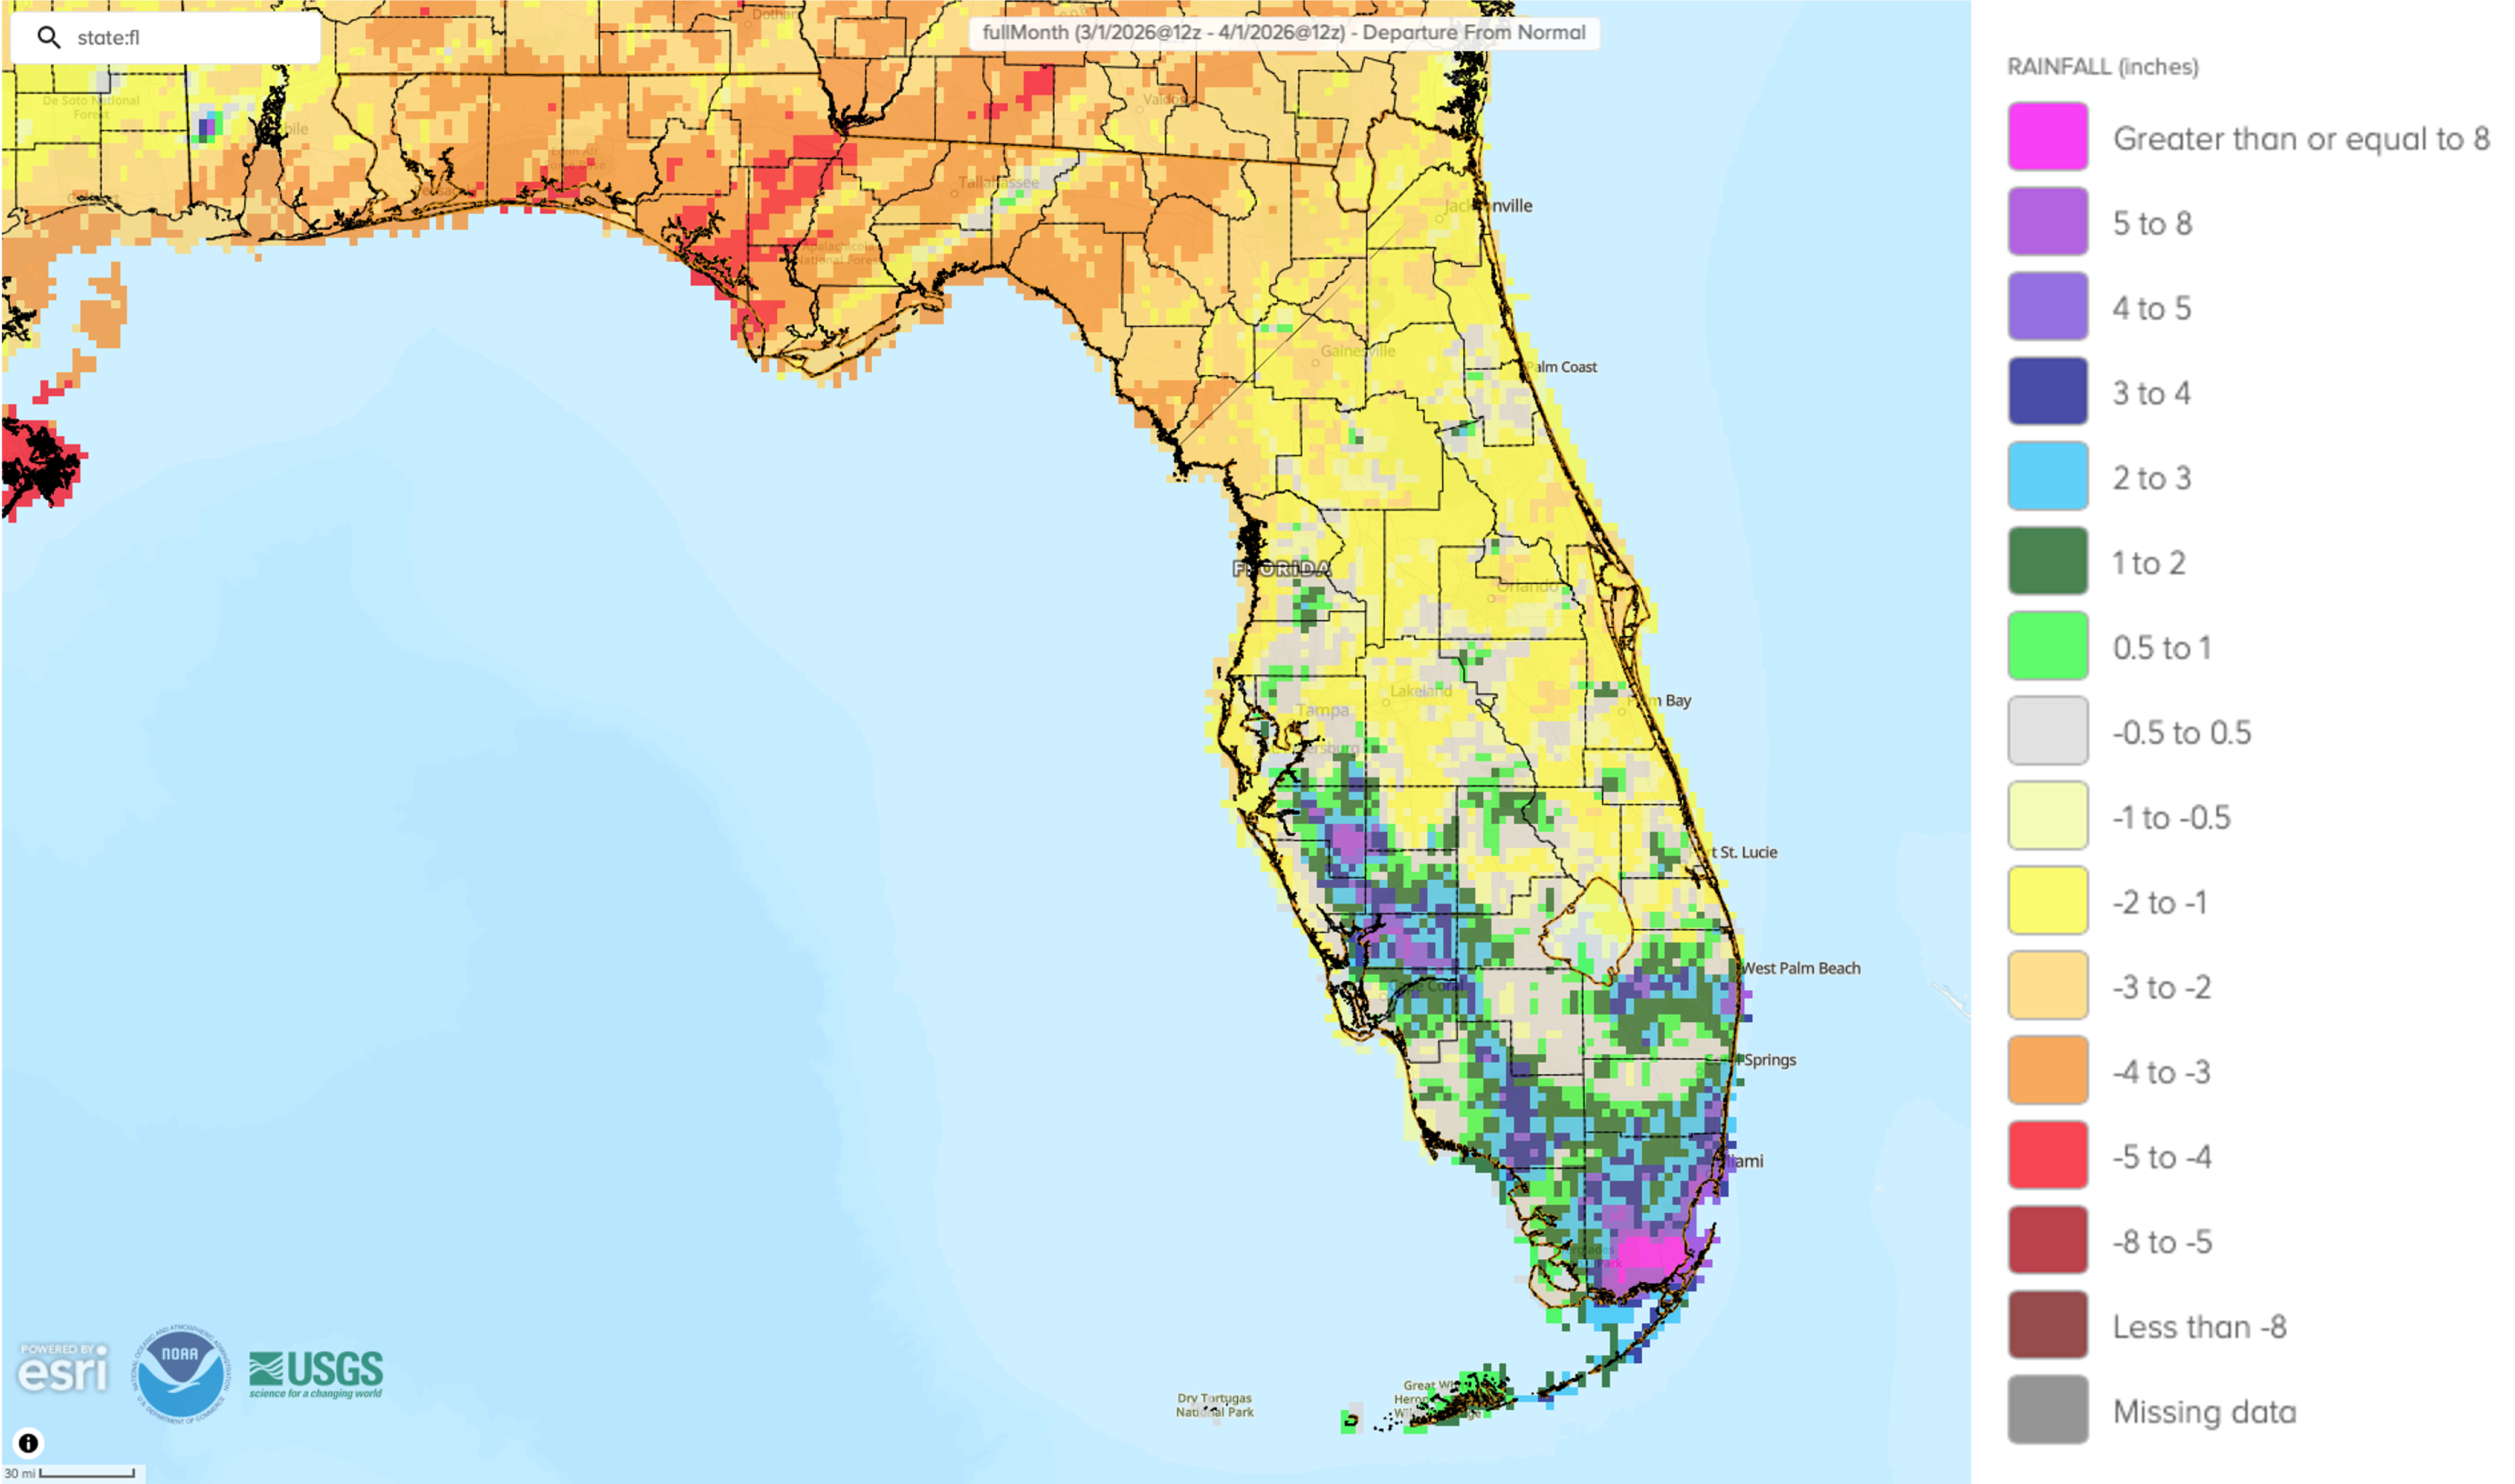
Monthly precipitation totals in March were generally below normal, except in portions of South Florida which received above-average rainfall. The monthly precipitation departures from normal ranged from -3.63 inches in Tallahassee to +2.53 inches in West Palm Beach (see Table 2 and Appendix 1 for select locations). Rainfall in March has helped somewhat with drought conditions but was generally not enough to dampen the long-term drought. The exception has been in South and Southeast Florida. These areas received widespread 2-6 inches of rainfall with an isolated area of 10-15 inches in southern Miami-Dade County, which led to drought improvement of one category during the month. Tallahassee measured its 9th-driest March on record (86 years) and Gainesville recorded its 7th-driest March on record (102 years). Continued impacts from persistent drought conditions resulted in the return of an area of Exceptional Drought (D4) in portions of North Florida. According to the Southeast Regional Climate Center’s Climate Perspectives tool, the past six months (October 1, 2025 to March 31, 2026) have been very dry, with precipitation deficits ranging from 8-14 inches below average across northern Florida and parts of southwest Florida. During this 6-month period, Tallahassee experienced record dryness (84 years) and this period was 2nd-driest on record in Apalachicola (83 years), Jacksonville (86 years), Gainesville (51 years), and Venice (62 years).
Table 2. March precipitation totals and departures from normal (inches) for selected cities.
| Station | Total Rainfall | Departure from Normal |
| Pensacola | 1.95 | -3.30 |
| Tallahassee | 1.61 | -3.63 |
| Jacksonville | 1.70 | -1.59 |
| Orlando | 1.19 | -1.84 |
| Tampa | 2.76 | +0.24 |
| Miami | 4.39 | +1.93 |
| Key West | 2.59 | +1.06 |
Figure 2. A graphical depiction of the monthly rainfall departure from normal (inches) for March 2026 (courtesy of NOAA, NWS).
La Niña Advisory.
The tropical equatorial Pacific Ocean remained in a La Niña state during the past month. Below-average sea surface temperatures persisted in the east-central region of the equatorial Pacific Ocean but showed weakening, and equatorial subsurface temperatures continued to increase. A transition to ENSO-neutral is expected in the next month and is favored to continue through May-July 2026 (55% chance). The probability for an El Niño increases during summer, with a 62% chance June-August 2026, which is likely to persist through at least the end of the year.
Hazardous Weather Events in March.
According to the Local Storm Reports issued by the local National Weather Service offices serving Florida, there were 359 individual local reports of hazardous weather events recorded across the state during the month of March (see Table 3 for a breakdown by event type). On March 5, dense fog was reported in Baker County which led to traffic accidents and two injuries on a section of I-10. Rip currents led to one fatality due to drowning at Ormond Beach on the 14th and two injuries at Boynton Beach that same day. While no tornadoes were reported in Florida during the month, severe thunderstorms on the 15th resulted in reports of ping pong to golf ball sized hail (1.50 - 1.75 inches) in Brevard County. Parts of the state continued to see a high risk of wildfire with dry and windy conditions. A significant 500-acre wildfire in the Mossy Pond area of Calhoun County began on the 21st and destroyed vehicles, 16 homes, and displaced approximately 40 people, which has since been contained. There have been an estimated 1,500 wildfires in Florida so far this year.
Table 3. Breakdown of storm reports submitted in Florida during the month of March (compiled from Iowa State University/Iowa Environmental Mesonet).
| Report Type | Number of Reports |
| Heavy Rain | 2 |
| Dense Fog | 1 |
| Flood | 3 |
| Hail | 33 |
| Lightning | 2 |
| Marine Thunderstorm Wind | 69 |
| Non-Thunderstorm Wind Gust | 25 |
| Tornado/Waterspout/Funnel Cloud | 0 / 4 / 1 |
| Thunderstorm Wind Damage | 68 |
| Non-Thunderstorm Wind Damage | 1 |
| Thunderstorm Wind Gust | 144 |
| Wildfire | 4 |
| Rip Currents | 2 |
Daily Record Events in March.
Table 4. Summary of daily records broken or set in Florida in March 2026 (source: NCEI Daily Weather Records).
| Category | Number of Records |
| Highest daily max. temp. | 43 |
| Highest daily min. temp. | 23 |
| Lowest daily max. temp. | 25 |
| Lowest daily min. temp. | 10 |
| Highest daily precipitation | 16 |
| Total | 117 |
Drought-Related Impacts.
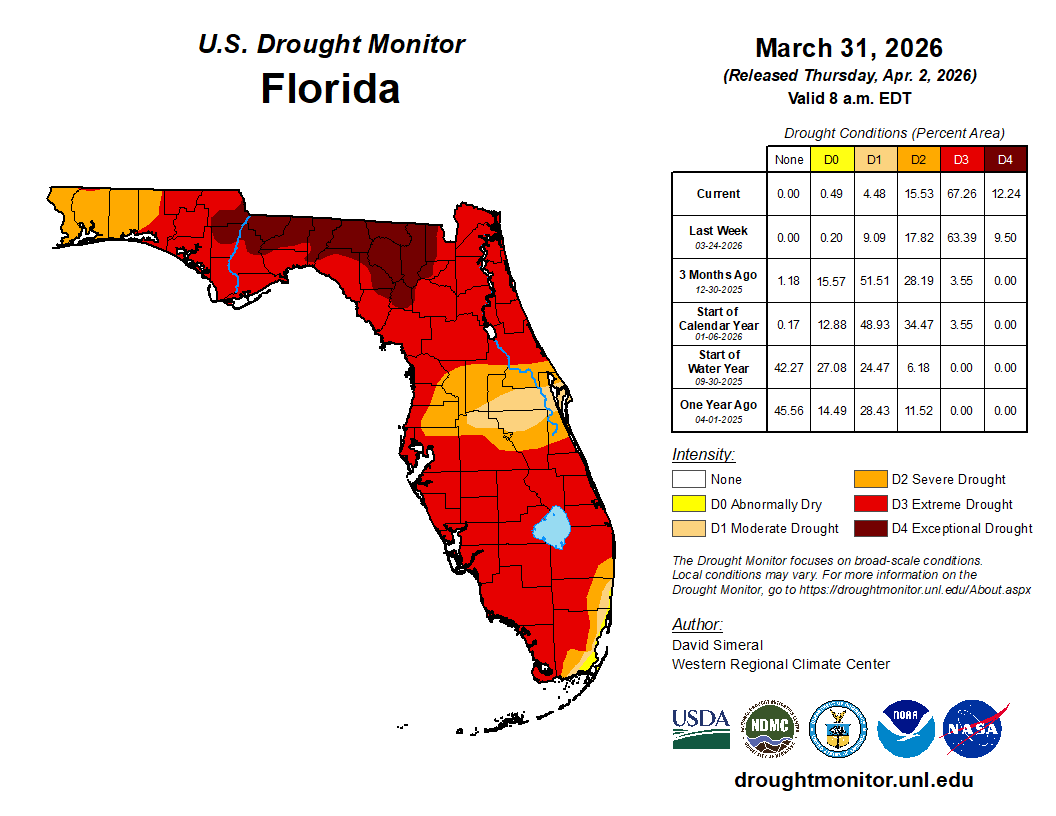
Drought conditions remained widespread and persistent, with some degradation during the month. By mid-month, drought continued to affect virtually all of Florida with 99.8% of the state experiencing some level of drought (D1-D4). As of March 17, approximately 2% of the state was in exceptional drought (D4), 71% of the state in extreme drought (D3), 18% in severe drought (D2), and 9% was in moderate drought (D1), with <1% of the state abnormally dry (D0), according to the U.S. Drought Monitor. By month’s end, approximately 12% of the state was in exceptional drought (D4), 67% was in extreme drought (D3), 16% was in severe drought (D2), and 4% was in moderate drought (D1); about 0.5% was considered abnormally dry (D0) (Figure 2 below).
As of March 31, the Lake Okeechobee water level was 12.02 ft. above sea level (Feet-NGVD29), which is below average for this time of year. At the first of March, the water level was 12.29 ft. above sea level.
Figure 3. A graphical depiction of the latest drought conditions in Florida according to the U.S. Drought Monitor (courtesy of the National Drought Mitigation Center, University of Nebraska-Lincoln).
Agriculture-Related Impacts.
Extreme or Exceptional Drought (D3-D4) covered about 80% of the state by the end of the month, which is the largest proportion of extreme to exceptional drought in the state in at least 25 years. All or virtually all of Florida has experienced some level of drought (D1-D4) for the past 8 consecutive weeks. Rainfall was more mixed this month, with some regions experiencing above average rainfall, mainly in the southern Peninsula. Most rainfall was scattered and mostly insufficient to close rainfall deficit gaps and ease the impacts that have been felt over the past several months. Temperatures stayed above average for much of the month. Winter wheat and small grains were in good to fair condition but will be impacted without more rain. Corn planting began in several counties but was slowed in some fields due to insufficient moisture. Sugarcane and watermelon have begun to show the negative impacts from the freeze in early February, but strawberries, squash and other vegetable crops are progressing well. Cattle was reported to be in fair to good condition while range and pastures are in fair condition, but many have been adversely impacted by drought with reports of very dry pastures and low to dry watering holes. For more information, consult the Crop Progress - State Stories, which are published by the USDA’s National Agricultural Statistics Service each year from December – March.
Appendix 1
Additional March departures from normal data for select Florida locations (source: NWS).
| Station | Average Temperature (˚F) | Departure from Normal (˚F) | Total Rainfall (in.) | Departure from Normal (in.) |
| Gainesville | 67.8 | +5.1 | 0.57 | -2.92 |
| Sarasota | 72.9 | +4.8 | 1.87 | -0.98 |
| Melbourne | 71.6 | +4.2 | 3.27 | +0.58 |
| Fort Myers | 74.3 | +4.0 | 2.02 | -0.05 |
| West Palm Beach | 74.6 | +3.5 | 5.82 | +2.51 |
Appendix 2
Select daily record high maximum temperatures tied or broken during March (compiled from NOAA).
| Station | Date | Record (˚F) | Broken/Tied | Last |
| Homestead | 1 | 92 | Broken | 90 in 2023 |
| Tampa | 2 | 86 | Tied | 86 in 1945 |
| Tampa | 5 | 89 | Broken | 87 in 2020 |
| Venice | 5 | 88 | Broken | 87 in 2022 |
| Fort Myers | 5 | 90 | Tied | 90 in 2022 |
| Ochopee | 6 | 90 | Broken | 89 in 2023 |
| Gainesville | 6 | 88 | Broken | 87 in 2023 |
| Tampa | 6 | 90 | Broken | 89 in 2022 |
| Crestview | 6 | 84 | Broken | 83 in 2022 |
| Marianna | 7 | 86 | Broken | 85 in 2023 |
| Orlando | 8 | 88 | Broken | 86 in 2022 |
| Miles City | 9 | 93 | Broken | 90 in 2002 |
| Ochopee | 9 | 90 | Broken | 88 in 2002 |
| Gainesville | 9 | 89 | Broken | 85 in 2022 |
| Lakeland | 9 | 89 | Broken | 88 in 2024 |
| Tallahassee | 9 | 88 | Broken | 87 in 1974 |
| Orlando | 10 | 90 | Broken | 87 in 2019 |
| Gainesville | 10 | 91 | Broken | 88 in 2019 |
| Tampa | 10 | 88 | Broken | 85 in 2016 |
| Lakeland | 10 | 91 | Broken | 88 in 1985 |
| Jacksonville | 10 | 92 | Broken | 91 in 1974 |
| Clermont | 11 | 93 | Broken | 89 in 2015 |
| Hastings | 11 | 89 | Broken | 86 in 2015 |
| Lisbon | 11 | 89 | Broken | 87 in 1974 |
| Ocala | 11 | 92 | Broken | 90 in 1974 |
| Clermont | 12 | 92 | Broken | 91 in 2015 |
| Hastings | 12 | 90 | Broken | 85 in 1997 |
| Plant City | 12 | 92 | Broken | 90 in 1911 |
| Orlando | 12 | 90 | Broken | 89 in 2001 |
| Key West | 13 | 86 | Broken | 85 in 2003 |
| Fort Pierce | 17 | 89 | Broken | 88 in 1990 |
| Chipley | 24 | 88 | Broken | 86 in 1954 |
| Homestead | 30 | 95 | Broken | 92 in 2023 |
Prepared by Florida Climate Center
The Florida State University
Tallahassee, FL
Average temperatures in February were on average 3 ̊F warmer than historical averages across the state. Average temperatures were at or near normal across northern Florida and the Panhandle and much above normal across the Florida Peninsula. Average temperatures for the month ranged from +5.8 ̊F in West Palm Beach to +0.2 ̊F in Pensacola (see Table 1 and Appendix 1 for select cities). West Palm Beach experienced its third warmest February on record, and Fort Lauderdale had its fourth warmest February on record. Many daily high maximum and high minimum temperature records were set during the month (see Appendices 2 and 3).
Table 1. February average temperatures and departures from normal ( ̊F) for selected cities.
| Station | Mean Temperature | Departure from Normal |
| Pensacola | 54.9 | +0.2 |
| Tallahassee | 56.6 | +1.9 |
| Jacksonville | 57.9 | +1.5 |
| Orlando | 67.1 | +4.1 |
| Tampa | 67.3 | +3.9 |
| Miami | 74.5 | +4.3 |
| Key West | 74.8 | +3.8 |
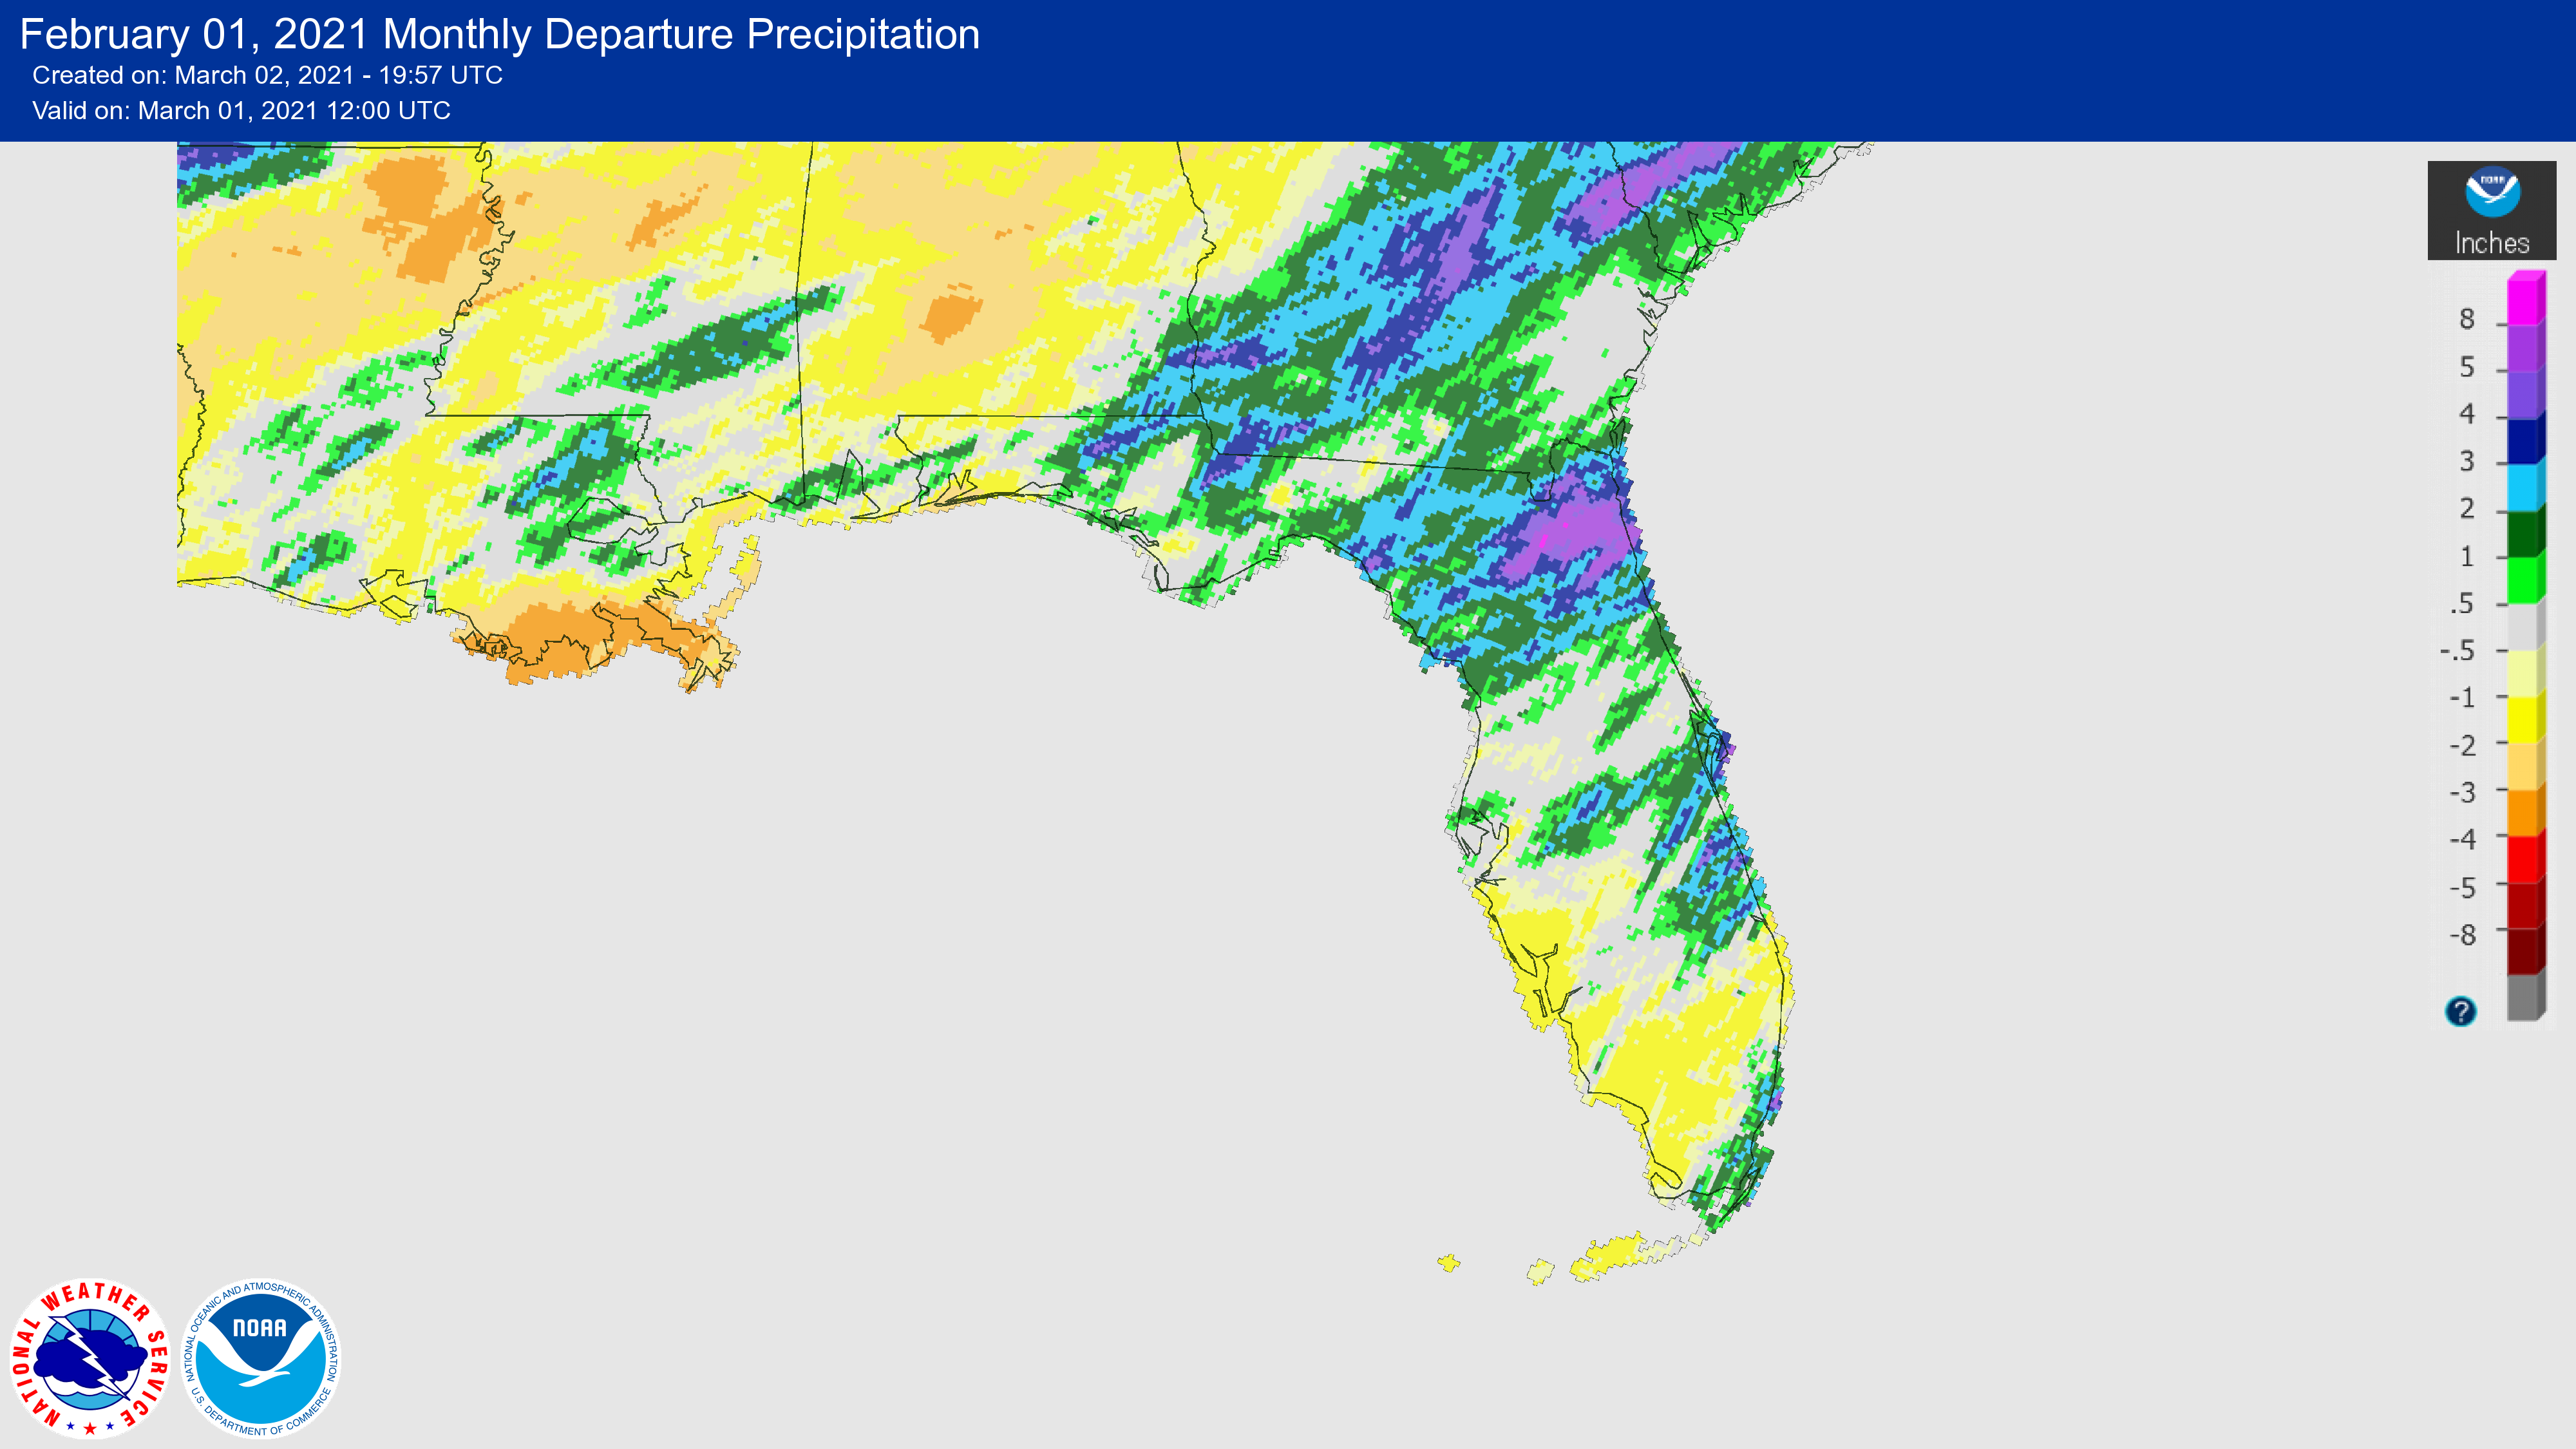
Rainfall totals in February were variable across the state with some locations receiving above normal rainfall and other locations with near or below normal rainfall. Monthly departures from normal ranged from -1.3 inches in Tallahassee to +3.4 inches in Jacksonville (Table 2 and Appendix 1). Much of the northern Peninsula and parts of the Panhandle had above normal rainfall while southwestern Florida experienced below normal rainfall throughout the month (Figure 1). No monthly rainfall records were set during the month. Vero Beach had its third wettest February on record and Jacksonville had its fourth wettest February on record.
Table 2. February precipitation totals and departures from normal (inches) for selected cities.
| Station | Total Rainfall | Departure from Normal |
| Pensacola | 3.85 | -1.21 |
| Tallahassee | 3.58 | -1.27 |
| Jacksonville | 6.63 | +3.44 |
| Orlando | 2.38 | 0.0 |
| Tampa | 3.74 | +0.93 |
| Miami | 2.90 | +0.65 |
| Key West | 0.69 | -0.8 |
Figure 1. A graphical depiction of the monthly rainfall departure from normal (inches) for February (courtesy of NOAA, NWS).
La Niña Conditions in the Pacific Persisted.
La Niña conditions continued during February, but forecasters estimate a shift to ENSO-neutral conditions this spring (~60% chance for April-June). ENSO-neutral conditions are then expected to continue at least through the Northern Hemisphere summer. Recent stratospheric warming and disruptions in the polar vortex, along with a negative phase in the Arctic Oscillation, have influenced weather patterns in the eastern U.S. this winter and overwhelmed typical weather patterns generally seen during La Niña. However, more typical La Niña conditions have returned with above-average temperatures and drier than average conditions across much of the southern tier of the U.S.
Hazardous Weather Events in February.
According to the Local Storm Reports issued by the local National Weather Service offices serving Florida, there were 249 individual local reports of hazardous weather events recorded across the state during the month of February (see Table 4 for a breakdown by event type).
Table 4. Breakdown of storm reports submitted in Florida during the month of February (compiled from Iowa State University/Iowa Environmental Mesonet).
| Report Type | Number of Reports |
| Marine Thunderstorm Wind | 24 |
| Non-Thunderstorm Wind Damage | 1 |
| Non-Thunderstorm Wind Gust | 55 |
| Tornado/Waterspout/Funnel Cloud | 6/1/5 |
| Thunderstorm Wind Damage | 41 |
| Thunderstorm Wind Gust | 54 |
| Lightning | 3 |
| Hail | 31 |
| Flood/FLash Flood | 9/1 |
| Heavy Rain | 17 |
| Rip Currents | 1 |
Drought-Related Impacts.
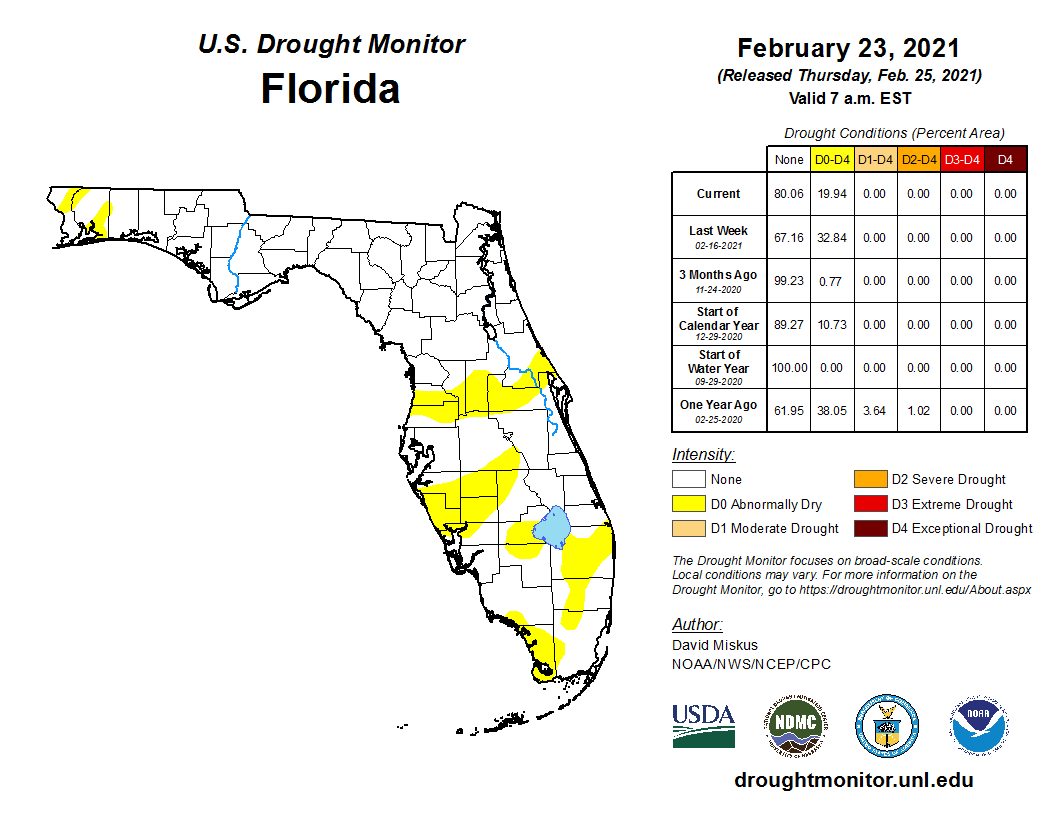
Near the end of February 2021, abnormally dry conditions were found in parts of the Florida Peninsula and the extreme western panhandle region. According to the U.S. Drought Monitor, 33 percent of the state was in abnormally dry conditions (D0) at the end of the month. In early February, abnormally dry conditions emerged across much of the Florida Peninsula but by mid-February these conditions dissipated in some areas. Dry conditions are expected to continue, and the seasonal drought outlook indicates that drought development is likely through the spring across the Peninsula.
As of February 28, the Lake Okeechobee water level was at 15.33 ft. above sea level (Feet-NGVD29), which is above average for this time of the year. At the first of the month, the water level was 15.51 ft. above sea level.
Agriculture-Related Impacts.
For the month of February, the Crop Progress - State Stories, produced monthly December through March, for Florida indicates that pasture conditions declined at the beginning of February due to colder temperatures but improved throughout the month as temperatures rose. Cattle conditions remained mostly good during the month, while sugarcane had minimal damage from frost that was reported mid-month. Toward the end of the month, powdery mildew and worm pressure were reported in some crops. Many citrus fruits were harvested, and several vegetable crops came to market.
Appendix 1
Additional February departures from normal data for select Florida locations (Source: NWS).
| Station | Average Temperature (˚F) | Departure from Normal (˚F) | Total Rainfall (in.) | Departure from Normal (in.) |
| Gainesville | 60.5 | +3.0 | 6.01 | +2.81 |
| Sarasota | 67.6 | +4.2 | 2.19 | -0.51 |
| Melbourne | 68.1 | +5.4 | 2.61 | +0.08 |
| Fort Myers | 70.8 | +4.2 | 2.98 | +0.83 |
| West Palm Beach | 73.6 | +5.8 | 2.62 | -0.20 |
Appendix 2
Select daily record high maximum temperatures tied or broken during February (compiled from NOAA).
| Location | Date | Record (˚F) | Broken/Tied | Last |
| Fort Lauderdale | 8 | 84 | Tied | 84 in 2020 |
| Punta Gorda | 9 | 89 | Broken | 87 in 2017 |
| Orlando | 9 | 86 | Broken | 84 in 1994 |
| West Palm Beach | 9 | 85 | Tied | 85 in 2017 |
| Clermont | 10 | 87 | Broken | 85 in 2001 |
| Tampa | 10 | 86 | Broken | 85 in 2020 |
| Orlando | 10 | 86 | Broken | 85 in 2018 |
| Clermont | 11 | 88 | Broken | 87 in 2018 |
| Miles City | 12 | 90 | Tied | 90 in 2020 |
| Vero Beach | 13 | 88 | Broken | 87 in 2020 |
| Lakeland | 13 | 84 | Tied | 84 in 1959 |
| Vero Beach | 14 | 88 | Broken | 87 in 2009 |
| Perrine | 15 | 87 | Broken | 86 in 2020 |
| Plant City | 15 | 89 | Broken | 88 in 1959 |
| Punta Gorda | 15 | 88 | Broken | 87 in 2003 |
| Tampa | 15 | 86 | Broken | 85 in 1990 |
| Ochopee | 15 | 87 | Tied | 87 in 2003 |
| Daytona Beach | 15 | 86 | Broken | 85 in 1959 |
| Miami | 15 | 86 | Broken | 84 in 2017 |
| Melbourne | 16 | 88 | Broken | 87 in 1982 |
| Sanford | 16 | 87 | Broken | 85 in 2001 |
| Punta Gorda | 17 | 87 | Tied | 87 in 2020 |
| Tarpon Springs | 18 | 85 | Tied | 85 in 2020 |
| Mayport | 18 | 87 | Broken | 85 in 2019 |
| Daytona Beach | 18 | 88 | Broken | 87 in 1944 |
| Lisbon | 19 | 85 | Broken | 84 in 2019 |
| Sanford | 20 | 88 | Broken | 85 in 2019 |
| Vero Beach | 20 | 88 | Broken | 87 in 1975 |
| Tampa | 26 | 87 | Broken | 85 in 1997 |
| Plant City | 27 | 90 | Broken | 89 in 1962 |
| Pensacola | 28 | 79 | Broken | 78 in 2018 |
Appendix 3
Select daily record high minimum temperatures tied or broken during February (compiled from NOAA).
| Location | Date | Record (˚F) | Broken/Tied | Last |
| Clermont | 7 | 69 | Broken | 67 in 1955 |
| Perrine | 7 | 70 | Broken | 68 in 2018 |
| Punta Gorda | 7 | 71 | Broken | 65 in 1971 |
| Lakeland | 7 | 68 | Broken | 66 in 1955 |
| Mountain Lake | 8 | 70 | Broken | 68 in 2018 |
| Vero Beach | 8 | 67 | Broken | 65 in 2008 |
| Fort Pierce | 9 | 69 | Tied | 69 in 1939 |
| Orlando | 9 | 67 | Broken | 64 in 1965 |
| Bradenton | 10 | 66 | Tied | 66 in 1982 |
| Miles City | 10 | 67 | Broken | 66 in 1982 |
| Orlando | 10 | 67 | Broken | 65 in 2019 |
| Bradenton | 13 | 69 | Tied | 69 in 2018 |
| Perrine | 14 | 71 | Broken | 69 in 1997 |
| Miami | 14 | 76 | Broken | 74 in 1997 |
| Fort Lauderdale Beach | 15 | 75 | Broken | 72 in 2018 |
| Tampa | 15 | 66 | Broken | 64 in 2018 |
| Stuart | 16 | 75 | Broken | 73 in 2020 |
| Fort Lauderdale | 18 | 73 | Broken | 71 in 1995 |
| Perrine | 18 | 71 | Broken | 68 in 2008 |
| Daytona Beach | 19 | 70 | Broken | 66 in 2020 |
| Hastings | 19 | 67 | Broken | 64 in 1994 |
| Titusville | 19 | 70 | Broken | 68 in 2020 |
| Mountain Lake | 22 | 78 | Broken | 70 in 2014 |
| Tampa | 27 | 70 | Broken | 69 in 1997 |
Building A, Suite 292
Tallahassee, FL 32306-2741
Phone: (850) 644-3417 | (850) 644-0719
climate@coaps.fsu.edu