


The Florida Climate Center serves as the primary resource for climate data, information, and services in the state of Florida.

The Florida Climate Center achieves its mission by providing climate monitoring, research, and expertise to be applied by the people, institutions, and businesses of Florida and the surrounding region.
We provide direct service by fulfilling requests for climate and weather data and information in a variety of formats.
We perform research that advances the understanding of the climate variability and changes of Florida and the surrounding region.
We provide outreach in presentations and at events aimed at a variety of groups, interests, and ages.
Prepared by Florida Climate Center
The Florida State University
Tallahassee, FL

Summary:
- Monthly average temperatures in September were near normal in Florida.
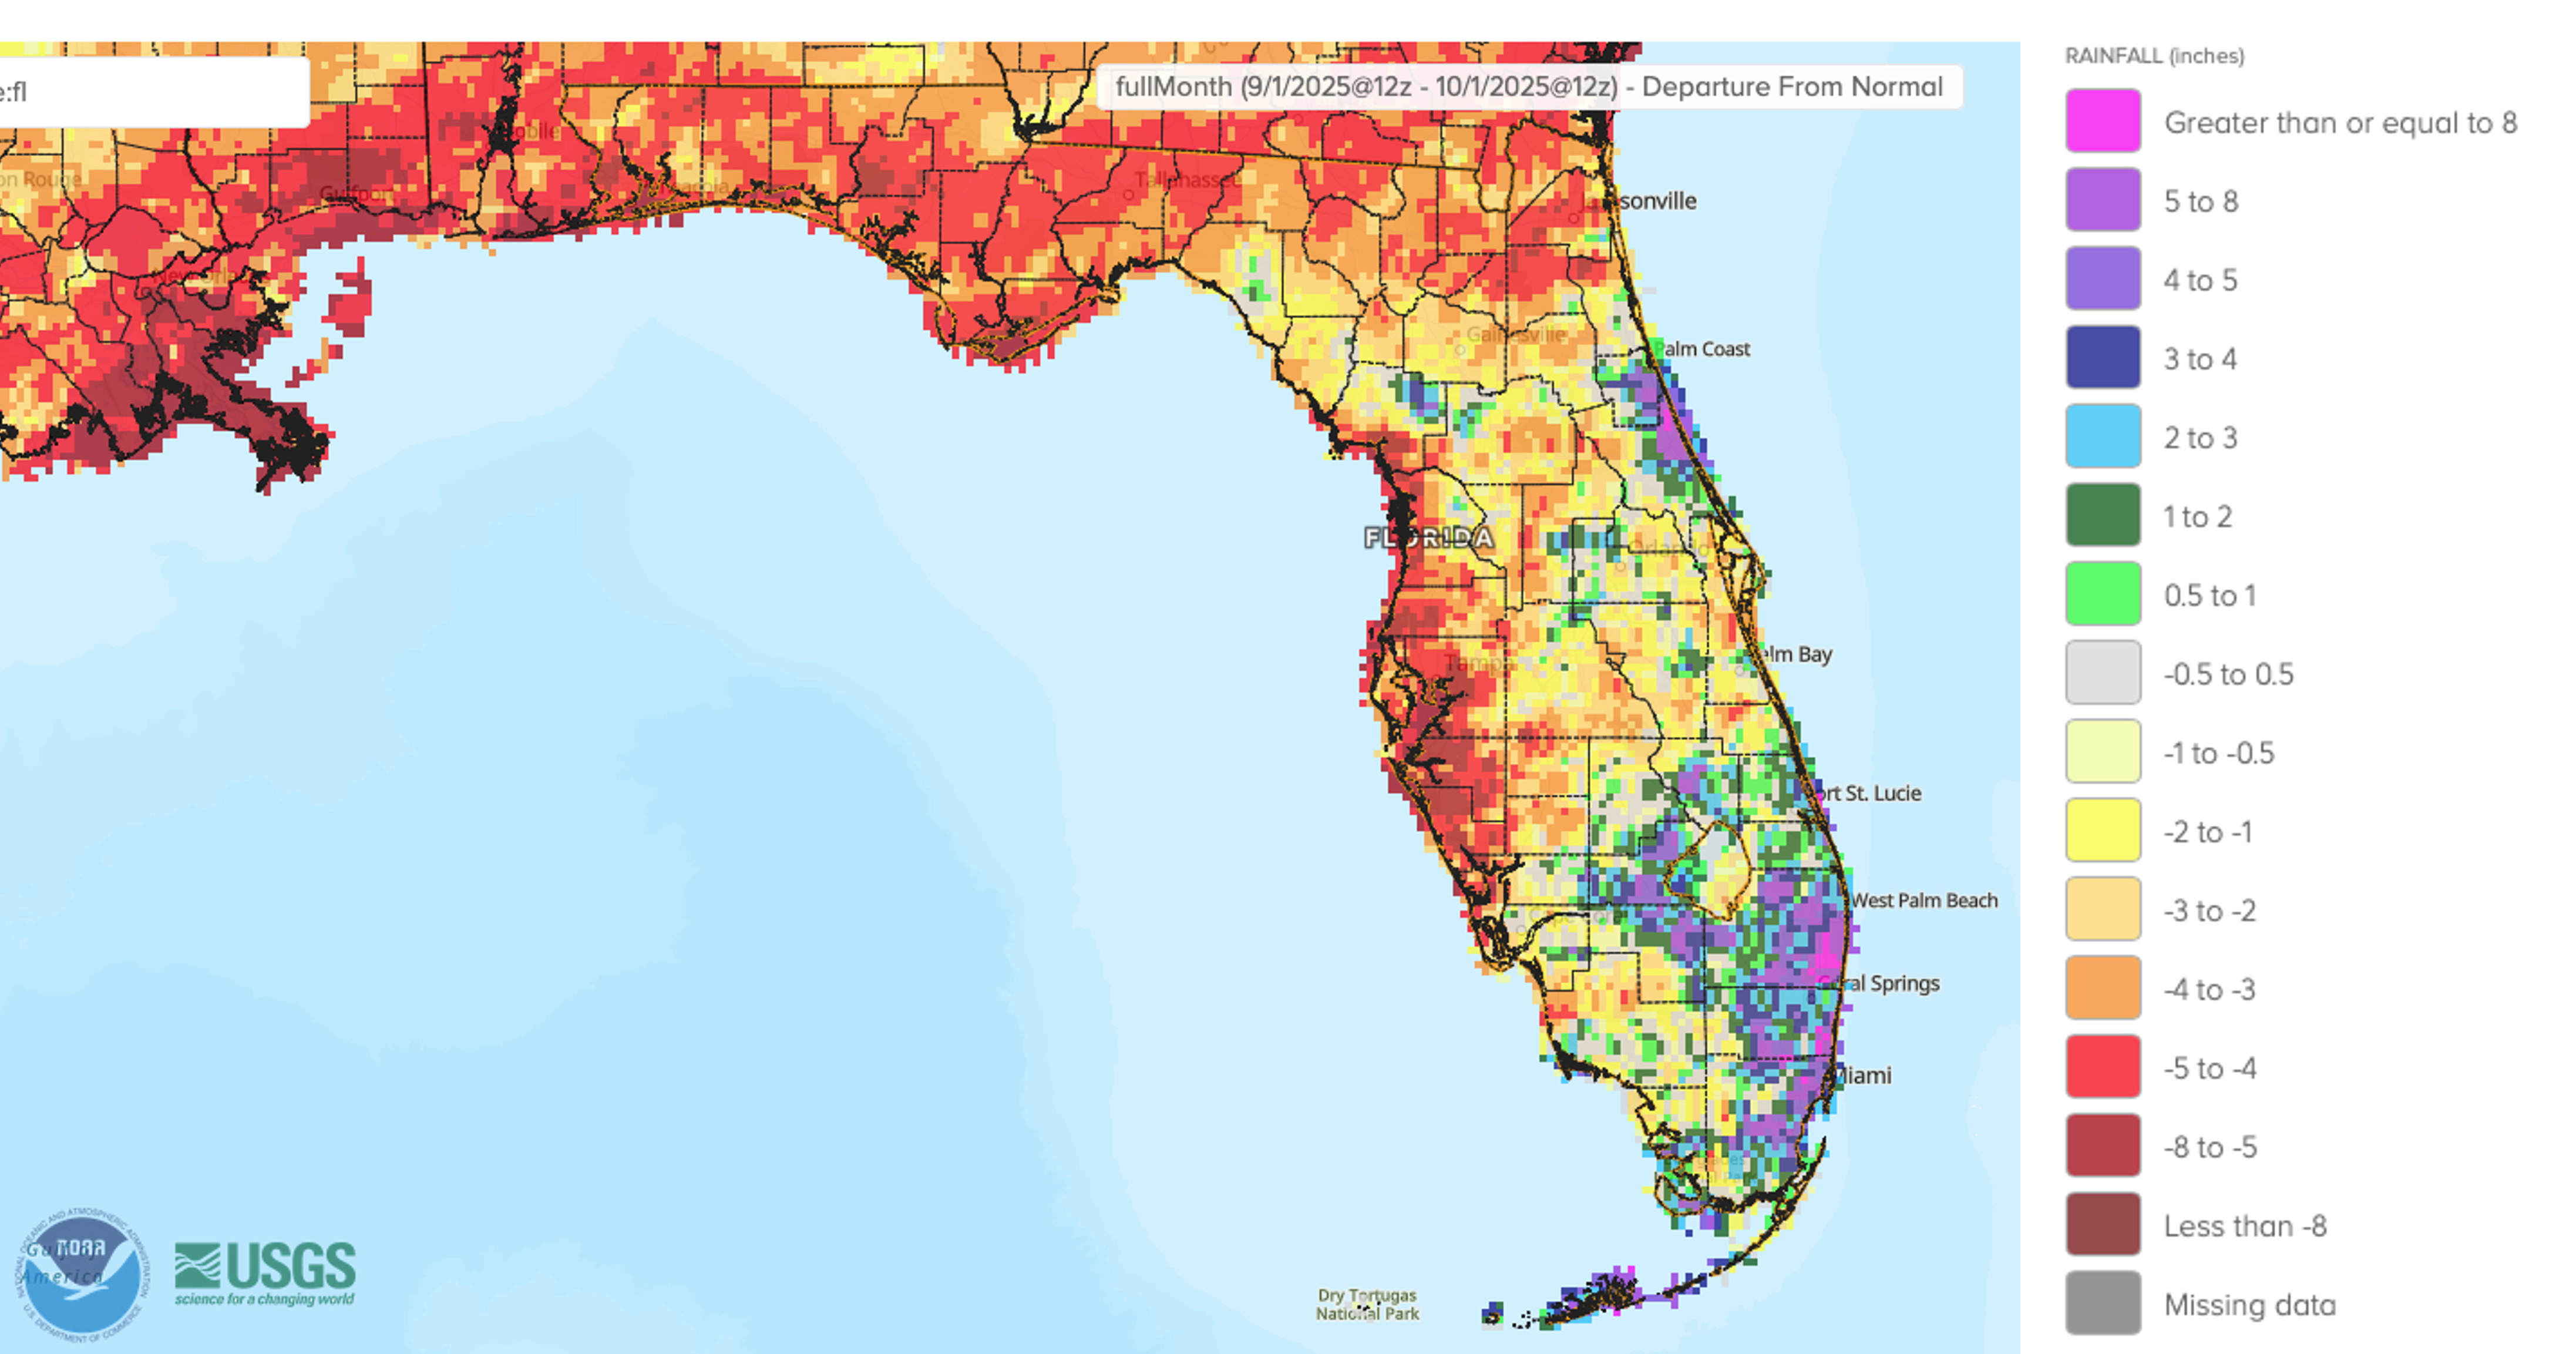
- Monthly precipitation totals in September were below normal in northern Florida and the west coast, and above normal in Southeast Florida and the Keys.
- Drought developed in the Panhandle and North Florida during September, while drought improved in Southeast Florida, though long-term drought impacts remained along coastal areas.
- La Niña is favored to develop in the equatorial Pacific Ocean during fall and early winter with a 71% chance during October-December 2025.
Table 1. September average temperatures and departures from normal ( ̊F) for select cities.
| Station | Mean Temperature | Departure from Normal |
| Pensacola | 79.6 | -0.4 |
| Tallahassee | 78.6 | -0.5 |
| Jacksonville | 78.1 | -0.7 |
| Orlando | 81.8 | +0.8 |
| Tampa | 83.4 | +0.7 |
| Miami | 83.2 | +0.2 |
| Key West | 83.8 | -0.3 |
Table 2. September precipitation totals and departures from normal (inches) for selected cities.
| Station | Total Rainfall | Departure from Normal |
| Pensacola | 2.00 | -4.61 |
| Tallahassee | 0.54 | -4.37 |
| Jacksonville | 2.74 | -4.82 |
| Orlando | 6.42 | +0.05 |
| Tampa | 0.70 | -5.39 |
| Miami | 16.55 | +6.33 |
| Key West | 9.39 | +2.15 |
Figure 1. A graphical depiction of the monthly rainfall departure from normal (inches) for September (courtesy of NOAA, NWS).
La Niña Watch.
ENSO-neutral conditions continued in August 2025 with near to below average sea surface temperatures (SSTs) in the tropical equatorial Pacific Ocean. Odds toward the development of La Niña have increased, with a 71% chance during October-December 2025. For the remainder of winter, La Niña is favored but the probability decreases to 54% during December 2025–February 2026, before returning to ENSO-neutral conditions thereafter.
Hazardous Weather Events in September.
According to the Local Storm Reports issued by the local National Weather Service offices serving Florida, there were 139 individual local reports of hazardous weather events recorded across the state during the month of September (see Table 3 for a breakdown by event type).
Table 3. Breakdown of storm reports submitted in Florida during the month of September (compiled from Iowa State University/Iowa Environmental Mesonet).
| Report Type | Number of Reports |
| Heavy Rain | 26 |
| Flash Flood | 0 |
| Flood | 23 |
| Hail | 1 |
| Marine Thunderstorm Wind | 15 |
| Non-Thunderstorm Wind Gust | 4 |
| Tornado/Waterspout/Funnel Cloud/Landspout | 1 / 20 / 8 / 1 |
| Thunderstorm Wind Damage | 9 |
| Non-Thunderstorm Wind Damage | 0 |
| Thunderstorm Wind Gust | 22 |
Daily Record Events in September.
Table 4. Summary of daily records broken or set in Florida in September (source: NCEI Daily Weather Records).
| Category | Number of Records |
| Highest daily max. temp. | 17 |
| Highest daily min. temp. | 7 |
| Lowest daily max. temp. | 8 |
| Lowest daily min. temp. | 12 |
| Highest daily precipitation | 12 |
| Total | 56 |
Drought-Related Impacts.
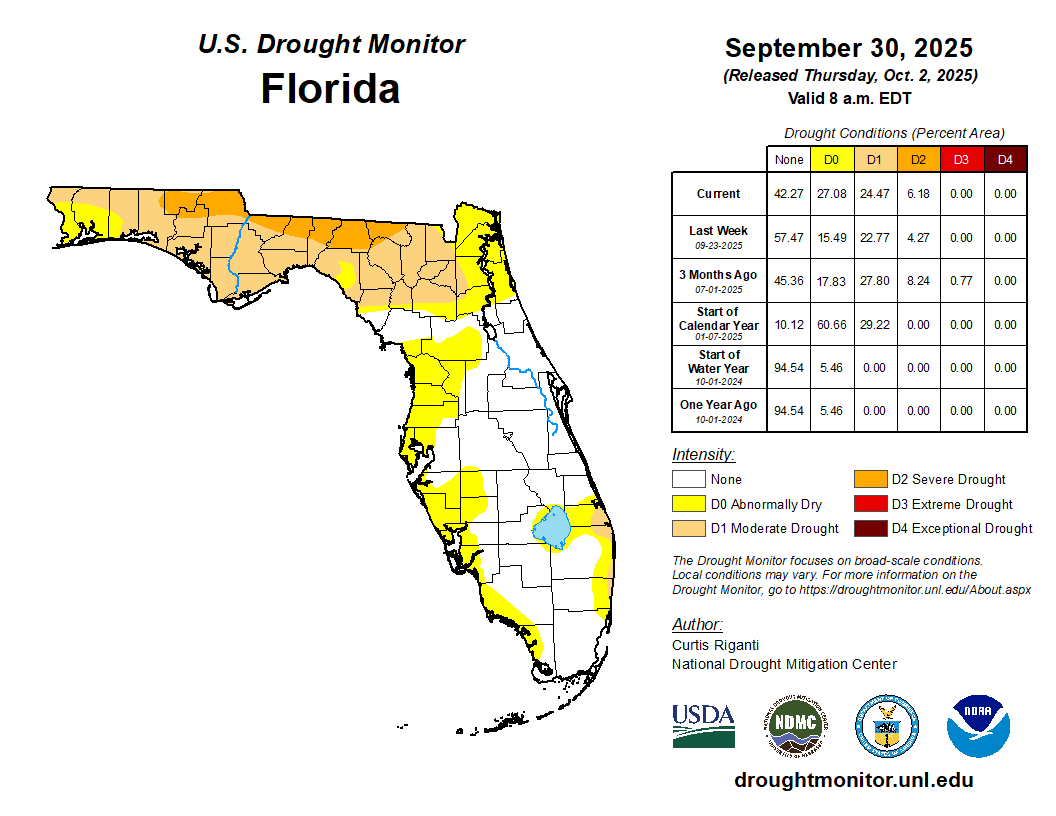
Below-normal rainfall has led to drought development across northern Florida during September. In Southeast Florida, above-normal rainfall led to drought improvement, though long-term drought impacts continued in coastal portions of Martin, Palm Beach, and Broward Counties. In mid-September, roughly 9% of the state was in moderate drought (D1) and 33% was abnormally dry (D0), according to the U.S. Drought Monitor. By the end of September, approximately 6% of the state was in severe drought (D2), 24% was in moderate drought (D1), and 27% of the state was abnormally dry (D0) (Figure 2 below).
As of September 30, the Lake Okeechobee water level was 13.51 ft. above sea level (Feet-NGVD29), which is below average for this time of year. At the first of the month, the water level was 12.52 ft. above sea level.
Figure 2. A graphical depiction of the latest drought conditions in Florida according to the U.S. Drought Monitor (courtesy of the National Drought Mitigation Center, University of Nebraska-Lincoln).
Agriculture-Related Impacts.
In mid-September, topsoil moisture conditions were adequate in 60% of the state, short in 17%, and very short in 8% of the state, while 15% of the state had surplus topsoil moisture conditions. By the end of September, topsoil moisture conditions were adequate in 54% of the state, were short in 21% of the state, and very short in 8% of the state, while 17% of the state had surplus topsoil moisture conditions. For more information, consult the Crop Progress and Conditions reports, which are published by the USDA’s National Agricultural Statistics Service.
Appendix 1
Additional September departures from normal data for select Florida locations (Source: NWS).
| Station | Average Temperature (˚F) | Departure from Normal (˚F) | Total Rainfall (in.) | Departure from Normal (in.) |
| Gainesville | 79.5 | +0.7 | 3.43 | -1.62 |
| Sarasota | 82.0 | -0.2 | 1.66 | -4.34 |
| Melbourne | 80.8 | +0.2 | 8.37 | +0.74 |
| Fort Myers | 82.6 | +0.4 | 6.56 | -2.44 |
| West Palm Beach | 82.7 | +0.8 | 7.96 | 0.00 |
Appendix 2
Select daily record high maximum temperatures (°F) tied or broken during September 2025 (compiled from NOAA).
| Location | Date | Record (˚F) | Broken/Tied | Last |
| Fort Lauderdale Beach | 2 | 96 | Broken | 94 in 2006 |
| Miami | 2 | 94 | Broken | 93 in 2022 |
| Fort Lauderdale Beach | 3 | 96 | Broken | 94 in 2006 |
| Homestead | 3 | 96 | Broken | 95 in 1996 |
| Lakeland | 4 | 99 | Broken | 97 in 1982 |
| Vero Beach | 6 | 95 | Broken | 94 in 1966 |
| Gainesville | 7 | 95 | Tied | 95 in 2019 |
| Miami | 11 | 94 | Tied | 94 in 2022 |
| Chipley | 20 | 99 | Broken | 97 in 2010 |
| Niceville | 20 | 95 | Broken | 94 in 2005 |
| Chipley | 21 | 100 | Tied | 100 in 2010 |
| Gainesville | 22 | 95 | Broken | 92 in 2022 |
| Gainesville | 23 | 96 | Broken | 93 in 2018 |
| Chipley | 24 | 97 | Broken | 95 in 2010 |
| Clermont | 24 | 96 | Broken | 95 in 2024 |
| Fort Lauderdale Beach | 26 | 92 | Broken | 91 in 2022 |
| Ocala | 26 | 95 | Tied | 95 in 1961 |
| Quincy | 26 | 94 | Broken | 93 in 2016 |
| Miles City | 27 | 96 | Broken | 95 in 2019 |
| Tampa | 28 | 95 | Tied | 95 in 1961 |
Prepared by Florida Climate Center
The Florida State University
Tallahassee, FL
Summary:
- Monthly average temperatures in July were near to above normal across Florida.
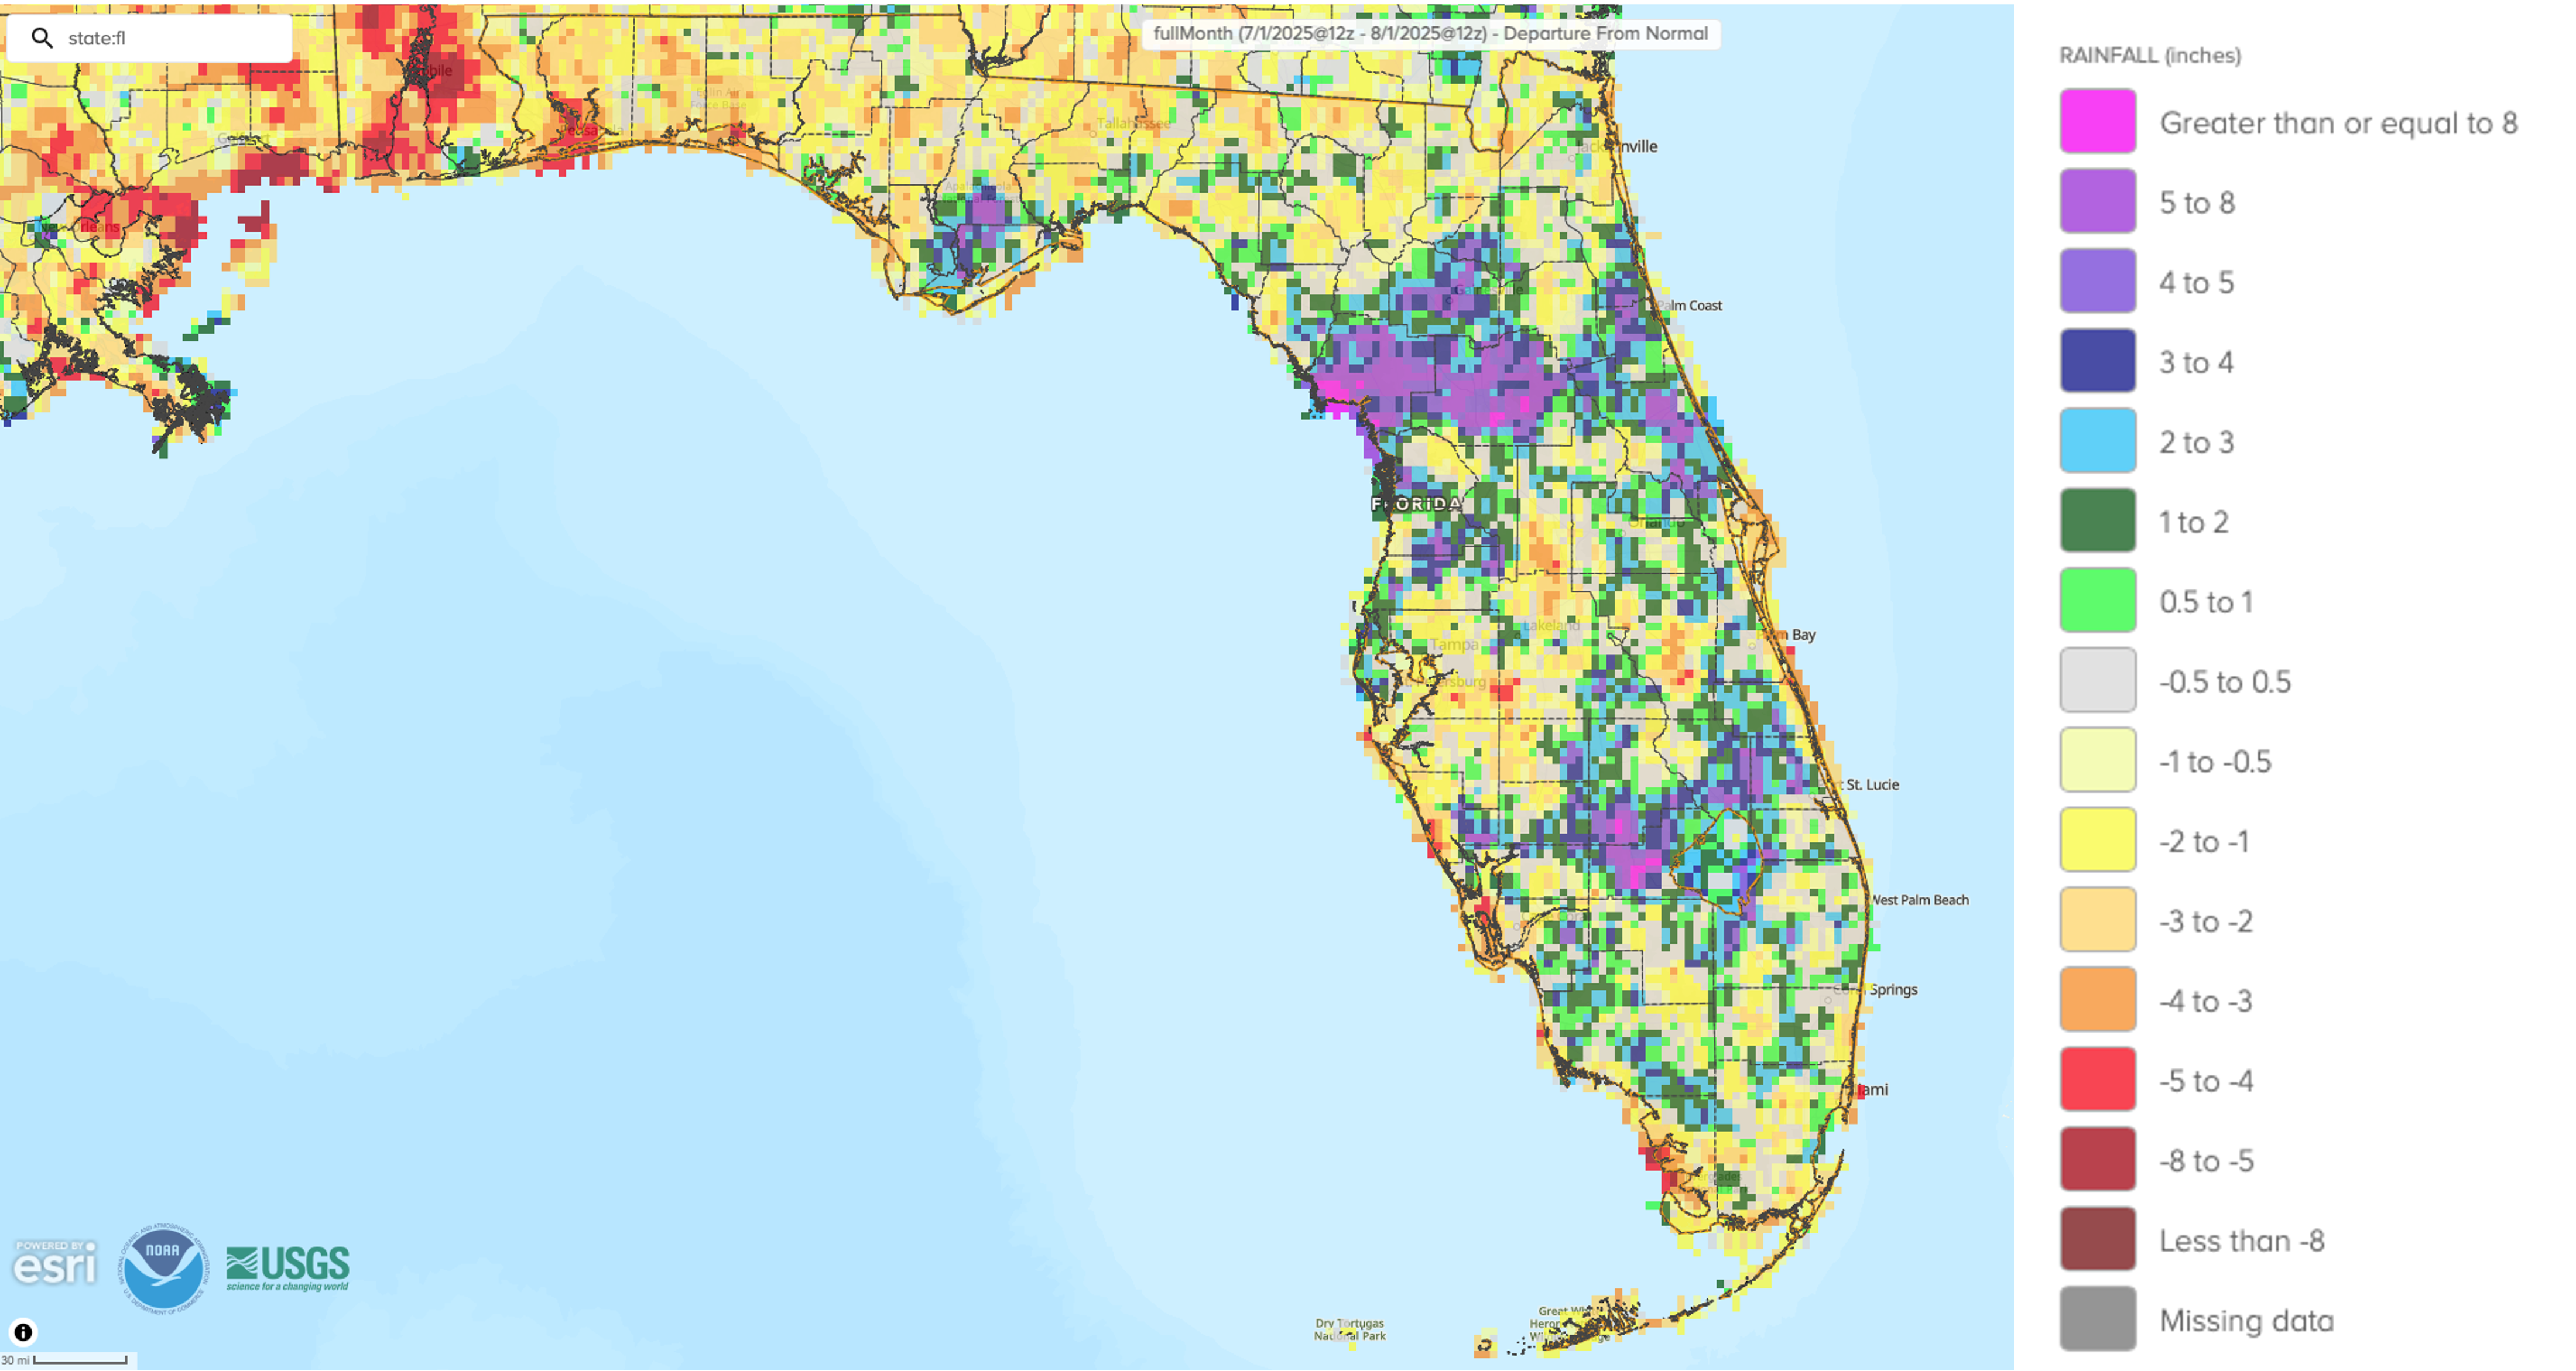
- Monthly precipitation totals in July were below normal in the Panhandle and mixed across the Peninsula.
- While drought conditions improved during July, moderate (D1) to extreme drought (D3) persisted in South Florida.
- ENSO-neutral conditions continued in the tropical Pacific Ocean and are expected to persist through the Northern Hemisphere summer and early fall (56% chance during August-October).
Table 1. July average temperatures and departures from normal ( ̊F) for select cities.
| Station | Mean Temperature | Departure from Normal |
| Pensacola | 84.8 | +1.3 |
| Tallahassee | 84.6 | +2.1 |
| Jacksonville | 84.8 | +2.3 |
| Orlando | 83.9 | +1.3 |
| Tampa | 85.6 | +1.8 |
| Miami | 84.4 | +0.3 |
| Key West | 85.2 | -0.2 |
Table 2. July precipitation totals and departures from normal (inches) for selected cities.
| Station | Total Rainfall | Departure from Normal |
| Pensacola | 2.93 | -4.96 |
| Tallahassee | 3.14 | -4.00 |
| Jacksonville | 7.01 | +0.24 |
| Orlando | 10.04 | +2.58 |
| Tampa | 7.60 | -0.15 |
| Miami | 8.92 | +1.56 |
| Key West | 3.16 | -0.47 |
Figure 1. A graphical depiction of the monthly rainfall departure from normal (inches) for July (courtesy of NOAA, NWS).
ENSO-Neutral Conditions Present in Pacific.
ENSO-neutral conditions are currently present in the tropical equatorial Pacific Ocean. Over the past month, near-average sea surface temperatures continued across most of the equatorial Pacific Ocean, and the latest weekly Niño index values ranged from 0.0 ̊C to +0.4 ̊C. ENSO-neutral conditions are most likely to persist through the end of the Northern Hemisphere summer and early fall (56% chance during August-October). Chances of La Niña conditions increase into the winter 2025-26, but there is high uncertainty as chances for La Niña are comparable to chances for ENSO-neutral through winter.
Hazardous Weather Events in July.
According to the Local Storm Reports issued by the local National Weather Service offices serving Florida, there were 326 individual local reports of hazardous weather events recorded across the state during the month of July (see Table 3 for a breakdown by event type). July saw a typical active summer pattern, with hit-and-miss thunderstorms bringing heavy rainfall, lightning, and gusty winds. A lightning strike injured three people at St. Pete Beach on the July 4th holiday, and lightning injured three others at the St. Augustine Beach pier on the 12th. Plant City experienced flash flooding after 9-12 inches of rain fell within 24 hours on the 14th. Later in the month, a large area of high pressure led to below-normal rainfall and dangerous humid heat across the state with heat index values peaking to over 115 ̊F in some places. Wildfires were reported in Southeast Florida in Palm Beach, Broward, and Miami-Dade Counties. The 13 Mile Fire in Palm Beach County has burned 13,000 acres, but no injuries or major impacts were reported.
Table 3. Breakdown of storm reports submitted in Florida during the month of July (compiled from Iowa State University/Iowa Environmental Mesonet).
| Report Type | Number of Reports |
| Heavy Rain | 48 |
| Flash Flood | 7 |
| Flood | 7 |
| Hail | 17 |
| Marine Thunderstorm Wind | 38 |
| Non-Thunderstorm Wind Gust | 15 |
| Tornado/Waterspout/Funnel Cloud | 1 / 8 / 4 |
| Thunderstorm Wind Damage | 33 |
| Non-Thunderstorm Wind Damage | 0 |
| Thunderstorm Wind Gust | 133 |
| Lightning | 10 |
| Wildfire | 5 |
Daily Record Events in July.
Table 4. Summary of daily records broken or set in Florida in July (source: NCEI Daily Weather Records).
| Category | Number of Records |
| Highest daily max. temp. | 55 |
| Highest daily min. temp. | 45 |
| Lowest daily max. temp. | 3 |
| Lowest daily min. temp. | 1 |
| Highest daily precipitation | 26 |
| Total | 130 |
Drought-Related Impacts.
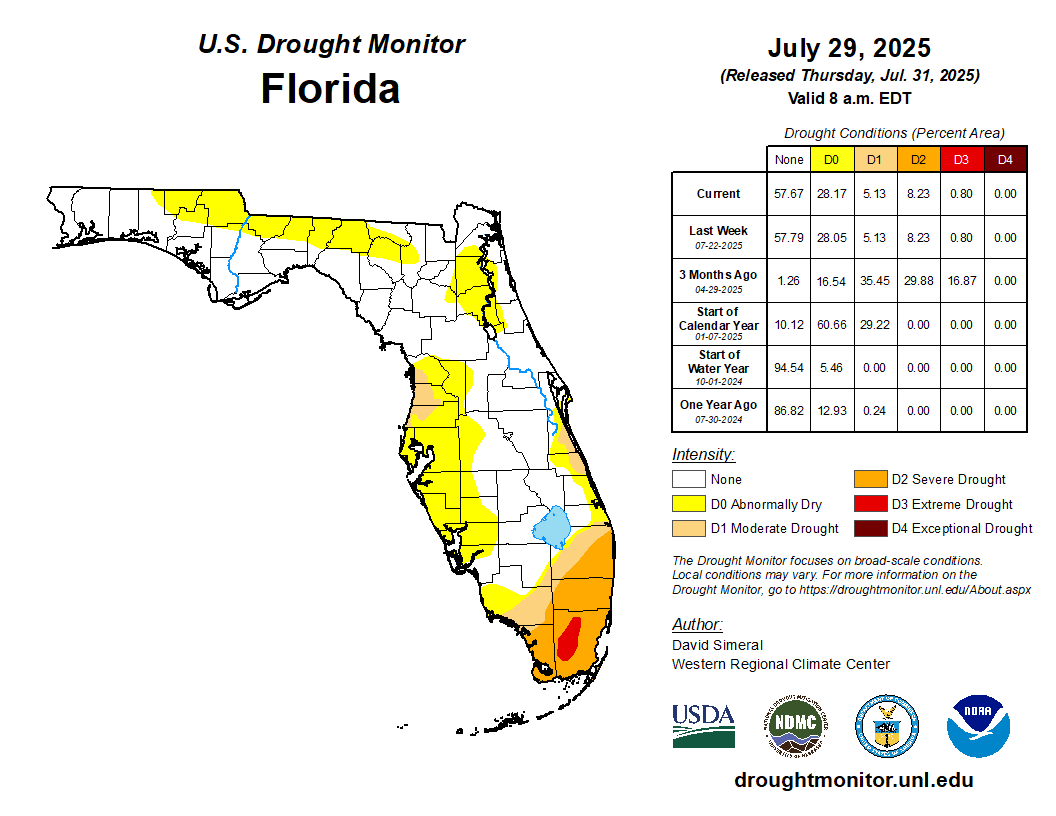
Drought improved across Peninsular Florida over the past month, but drought continues to affect South Florida and some coastal regions. In mid-July, approximately 1% of the state was in extreme drought (D3), 8% was in severe drought (D2), 6% of the state was in moderate drought (D1), and 27% was abnormally dry (D0), according to the U.S. Drought Monitor. Not much changed during the second half of the month. By the end of July, approximately 1% of the state was in extreme drought (D3), 8% was in severe drought (D2), 5% was in moderate drought (D1), and 28% of the state was abnormally dry (D0) (Figure 2 below).
As of July 31, the Lake Okeechobee water level was 12.09 ft. above sea level (Feet-NGVD29), which is below average for this time of year. At the first of the month, the water level was 11.22 ft. above sea level.
Figure 2. A graphical depiction of the latest drought conditions in Florida according to the U.S. Drought Monitor (courtesy of the National Drought Mitigation Center, University of Nebraska-Lincoln).
Agriculture-Related Impacts.
In mid-July, topsoil moisture conditions were adequate in 57% of the state, short in 18%, and very short in 4% of the state, while 21% of the state had surplus topsoil moisture conditions. By the end of July, topsoil moisture conditions remained adequate in 65% of the state, were short in 14% of the state, and very short in 1% of the state, while 20% of the state had surplus topsoil moisture conditions. For more information, consult the Crop Progress and Conditions report, which is published by the USDA’s National Agricultural Statistics Service.
Appendix 1
Additional July departures from normal data for select Florida locations (Source: NWS).
| Station | Average Temperature (˚F) | Departure from Normal (˚F) | Total Rainfall (in.) | Departure from Normal (in.) |
| Gainesville | 84.1 | +2.7 | 11.34 | +4.66 |
| Sarasota | 83.2 | +0.1 | 6.21 | -1.18 |
| Melbourne | 83.3 | +1.6 | 7.09 | +0.59 |
| Fort Myers | 84.7 | +1.5 | 5.00 | -4.38 |
| Naples | 84.8 | +1.7 | 4.07 | -3.70 |
| West Palm Beach | 84.4 | +1.3 | 6.41 | +0.78 |
Appendix 2
Select daily record high maximum temperatures (°F) tied or broken during July 2025 (compiled from NOAA).
| Location | Date | Record (˚F) | Broken/Tied | Last |
| Fort Lauderdale | 1 | 94 | Broken | 93 in 2015 |
| Ochopee | 9 | 98 | Tied | 98 in 2016 |
| Clermont | 11 | 98 | Tied | 98 in 2016 |
| Gainesville | 14 | 97 | Broken | 96 in 1986 |
| Marianna | 15 | 99 | Tied | 99 in 2000 |
| Bradenton | 19 | 97 | Broken | 96 in 2024 |
| Miles City | 19 | 100 | Broken | 98 in 2019 |
| Gainesville | 19 | 98 | Broken | 97 in 2000 |
| Lakeland | 20 | 98 | Broken | 97 in 1993 |
| Clermont | 21 | 102 | Broken | 99 in 2024 |
| Lake City | 21 | 100 | Broken | 99 in 2000 |
| Ochopee | 21 | 98 | Broken | 97 in 2011 |
| Lakeland | 21 | 98 | Broken | 97 in 1993 |
| Clermont | 22 | 99 | Broken | 98 in 2024 |
| Naples | 22 | 96 | Tied | 96 in 2010 |
| Niceville | 23 | 99 | Broken | 98 in 1948 |
| Lake City | 24 | 100 | Broken | 99 in 1952 |
| Jacksonville | 26 | 99 | Broken | 98 in 1940 |
| Bradenton | 27 | 97 | Broken | 96 in 2023 |
| Clermont | 27 | 101 | Broken | 98 in 2024 |
| Gainesville | 27 | 100 | Broken | 98 in 2010 |
| Tampa | 27 | 100 | Broken | 97 in 1996 |
| Jacksonville | 27 | 100 | Broken | 99 in 2010 |
| Clermont | 28 | 103 | Broken | 98 in 2016 |
| Lisbon | 28 | 98 | Broken | 97 in 2010 |
| Plant City | 28 | 99 | Broken | 98 in 2017 |
| Usher Tower | 28 | 98 | Broken | 97 in 2010 |
| Orlando | 28 | 98 | Broken | 97 in 1992 |
| Gainesville | 28 | 100 | Broken | 97 in 2010 |
| Fort Myers | 28 | 98 | Broken | 97 in 1979 |
| Jacksonville | 28 | 101 | Tied | 101 in 2016 |
| Clermont | 29 | 105 | Broken | 98 in 2016 |
| Ocala | 29 | 101 | Broken | 99 in 2010 |
| Plant City | 29 | 100 | Broken | 98 in 2022 |
| Gainesville | 29 | 100 | Broken | 98 in 2010 |
| Orlando | 29 | 100 | Broken | 98 in 2010 |
| Jacksonville | 29 | 101 | Broken | 99 in 2016 |
| Clermont | 30 | 103 | Broken | 100 in 1961 |
| Deland | 30 | 101 | Broken | 98 in 2010 |
| Jasper | 30 | 102 | Broken | 100 in 1963 |
| Kissimmee | 30 | 98 | Broken | 96 in 2017 |
| Wauchula | 30 | 99 | Broken | 97 in 2009 |
| Lisbon | 31 | 101 | Broken | 96 in 2010 |
Prepared by Florida Climate Center
The Florida State University
Tallahassee, FL
Summary:
- Monthly average temperatures in August were mixed, with below to near normal temperatures in the Panhandle and near to above normal temperatures in the Peninsula.
- Monthly precipitation totals in August were near to above normal in the Panhandle and western Florida, above normal in northeastern Florida, and below normal in central to southeastern areas.
- Drought conditions improved during August, but moderate (D1) to extreme drought (D3) persisted in southeastern Florida where large year-to-date rainfall deficits exist.
- A brief period of La Niña is favored to develop in the equatorial Pacific Ocean during fall and early winter 2025-26 (~58% chance during October-December), followed by a return to ENSO-neutral conditions.
Table 1. August average temperatures and departures from normal ( ̊F) for select cities.
| Station | Mean Temperature | Departure from Normal |
| Pensacola | 82.0 | -1.0 |
| Tallahassee | 81.8 | -0.6 |
| Jacksonville | 83.2 | +1.1 |
| Orlando | 83.8 | +1.2 |
| Tampa | 85.3 | +1.3 |
| Miami | 85.3 | +1.1 |
| Key West | 85.5 | 0.0 |
Table 2. August precipitation totals and departures from normal (inches) for selected cities.
| Station | Total Rainfall | Departure from Normal |
| Pensacola | 12.00 | +4.50 |
| Tallahassee | 7.18 | -0.42 |
| Jacksonville | 6.51 | -0.37 |
| Orlando | 7.31 | -0.38 |
| Tampa | 11.20 | +2.17 |
| Miami | 5.88 | -3.70 |
| Key West | 4.59 | -0.78 |
Figure 1. A graphical depiction of the monthly rainfall departure from normal (inches) for August (courtesy of NOAA, NWS).
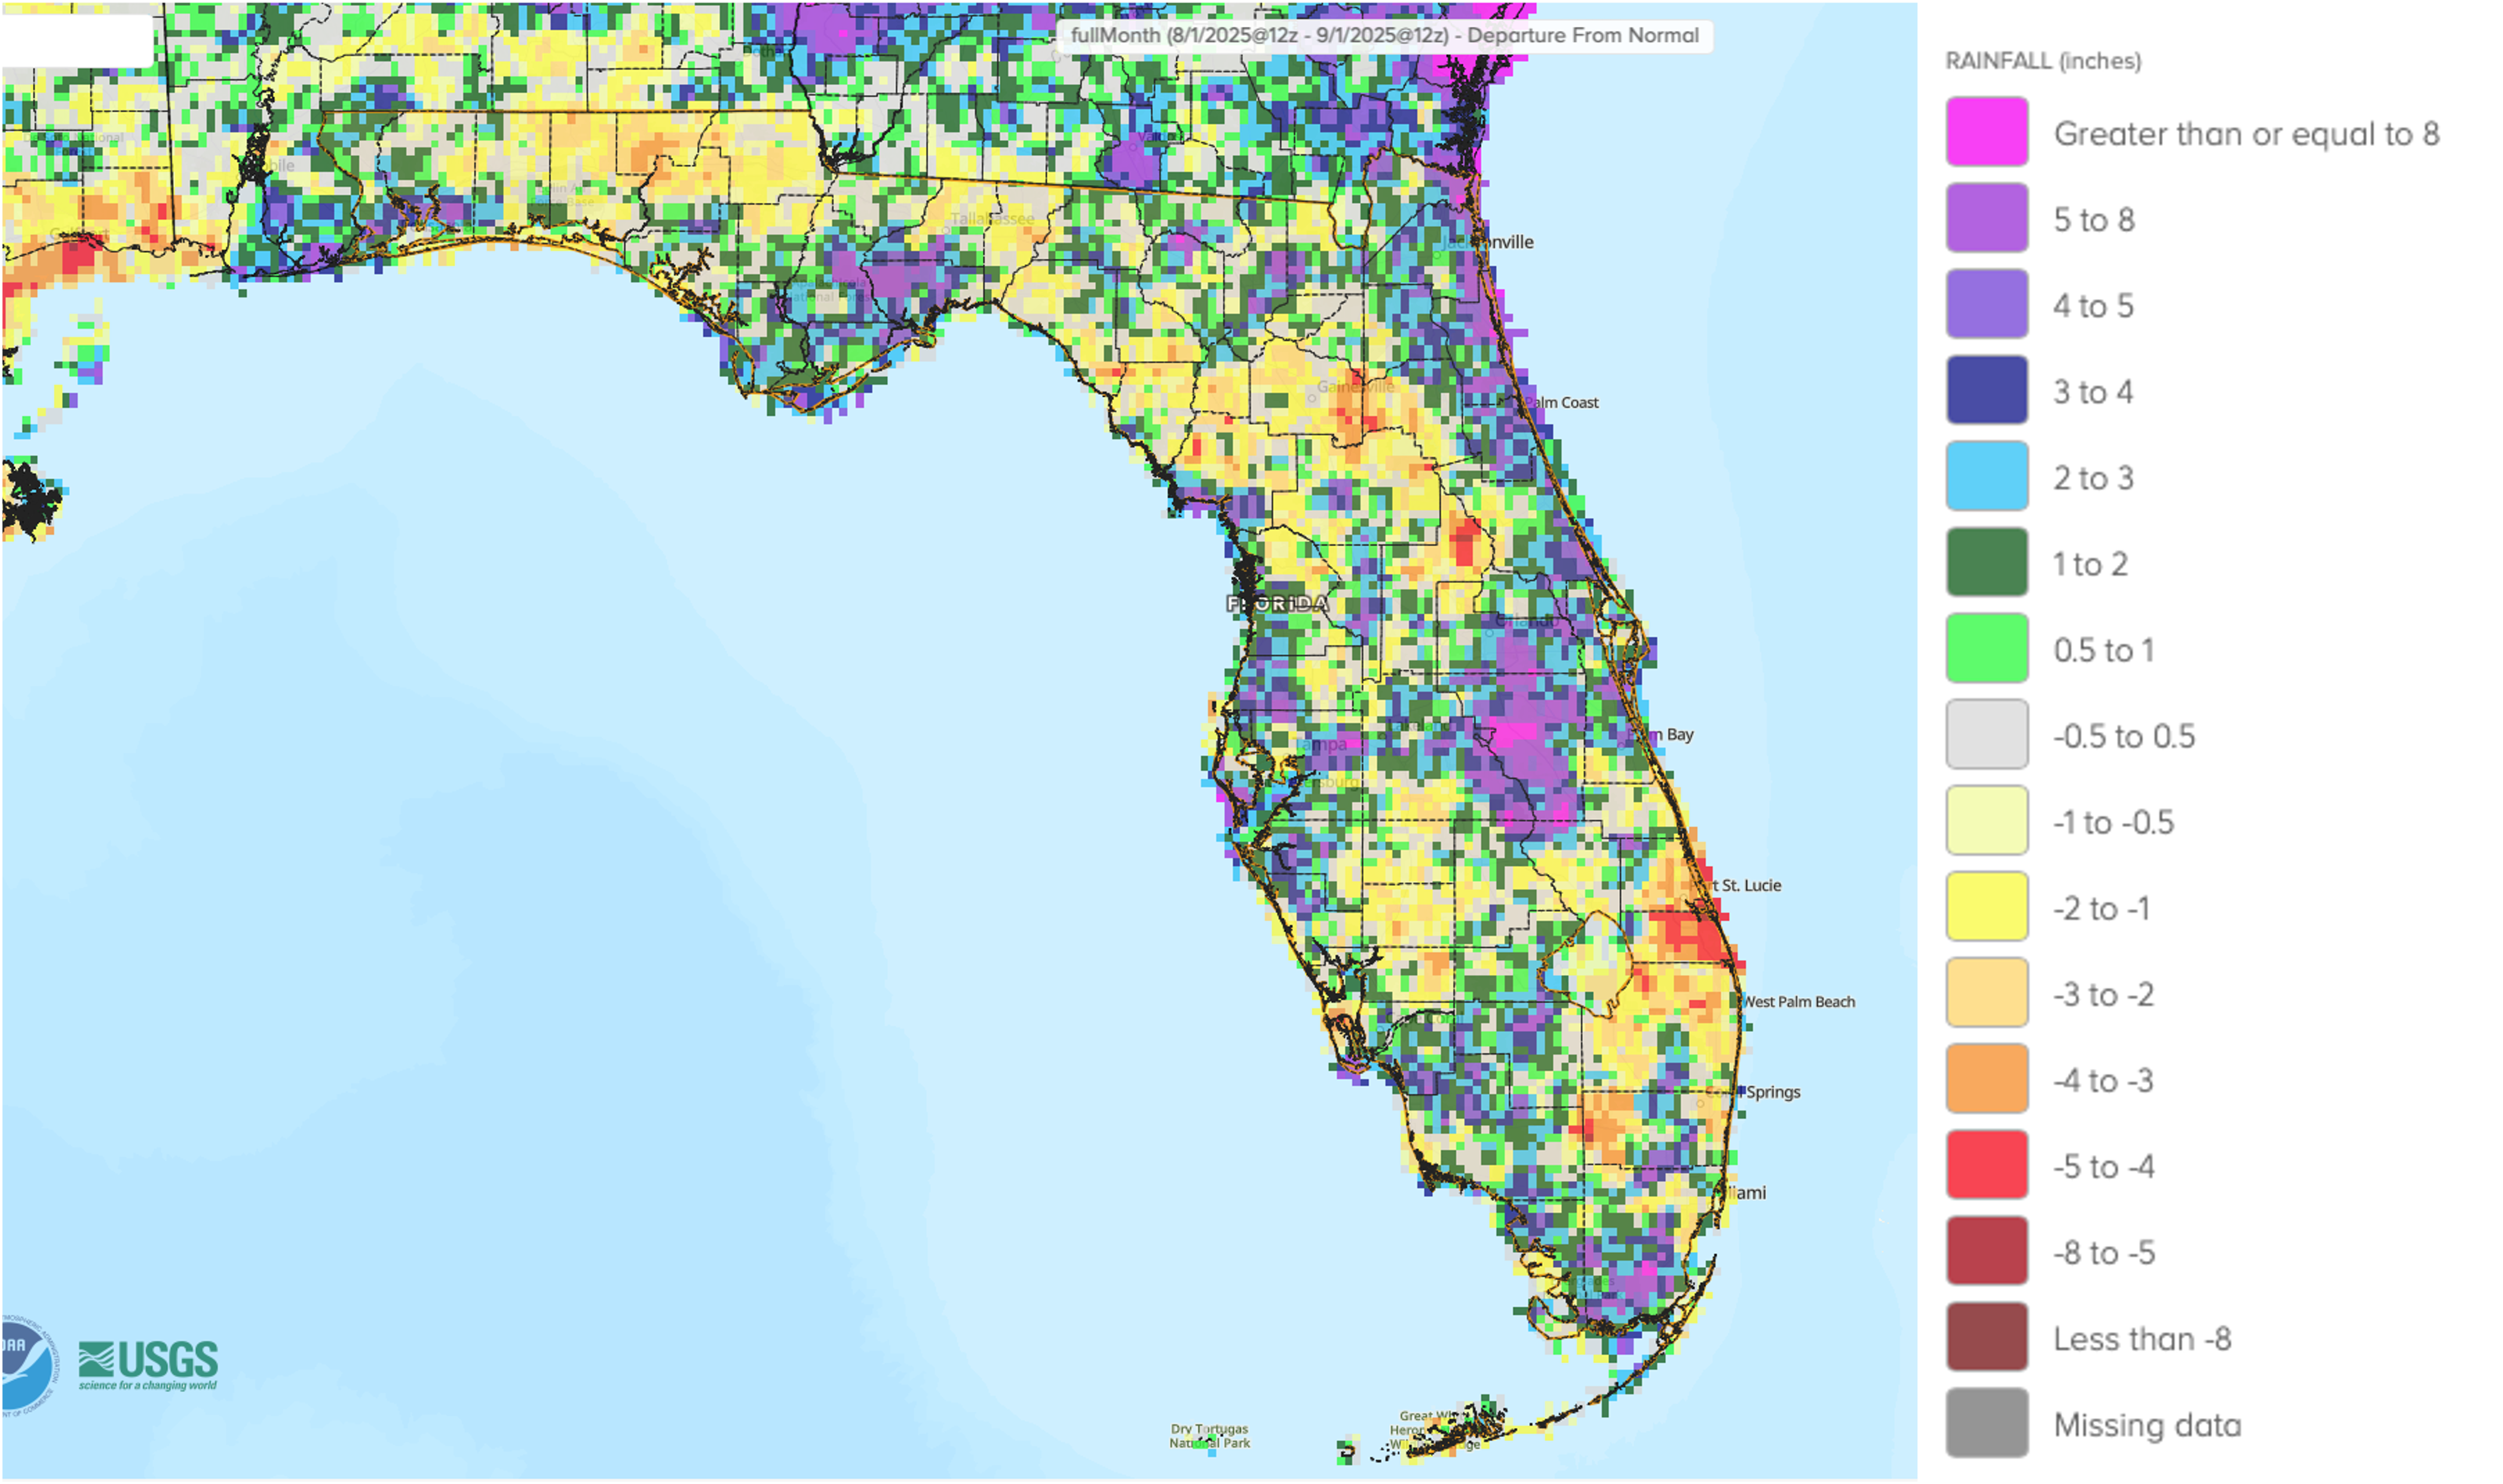
La Niña Watch.
ENSO-neutral conditions are currently present in the tropical equatorial Pacific Ocean and are likely to persist through the late Northern Hemisphere summer and early fall (56% chance during August-October). During the past month, near-average sea surface temperatures (SSTs) continued across most of the equatorial Pacific Ocean. The latest weekly Niño SST index values ranged from -0.3 ̊C to 0.0 ̊C. Subsurface temperature anomalies became weakly negative in the eastern Pacific Ocean during the past month. A brief period of La Niña is favored to develop during the fall and early winter 2025-26 (with a roughly 58% chance during October-December) before returning to ENSO-neutral conditions.
Hazardous Weather Events in August.
According to the Local Storm Reports issued by the local National Weather Service offices serving Florida, there were 287 individual local reports of hazardous weather events recorded across the state during the month of August (see Table 3 for a breakdown by event type). The Palm Beach County wildfire in the early part of the month burned a total of 11,400 acres and was reported as 100% contained by August 4th. Later in the month, a wildfire burned in rural Broward County and impacted visibility and air quality in metro areas of southeastern Florida. Thunderstorms throughout the month led to flash flooding and strong wind gusts. Lightning led to two injuries and caused a structure fire in Marion County mid-month.
Table 3. Breakdown of storm reports submitted in Florida during the month of August (compiled from Iowa State University/Iowa Environmental Mesonet).
| Report Type | Number of Reports |
| Heavy Rain | 62 |
| Flash Flood | 9 |
| Flood | 17 |
| Hail | 5 |
| Marine Thunderstorm Wind | 41 |
| Non-Thunderstorm Wind Gust | 3 |
| Tornado/Waterspout/Funnel Cloud | 2 / 21 / 4 |
| Thunderstorm Wind Damage | 15 |
| Non-Thunderstorm Wind Damage | 0 |
| Thunderstorm Wind Gust | 96 |
| Lightning | 6 |
| Wildfire | 4 |
Daily Record Events in August.
Table 4. Summary of daily records broken or set in Florida in August (source: NCEI Daily Weather Records).
| Category | Number of Records |
| Highest daily max. temp. | 44 |
| Highest daily min. temp. | 40 |
| Lowest daily max. temp. | 11 |
| Lowest daily min. temp. | 6 |
| Highest daily precipitation | 23 |
| Total | 124 |
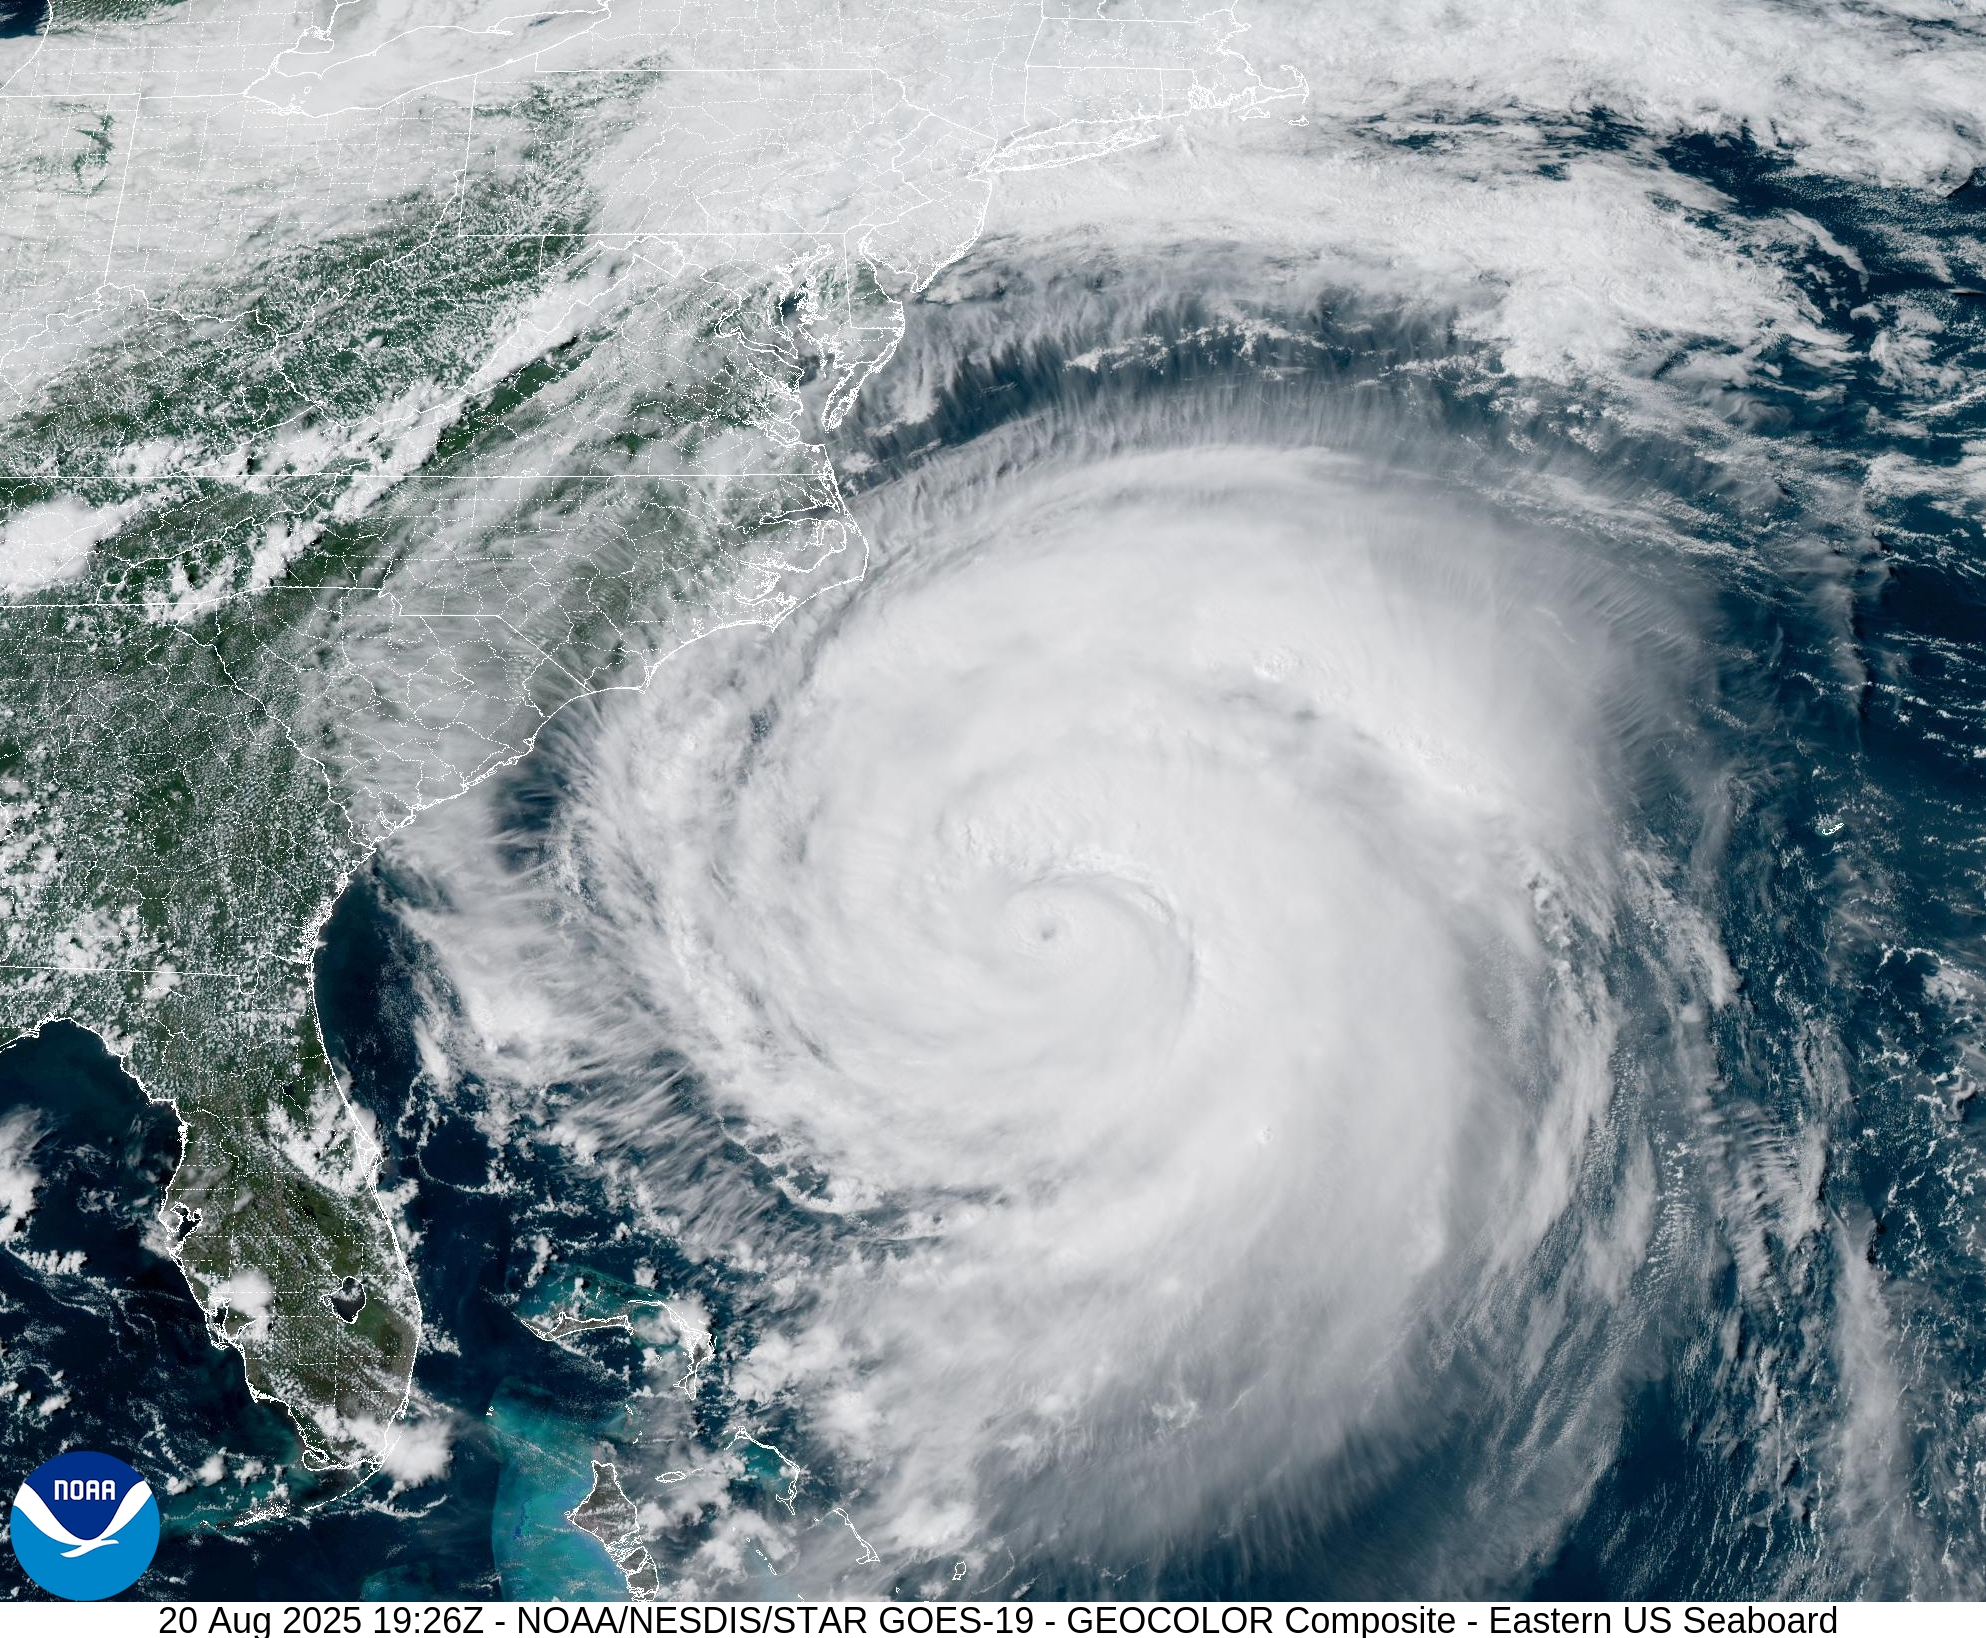
Weather/Climate Highlights of the Month: Hurricane Erin
Hurricane Erin became the first hurricane and first major hurricane of the 2025 Atlantic Hurricane Season. Tropical Storm Erin developed into a hurricane on August 15, just a few days behind climatology, and Erin quickly strengthened from a Category 1 to a Category 5 hurricane between the evening hours of Friday, August 15, and Saturday morning, August 16, as it moved through warm water in the Atlantic. As a category 5 hurricane, Erin passed just north of Puerto Rico and turned northward.
Erin experienced extreme rapid intensification as maximum sustained winds increased by 85 mph in under 24 hours, which far surpasses the threshold for rapid intensification (35 mph in 24 hours). The storm then experienced weakening to a Category 2 storm as it underwent an eyewall replacement cycle, but it maintained Category-2 strength for several days as it moved northward and grew in size.
While Erin did not make landfall in the U.S., the storm’s large size and wind field led to major impacts along the East Coast of the U.S. A mandatory evacuation was issued for parts of the North Carolina coast, as high wind gusts and large waves of 15-20 feet led to overwashing and major erosion along the coast. The storm was a timely reminder that hurricanes can still impact land without making a direct hit.
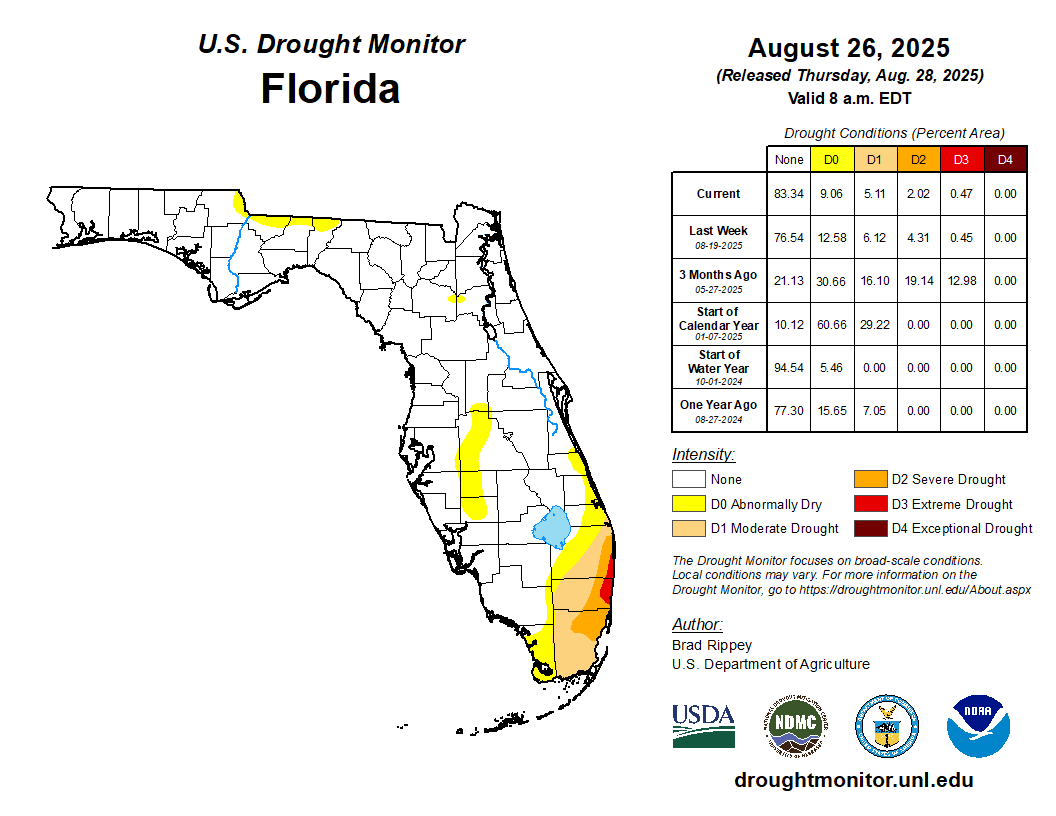
Drought-Related Impacts.
Drought improved across Peninsular Florida during August, but long-term drought continued to impact southeastern Florida as of late August, with extreme drought (D3) along the coastal portions of Palm Beach and Broward Counties. In mid-August, 0.17% of the state was in extreme drought (D3), about 5% was in severe drought (D2), 7% of the state was in moderate drought (D1), and 18% was abnormally dry (D0), according to the U.S. Drought Monitor. By the end of the month, approximately 0.5% of the state was in extreme drought (D3), 2% was in severe drought (D2), 5% was in moderate drought (D1), and 9% of the state was abnormally dry (D0) (Figure 2 below).
As of August 31, the Lake Okeechobee water level was 12.53 ft. above sea level (Feet-NGVD29), which is below average for this time of year. At the first of the month, the water level was 12.06 ft. above sea level.
Figure 2. A graphical depiction of the latest drought conditions in Florida according to the U.S. Drought Monitor (courtesy of the National Drought Mitigation Center, University of Nebraska-Lincoln).
Agriculture-Related Impacts.
In mid-August, topsoil moisture conditions were adequate in 82% of the state, short in 12%, and very short in 1% of the state, while 5% of the state had surplus topsoil moisture conditions. By the end of August, topsoil moisture conditions were adequate in 76% of the state, were short in 10% of the state, and very short in 0% of the state, while 14% of the state had surplus topsoil moisture conditions. For more information, consult the Crop Progress and Conditions report, which is published by the USDA’s National Agricultural Statistics Service.
Appendix 1
Additional August departures from normal data for select Florida locations (Source: NWS).
| Station | Average Temperature (˚F) | Departure from Normal (˚F) | Total Rainfall (in.) | Departure from Normal (in.) |
| Gainesville | 83.5 | +2.2 | 7.96 | +1.56 |
| Sarasota | 83.0 | -0.4 | 12.78 | +3.67 |
| Melbourne | 83.3 | +1.3 | 11.40 | +4.73 |
| Fort Myers | 84.8 | +1.4 | 9.11 | -1.32 |
| West Palm Beach | 85.6 | +2.4 | 6.86 | -1.82 |
Appendix 2
Select daily record high maximum temperatures (°F) tied or broken during August 2025 (compiled from NOAA).
| Location | Date | Record (˚F) | Broken/Tied | Last |
| Bradenton | 1 | 97 | Broken | 96 in 2022 |
| Fort Lauderdale Beach | 2 | 96 | Broken | 95 in 2015 |
| Fernandina Beach | 3 | 98 | Tied | 98 in 2023 |
| Fort Lauderdale Beach | 4 | 96 | Broken | 93 in 2015 |
| Homestead | 4 | 97 | Broken | 96 in 1990 |
| Bradenton | 5 | 98 | Broken | 96 in 1993 |
| Clermont | 5 | 99 | Broken | 98 in 2022 |
| Fort Lauderdale Beach | 5 | 98 | Broken | 94 in 1962 |
| Clermont | 6 | 100 | Broken | 96 in 2023 |
| Deland | 6 | 100 | Tied | 100 in 1918 |
| Ochopee | 6 | 98 | Broken | 97 in 2011 |
| Clermont | 7 | 100 | Broken | 97 in 2021 |
| Tampa | 7 | 98 | Broken | 97 in 1993 |
| Sanford | 13 | 104 | Broken | 99 in 2023 |
| Ocala | 15 | 99 | Tied | 99 in 1902 |
| Clermont | 16 | 102 | Broken | 99 in 2023 |
| Fort Myers | 16 | 98 | Broken | 97 in 1990 |
| Miles City | 17 | 100 | Tied | 100 in 2005 |
| Clermont | 18 | 99 | Broken | 98 in 1954 |
| Fort Lauderdale Beach | 18 | 95 | Broken | 94 in 1958 |
| Key West | 18 | 100 | Broken | 99 in 2021 |
| Homestead | 20 | 98 | Broken | 95 in 2022 |
| West Palm Beach | 20 | 96 | Broken | 95 in 1958 |
| Fort Lauderdale Beach | 23 | 99 | Broken | 94 in 1962 |
| Homestead | 26 | 98 | Broken | 96 in 1990 |
| Stuart | 27 | 96 | Broken | 94 in 1998 |
| Fort Lauderdale Beach | 31 | 95 | Broken | 94 in 2023 |
Prepared by Florida Climate Center
The Florida State University
Tallahassee, FL
Summary:
- Monthly average temperatures in October were near normal overall in Florida.
- Monthly precipitation totals in October were below normal in northern Florida, the west coast, and southeastern Florida; they were above to well above normal in central Florida and the east coast.
- Drought deteriorated in northern Florida during October with the introduction of extreme drought (D3), while abnormally dry conditions (D0) expanded along the west coast.
- La Niña has developed in the equatorial Pacific Ocean and is favored to persist through February 2026, with a transition to ENSO-neutral conditions expected during January-March 2026 (55% chance).
Table 1. October average temperatures and departures from normal ( ̊F) for select cities.
| Station | Mean Temperature | Departure from Normal |
| Pensacola | 71.5 | +0.2 |
| Tallahassee | 69.9 | -0.4 |
| Jacksonville | 70.4 | -0.8 |
| Orlando | 75.5 | 0.0 |
| Tampa | 78.5 | +1.1 |
| Miami | 81.0 | +0.9 |
| Key West | 81.4 | +0.1 |
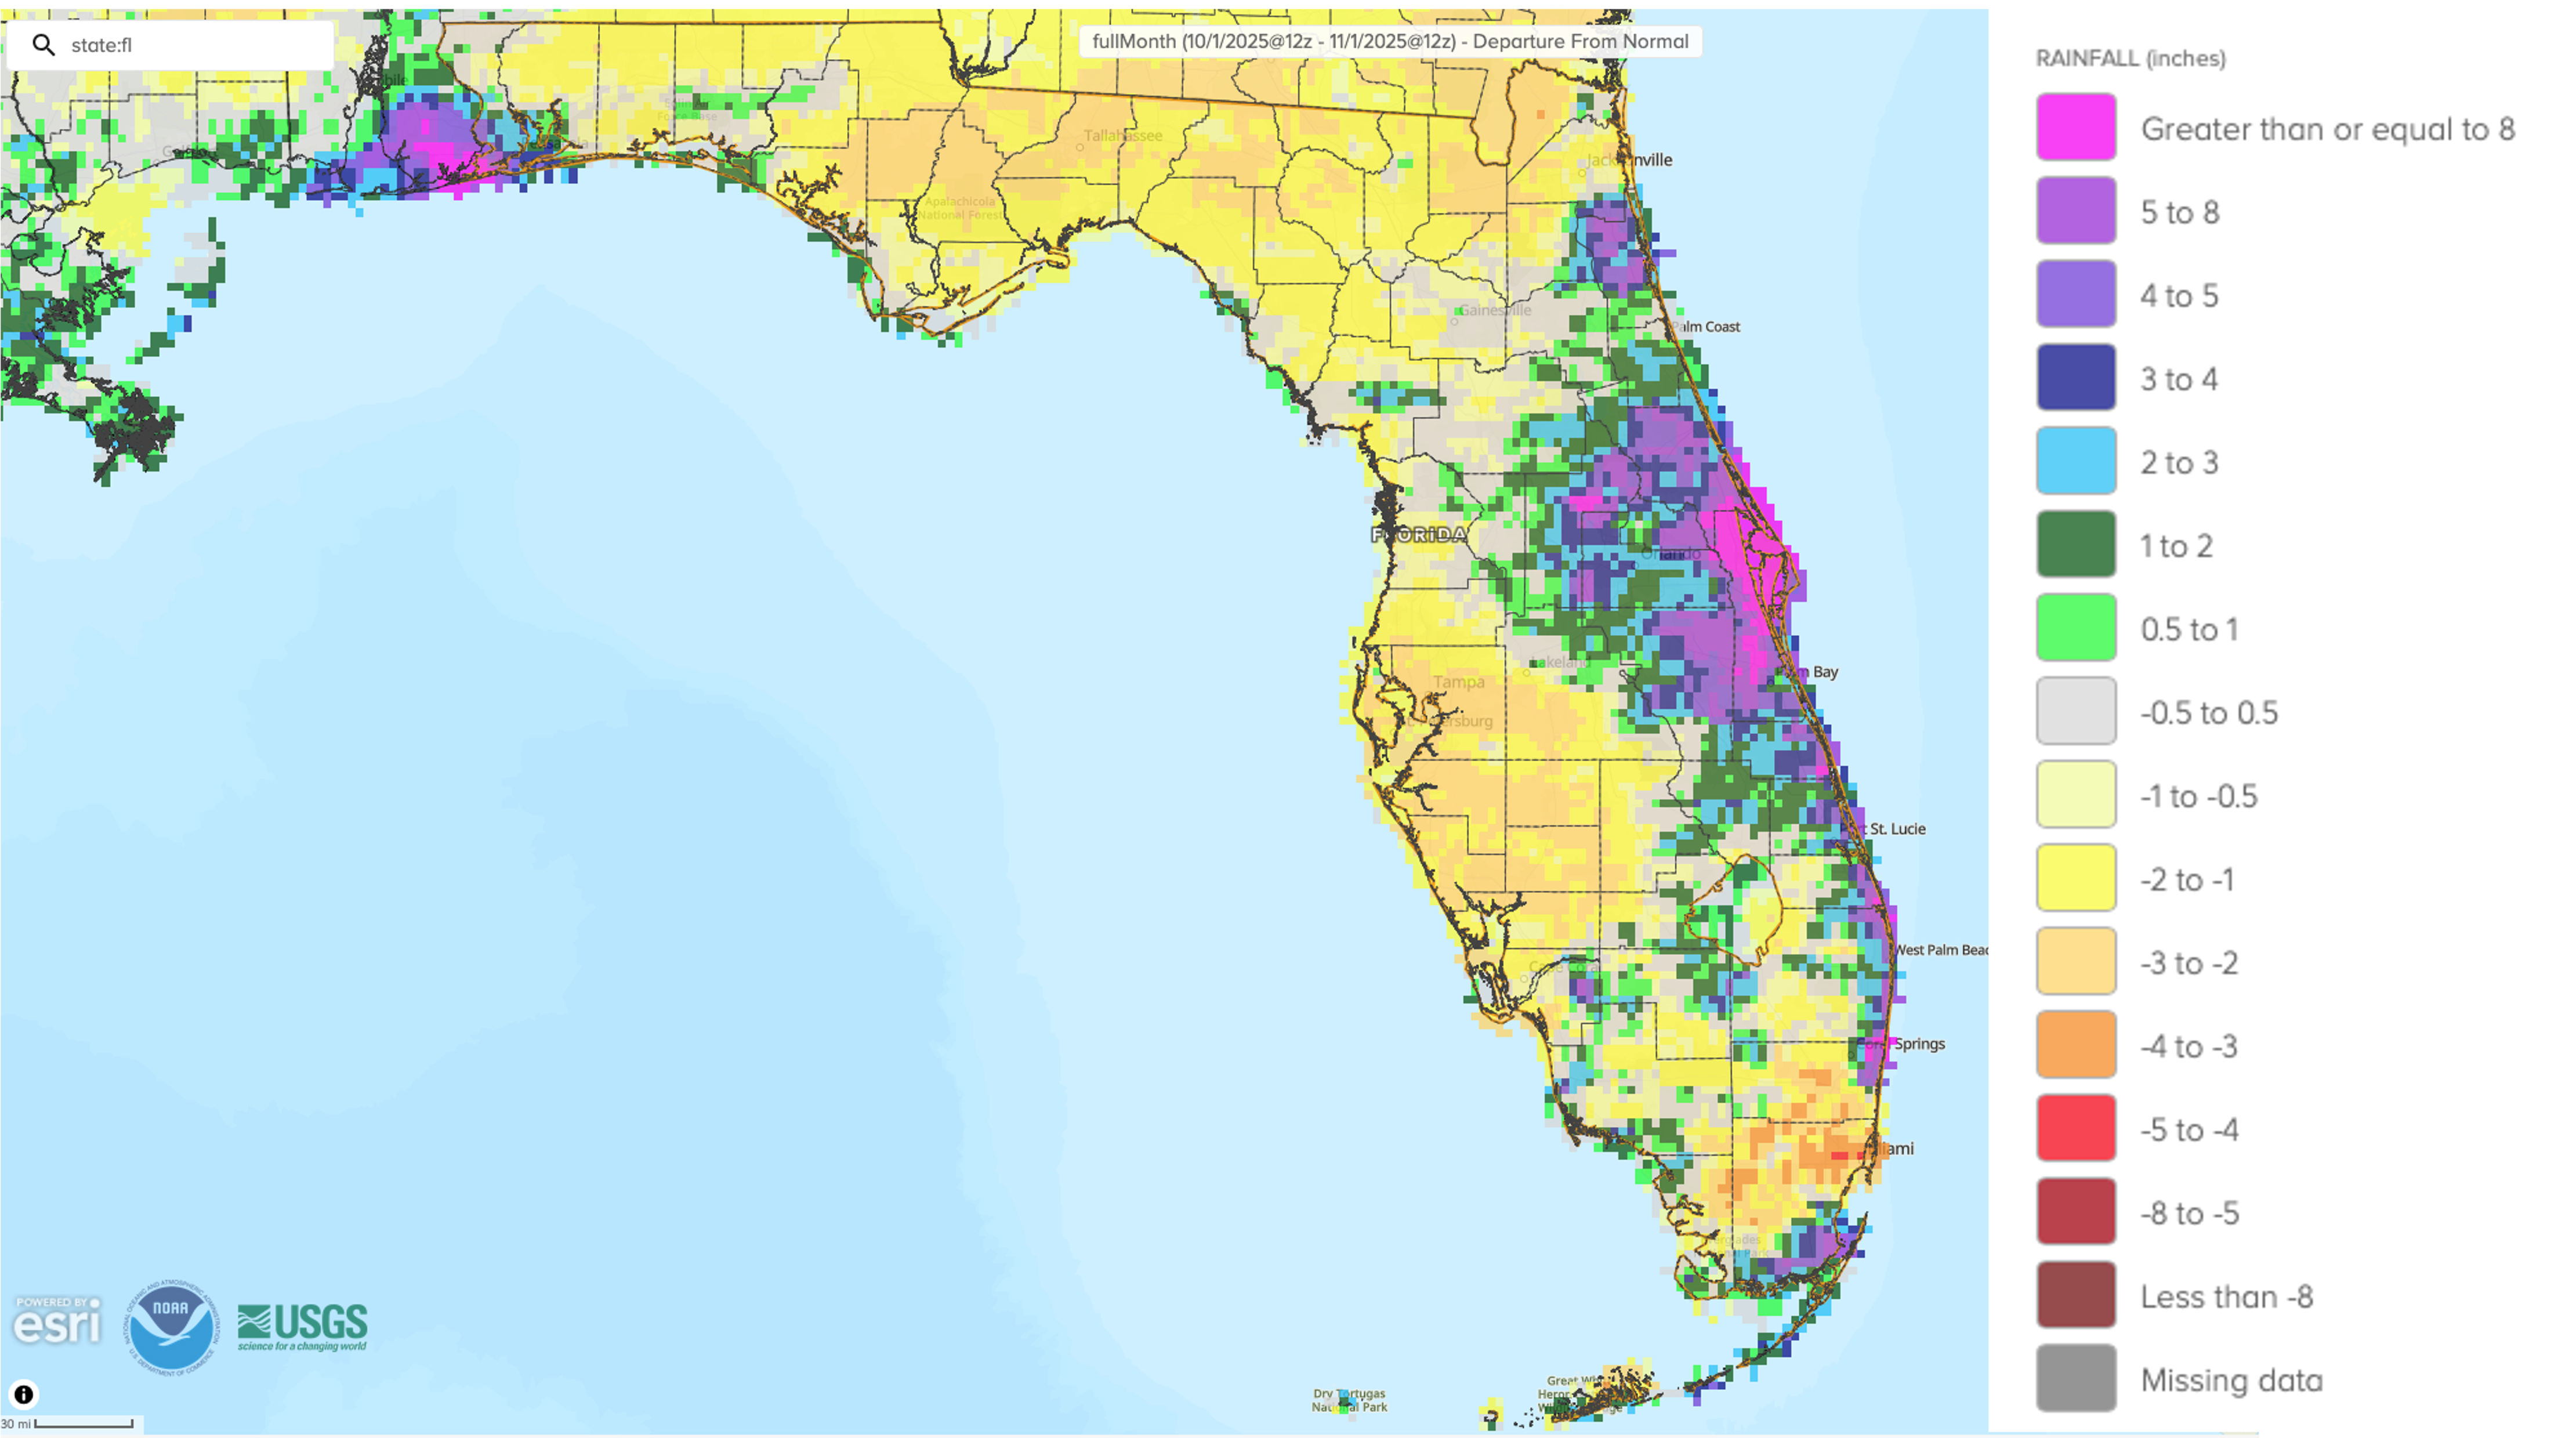
In the Florida Peninsula and along the east coast, a series of stalled fronts with onshore flows led to several rounds of locally heavy rainfall during the month. On the 26th, a stalled front across central Florida led to extreme rainfall across portions of northern Lake and northern Brevard counties. Two areas that received the heaviest rainfall were the Eustis and Mt. Dora areas with 14-19+ inches in less than 24 hours, and along the coast around Titusville and the Cape Canaveral area with around 6-13 inches. Titusville recorded an all-time daily record rainfall of 13.10 inches on the 27th, with data going back 109 years. In addition, Titusville measured its wettest October on record with a total of 21.08 inches, which was 16.02 inches above normal for the month. Several stations along the central-east coast are experiencing one of their wettest falls on record, September-October, including Titusville (1st-wettest), Daytona Beach (5th-wettest, based on 102 years), and Melbourne (9th-wettest, based on 83 years). Daily rainfall records broken during the month for select locations are provided in Appendix 2.
Table 2. October precipitation totals and departures from normal (inches) for selected cities.
| Station | Total Rainfall | Departure from Normal |
| Pensacola | 6.98 | +2.28 |
| Tallahassee | 0.95 | -2.29 |
| Jacksonville | 2.44 | -1.59 |
| Orlando | 4.53 | +1.07 |
| Tampa | 0.39 | -1.95 |
| Miami | 3.48 | -4.17 |
| Key West | 5.13 | -0.54 |
Figure 1. A graphical depiction of the monthly rainfall departure from normal (inches) for October (courtesy of NOAA, NWS).
La Niña Advisory.
La Niña conditions emerged in September 2025 with an expansion of below-average sea surface temperatures (SSTs) in the tropical equatorial Pacific Ocean. The latest weekly Niño-3.4 index value was -0.5°C, and other regions were at or between -0.1°C and -0.4°C. Negative subsurface temperature anomalies prevailed from the surface to a depth of 200m in the eastern equatorial Pacific Ocean. La Niña conditions are expected to persist through February 2026, with a transition to ENSO-neutral likely in January-March 2026 (55% chance).
Hazardous Weather Events in October.
According to the Local Storm Reports issued by the local National Weather Service offices serving Florida, there were 273 individual local reports of hazardous weather events recorded across the state during the month of October (see Table 3 for a breakdown by event type). Multiple reports of minor to moderate tidal flooding from King tides occurred along east and west coastal areas, with reports of street flooding impacting transportation. Heavy rainfall and flash flooding were reported in Brevard south to Broward counties on the 26-27th, as well as in Lake County where over 19 inches were reported in the Eustis and Mount Dora areas in under 24 hours. Other areas also saw extreme rainfall rates, such as Boca Raton which reported 5-7+ inches in 2 hours during this event. These excessive rainfall totals overwhelmed stormwater systems and caused substantial impacts in these areas, including numerous flooded homes and widespread street flooding that stranded vehicles and washed out portions of roadways, according to the National Weather Service. Also on the morning of the 27th, two tornadoes were reported in Bay County near Mexico Beach – an EF1 tornadic waterspout that moved onshore with estimated peak winds of 100 mph that had a path length of 1.23 miles, and a brief EF0 tornado with estimated peak winds of 70 mph and a path length of about 0.5 miles. The tornadoes caused damages to structures and the EF1 tornado led to 10 injuries. No fatalities were reported.
Table 3. Breakdown of storm reports submitted in Florida during the month of October (compiled from Iowa State University/Iowa Environmental Mesonet).
| Report Type | Number of Reports |
| Heavy Rain | 53 |
| Flash Flood | 14 |
| Flood | 16 |
| Hail | 1 |
| Marine Thunderstorm Wind | 9 |
| Non-Thunderstorm Wind Gust | 27 |
| Tornado/Waterspout/Funnel Cloud | 2 / 3 / 3 |
| Thunderstorm Wind Damage | 5 |
| Non-Thunderstorm Wind Damage | 1 |
| Thunderstorm Wind Gust | 39 |
| Rip Currents | 1 |
Daily Record Events in October.
Table 4. Summary of daily records broken or set in Florida in October (source: NCEI Daily Weather Records).
| Category | Number of Records |
| Highest daily max. temp. | 1 |
| Highest daily min. temp. | 5 |
| Lowest daily max. temp. | 13 |
| Lowest daily min. temp. | 0 |
| Highest daily precipitation | 26 |
| Total | 45 |
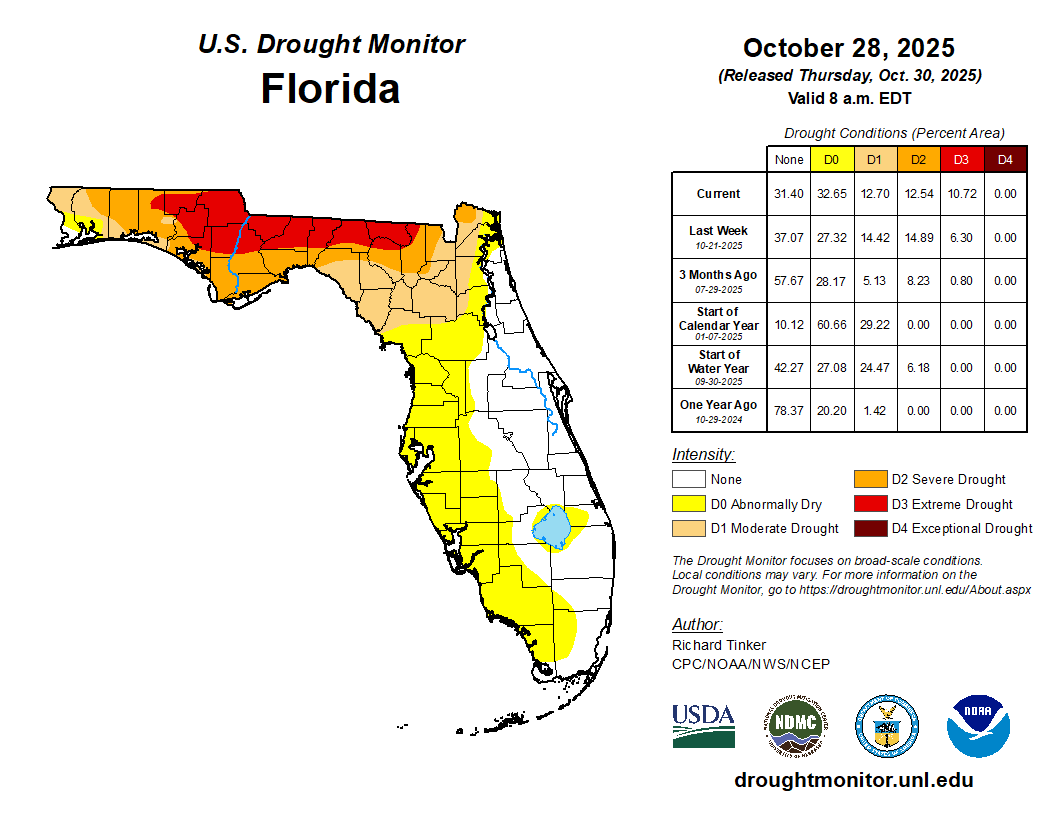
Drought-Related Impacts.
Drought persisted and deteriorated across northern Florida during October. In mid-October, approximately 5% of the state was in extreme drought (D3), 16% was in severe drought (D2), another 13% was in moderate drought (D1), and 25% was abnormally dry (D0), according to the U.S. Drought Monitor. By the end of the month, approximately 11% of the state was in extreme drought (D3), 13% was in severe drought (D2), 13% was in moderate drought (D1), and 33% of the state was abnormally dry (D0) (Figure 2 below).
As of October 31, the Lake Okeechobee water level was 13.91 ft. above sea level (Feet-NGVD29), which is below average for this time of year. At the first of the month, the water level was 13.53 ft. above sea level.
Figure 2. A graphical depiction of the latest drought conditions in Florida according to the U.S. Drought Monitor (courtesy of the National Drought Mitigation Center, University of Nebraska-Lincoln).
Appendix 1
Additional October departures from normal data for select Florida locations (Source: NWS).
| Station | Average Temperature (˚F) | Departure from Normal (˚F) | Total Rainfall (in.) | Departure from Normal (in.) |
| Gainesville | 72.0 | +0.6 | 2.50 | -0.18 |
| Sarasota | 78.2 | +0.9 | 0.90 | -1.86 |
| Melbourne | 76.1 | -0.2 | 11.50 | +6.64 |
| Fort Myers | 78.9 | +0.9 | 2.48 | -0.60 |
| West Palm Beach | 79.9 | +1.2 | 8.84 | +2.94 |
Appendix 2
Select daily record precipitation totals (inches) broken during October 2025 (compiled from NOAA).
| Location | Date | Record (in) | Broken/Tied | Last |
| Daytona Beach | 2 | 2.40 | Broken | 1.94 in 1948 |
| Melbourne | 5 | 1.90 | Broken | 1.40 in 1990 |
| Naples | 11 | 3.70 | Broken | 1.71 in 1947 |
| Pensacola | 26 | 2.34 | Broken | 1.57 in 2002 |
| Vero Beach | 26 | 3.77 | Broken | 1.28 in 2019 |
| West Palm Beach | 26 | 2.37 | Broken | 1.62 in 2012 |
| Orlando | 26 | 2.94 | Broken | 0.54 in 2012 |
| Deland | 27 | 2.50 | Broken | 2.30 in 1925 |
| Lisbon | 27 | 2.45 | Broken | 0.95 in 1997 |
| Sanford | 27 | 2.50 | Broken | 0.66 in 1989 |
| Stuart | 27 | 2.72 | Broken | 2.25 in 1989 |
| Titusville | 27 | 13.10 | Broken | 1.15 in 1969 |
| Vero Beach | 27 | 3.63 | Broken | 1.15 in 2019 |
| Deland | 28 | 2.50 | Broken | 1.15 in 1916 |
Prepared by Florida Climate Center
The Florida State University
Tallahassee, FL
Summary:
- Monthly temperatures in November were near to above normal across northern Florida and the Panhandle and near to below normal in the Peninsula and the Keys.
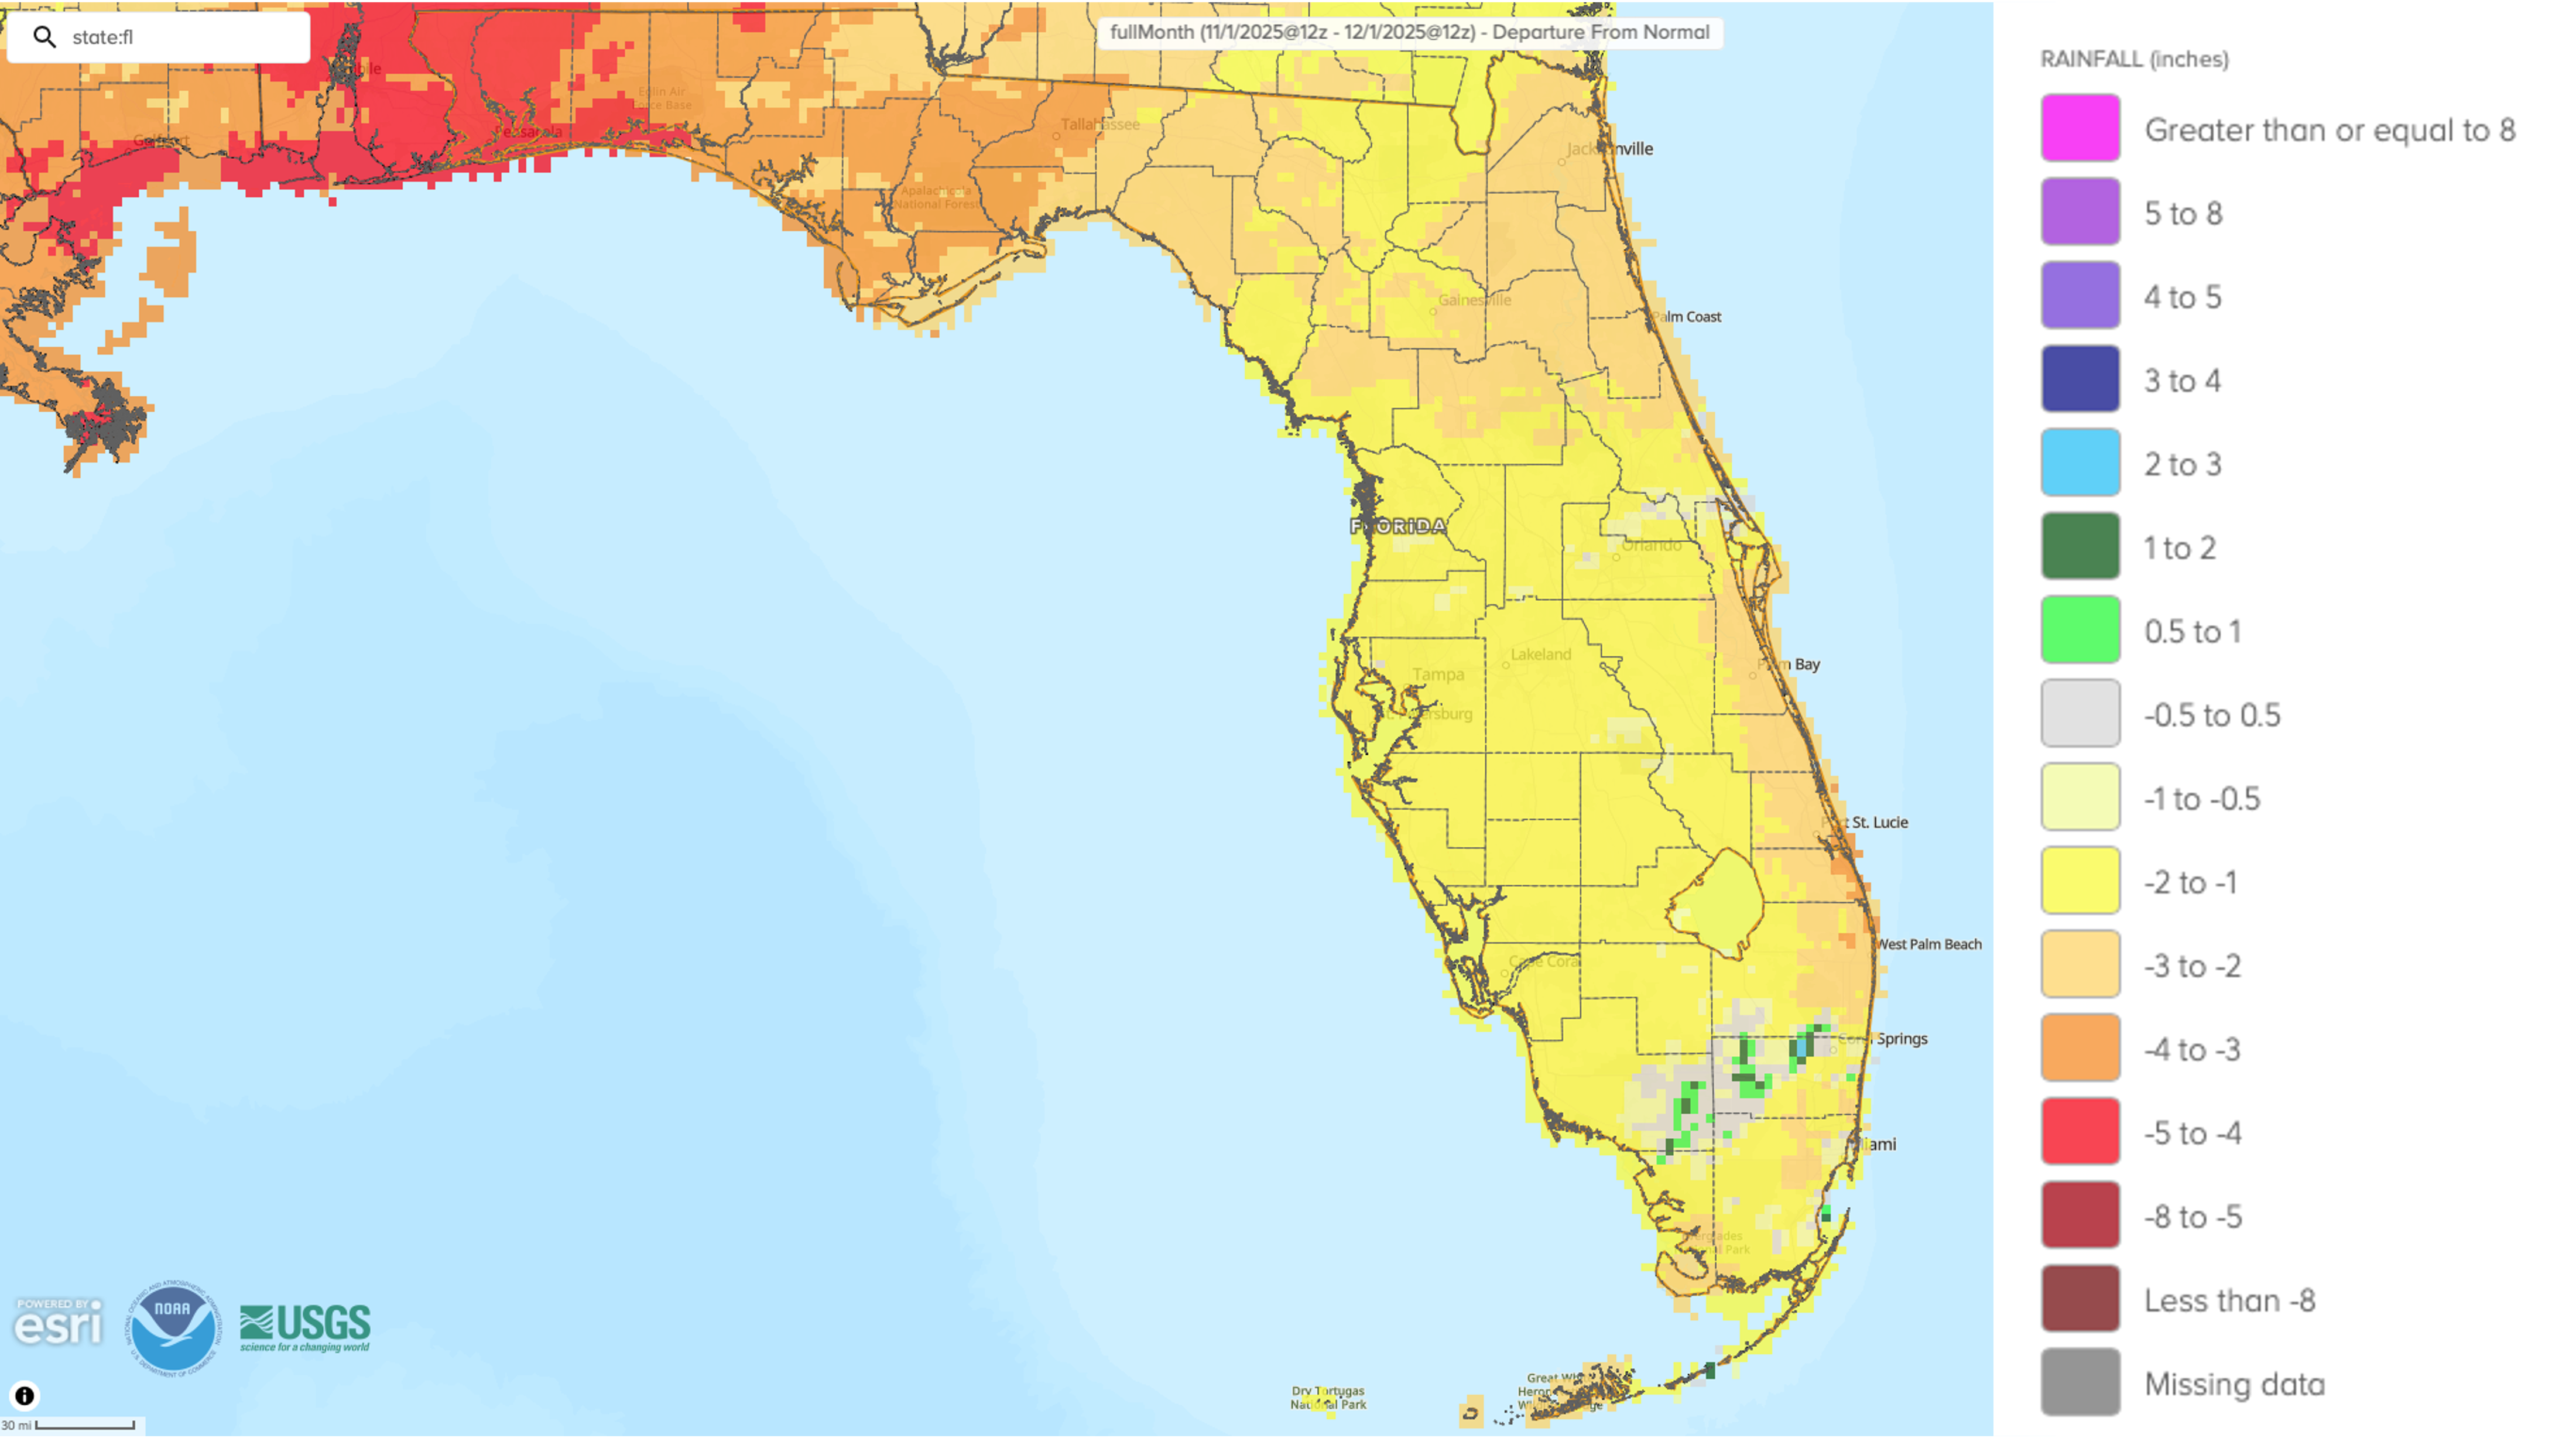
- Monthly precipitation totals in November were below normal across Florida.
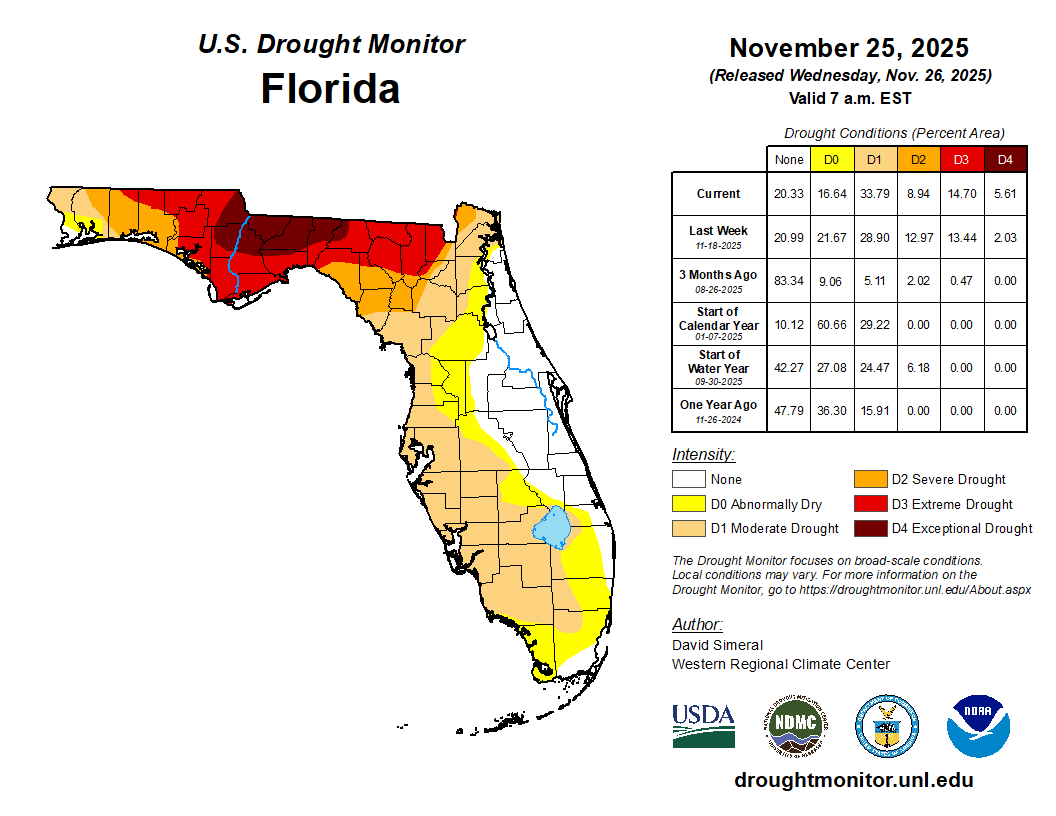
- Drought conditions expanded and worsened during the month, with exceptional drought (D4) being introduced in northern Florida.
- A La Niña advisory continues in the equatorial Pacific Ocean and is favored to persist through December-February 2026 with a transition to ENSO-neutral conditions expected January-March 2026 (61% chance).
- The Atlantic hurricane season closes out near normal with no U.S. hurricane landfalls for the first time in a decade.
Table 1. November average temperatures and departures from normal ( ̊F) for select cities.
| Station | Mean Temperature | Departure from Normal |
| Pensacola | 62.4 | +1.0 |
| Tallahassee | 60.4 | +0.2 |
| Jacksonville | 62.6 | +0.3 |
| Orlando | 67.4 | -0.8 |
| Tampa | 69.9 | +0.1 |
| Miami | 74.5 | -0.3 |
| Key West | 75.6 | -1.0 |
Figure 1. Monthly average temperature departures from normal (°F) for November 2025 for Florida.
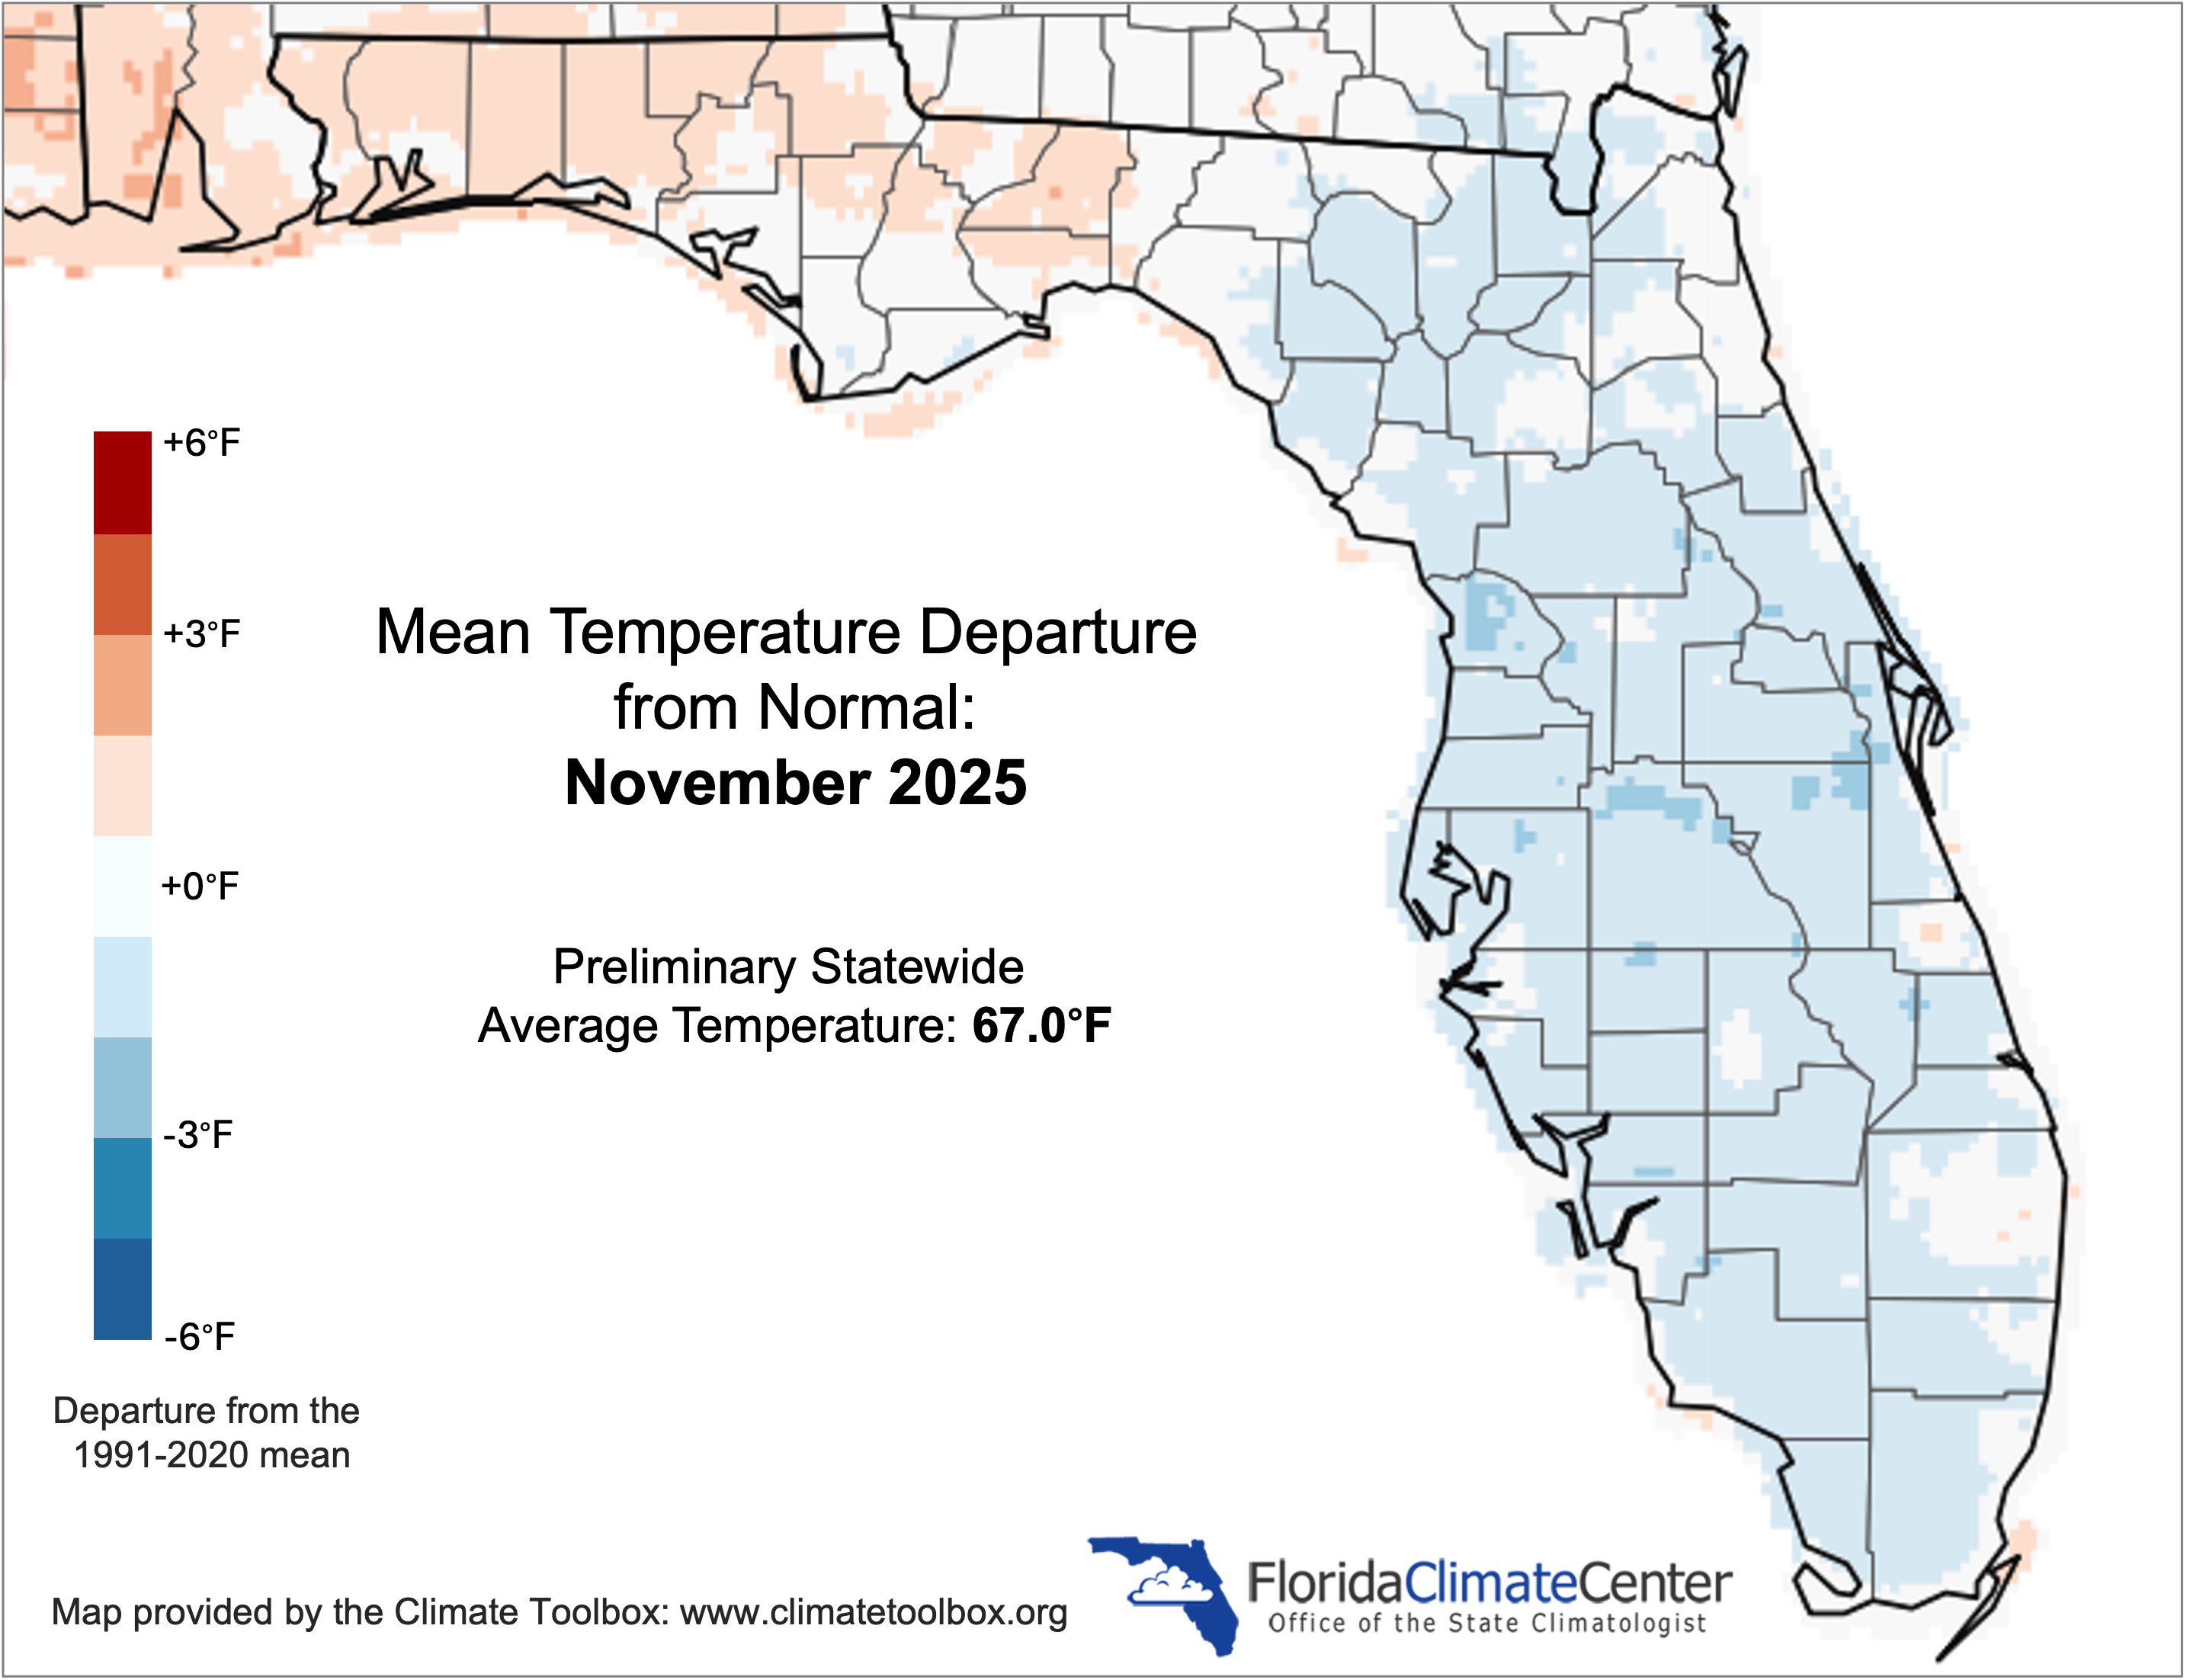
Table 2. November precipitation totals and departures from normal (inches) for selected cities.
| Station | Total Rainfall | Departure from Normal |
| Pensacola | 0.08 | -4.34 |
| Tallahassee | 0.10 | -3.00 |
| Jacksonville | 0.00 | -2.00 |
| Orlando | 0.07 | -1.72 |
| Tampa | 0.07 | -1.33 |
| Miami | 1.76 | -1.77 |
| Key West | 0.09 | -1.96 |
Figure 2. A graphical depiction of the monthly rainfall departure from normal (inches) for November (courtesy of NOAA, NWS).
La Niña Advisory.
La Niña conditions continued over the past month in the tropical equatorial Pacific Ocean. Below-average sea surface temperatures strengthened across the central and eastern regions of the equatorial Pacific, and the latest weekly Niño indices were between -0.5°C and -0.7°C. Negative subsurface temperature anomalies also persisted. La Niña conditions are favored to continue through December-February 2026; however, uncertainty remains high with a 51% chance for La Niña and 48% chance for ENSO-neutral. La Niña is favored to remain weak. In summary, La Niña is favored to continue through the Northern Hemisphere winter, and a transition to ENSO-neutral is more likely in January-March 2026 (61% chance).
Hazardous Weather Events in November.
According to the Local Storm Reports issued by the local National Weather Service offices serving Florida, there were 17 individual local reports of hazardous weather events recorded across the state during the month of November (see Table 3 for a breakdown by event type).
Table 3. Breakdown of storm reports submitted in Florida during the month of November (compiled from Iowa State University/Iowa Environmental Mesonet).
| Report Type | Number of Reports |
| Heavy Rain | 0 |
| Flash Flood | 0 |
| Flood | 1 |
| Hail | 3 |
| Marine Thunderstorm Wind | 1 |
| Non-Thunderstorm Wind Gust | 10 |
| Tornado/Waterspout/Funnel Cloud | 0 / 1 / 0 |
| Thunderstorm Wind Damage | 1 |
| Non-Thunderstorm Wind Damage | 0 |
| Thunderstorm Wind Gust | 0 |
Daily Record Events in November.
Table 4. Summary of daily records broken or set in Florida in November (source: NCEI Daily Weather Records).
| Category | Number of Records |
| Highest daily max. temp. | 32 |
| Highest daily min. temp. | 5 |
| Lowest daily max. temp. | 49 |
| Lowest daily min. temp. | 79 |
| Highest daily precipitation | 2 |
| Total | 167 |
Weather/Climate Highlights of the Month: 2025 Atlantic Hurricane Season Wraps Up Near Normal
The 2025 Atlantic hurricane season officially ended November 30. The season saw a total of 13 named storms, which included 5 hurricanes with 4 of those becoming major hurricanes (category 3 or higher on the Saffir-Simpson Scale). Additionally, of the 4 major hurricanes, 3 of those reached category 5 strength. This represents an impressive ratio of major hurricanes to hurricanes for a season. The climatological average number of storms in a season is 14 named storms, 7 hurricanes, and 3 major hurricanes. You can see that while we did not have the above-average season that was expected, the Atlantic Basin had conditions that were favorable for the intensification of storms that did form. The Accumulated Cyclone Energy (ACE), which combines intensity and duration of all Atlantic named storms occurring during the season as a measure of overall activity, was slightly above average for the season at 108% of average.
The strongest storm of the season was Hurricane Melissa, which made landfall in southwest Jamaica on October 28 with peak sustained winds of 185 mph and a minimum central pressure of 892 mb. This makes Hurricane Melissa tied for most powerful landfalling hurricane in the Atlantic Basin, tied with the Labor Day Hurricane of 1935 for pressure and tied with the Labor Day Hurricane of 1935 and Hurricane Dorian (2019) for wind speed. Overall, Melissa ranks in the top 3 strongest Atlantic hurricanes based on both wind speed and central pressure. The 2025 season was the first season since 2015 with no U.S. landfalling hurricanes.
Drought-Related Impacts.
Drought expanded and worsened in Florida during November. In mid-November, approximately 13% of the state was in extreme drought (D3), 13% was in severe drought (D2), and 20% was in moderate drought (D1); about 28% of the state was abnormally dry (D0), according to the U.S. Drought Monitor. By the end of the month, approximately 6% of the state was in exceptional drought (D4), 15% of the state was in extreme drought (D3), 9% was in severe drought (D2), 34% was in moderate drought (D1), and 17% of the state was abnormally dry (D0) (Figure 2 below).
As of November 30, the Lake Okeechobee water level was 13.66 ft. above sea level (Feet-NGVD29), which is below average for this time of year. At the first of the month, the water level was 13.96 ft. above sea level.
Figure 3. A graphical depiction of the latest drought conditions in Florida according to the U.S. Drought Monitor (courtesy of the National Drought Mitigation Center, University of Nebraska-Lincoln).
Agriculture-Related Impacts.
Appendix 1
Additional November departures from normal data for select Florida locations (source: NWS). "T" denotes a trace of precipitation.
| Station | Average Temperature (˚F) | Departure from Normal (˚F) | Total Rainfall (in.) | Departure from Normal (in.) |
| Gainesville | 63.8 | +1.1 | 0.00 | -1.79 |
| Sarasota | 69.6 | -0.5 | 0.48 | -1.33 |
| Melbourne | 67.3 | -1.7 | 0.39 | -2.16 |
| Fort Myers | 70.8 | -0.7 | T | -1.78 |
| West Palm Beach | 72.9 | -0.1 | 0.40 | -3.22 |
Appendix 2
Select daily record low maximum temperatures broken or tied during November 2025 (compiled from NOAA).
| Location | Date | Record (˚F) | Broken/Tied | Last |
| Pensacola | 10 | 53 | Broken | 57 in 1968 |
| Crestview | 10 | 52 | Broken | 57 in 2011 |
| Bradenton | 11 | 55 | Broken | 65 in 2011 |
| Chipley | 11 | 52 | Broken | 55 in 1977 |
| Daytona Beach | 11 | 63 | Broken | 65 in 1926 |
| Jasper | 11 | 57 | Broken | 58 in 1990 |
| Lake City | 11 | 54 | Tied | 54 in 1913 |
| Ocala | 11 | 57 | Broken | 61 in 1905 |
| Tarpon Springs | 11 | 54 | Broken | 57 in 1894 |
| Venice | 11 | 56 | Broken | 70 in 2011 |
| Orlando | 11 | 58 | Broken | 64 in 1977 |
| Gainesville | 11 | 56 | Broken | 63 in 1987 |
| Daytona Beach | 11 | 55 | Broken | 60 in 1943 |
| Jacksonville | 11 | 55 | Broken | 61 in 1996 |
| Clermont | 12 | 59 | Broken | 62 in 1987 |
| Deland | 12 | 55 | Broken | 57 in 1894 |
| Lisbon | 12 | 54 | Broken | 63 in 1996 |
| Melbourne | 12 | 57 | Broken | 65 in 1977 |
| Stuart | 12 | 63 | Broken | 66 in 1968 |
| Titusville | 12 | 57 | Broken | 60 in 1987 |
Building A, Suite 292
Tallahassee, FL 32306-2741
Phone: (850) 644-3417 | (850) 644-0719
climate@coaps.fsu.edu