


The Florida Climate Center serves as the primary resource for climate data, information, and services in the state of Florida.
Learn more

The Florida Climate Center achieves its mission by providing climate monitoring, research, and expertise to be applied by the people, institutions, and businesses of Florida and the surrounding region.
We provide direct service by fulfilling requests for climate and weather data and information in a variety of formats.
We perform research that advances the understanding of the climate variability and changes of Florida and the surrounding region.
We provide outreach in presentations and at events aimed at a variety of groups, interests, and ages.
Prepared by Florida Climate Center
The Florida State University
Tallahassee, FL

Summary:
- Overall, December monthly temperatures averaged out to near normal for the month.
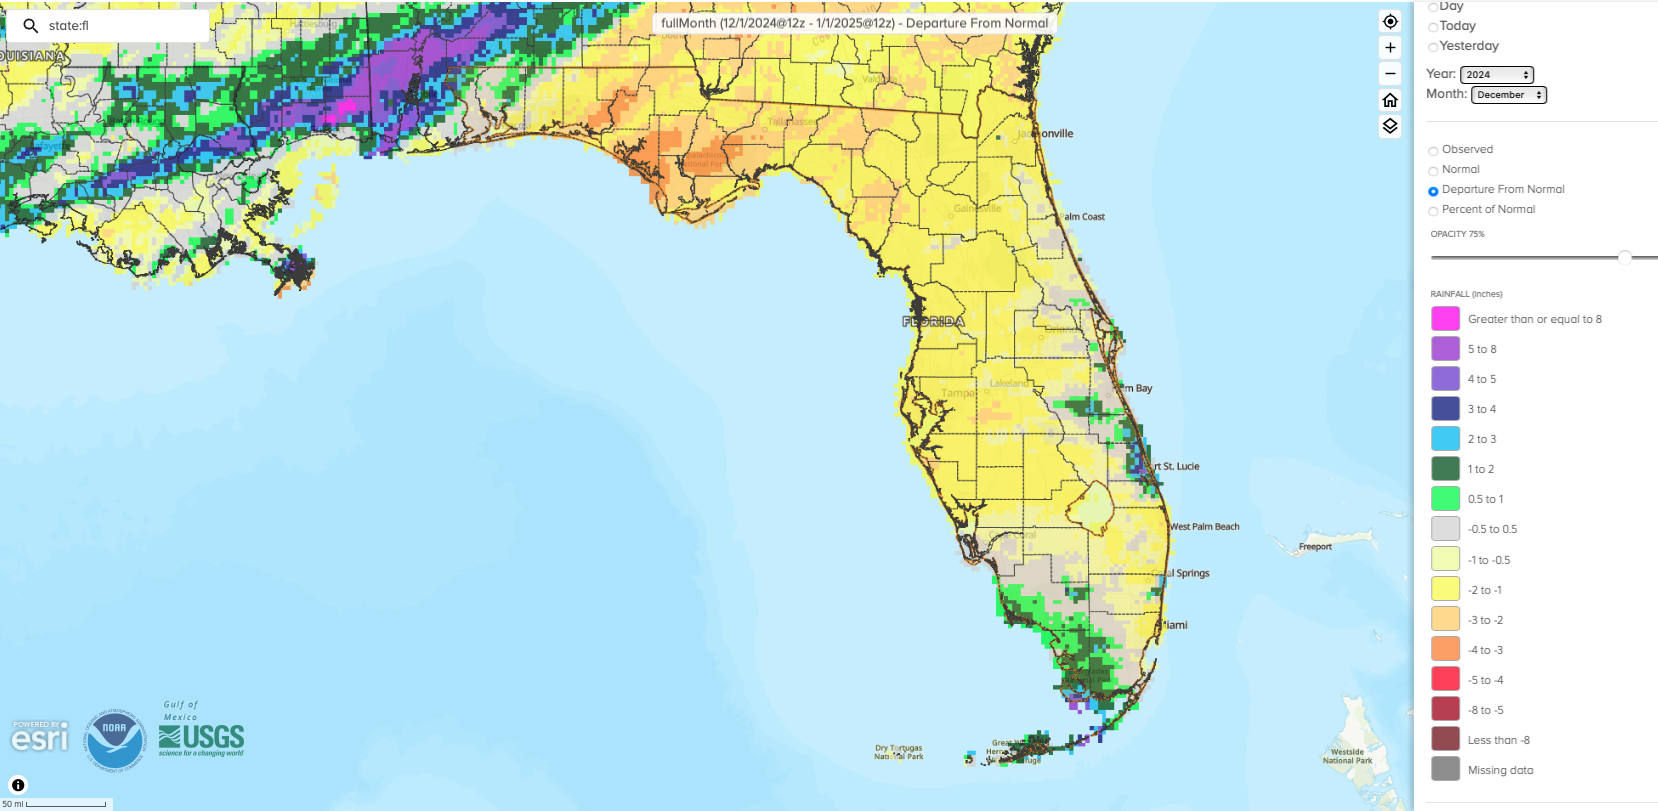
- Monthly precipitation totals were below normal in December in Florida, except for the east-central and southwestern coasts and Keys.
- By the end of the month, approximately 29% of the state was in moderate drought (D1) and 61% was abnormally dry (D0), according to the U.S. Drought Monitor.
- La Niña conditions emerged in the tropical equatorial Pacific Ocean during December 2024 and are expected to persist through February-April 2025 (59% chance) before transitioning to ENSO-neutral likely during March-May 2025 (60% chance).
While temperatures fluctuated throughout the month, overall average monthly temperatures in December ended up near normal in Florida. Average monthly temperature departures from normal ranged from -1.3 ̊F in Key West to +1.2 ̊F in Tallahassee for the month (see Table 1 and Appendix 1 for select cities). A cold front impacted the northern half of the state during the first week of the month and led to freezing temperatures across the Panhandle. Minimum temperatures fell to a low of 25 ̊ F in Tallahassee and 26 ̊ F in Gainesville on the 4th. Despite the cold start to the month, temperatures during the second half of December were generally above normal to close out another warm year in Florida. Average temperature departures from normal during the last week of the month ranged from +4-8 ̊ F above normal, with some isolated stations reporting even warmer conditions. Statewide, December 2024 ranked 48th-warmest over the past 130 years with a statewide monthly average temperature of 60.9 ̊F, which was 2.1 ̊F above the long-term mean.
Table 1. December average temperatures and departures from normal ( ̊F) for selected cities.
| Station | Mean Temperature | Departure from Normal |
| Pensacola | 56.0 | +0.5 |
| Tallahassee | 55.6 | +1.2 |
| Jacksonville | 57.0 | +0.3 |
| Orlando | 63.9 | +0.6 |
| Tampa | 64.8 | -0.1 |
| Miami | 71.7 | +0.5 |
| Key West | 71.7 | -1.3 |
Monthly precipitation totals were below normal in December, except for the east-central and southwestern coasts and Keys. The monthly precipitation departures from normal ranged from -3.05 inches in Tallahassee to +1.15 inches in Key West (see Table 2 and Appendix 1 for select locations). Sarasota/Bradenton had its 4th-driest December on record (based on 109 years), and Tallahassee had its 8th-driest December on record (based on 114 years). Statewide, December 2024 ranked as the 39th-driest December on record. While December was dry, many stations closed out the calendar year with a surplus of rainfall. Both Tampa and Fort Myers recorded their wettest year on record in 2024 (Jan. 1 - Dec. 31) with +30.51 inches and +23.04 inches of surplus rainfall compared to normal, respectively.
Table 2. December precipitation totals and departures from normal (inches) for selected cities.
| Station | Total Rainfall | Departure from Normal |
| Pensacola | 5.12 | -0.28 |
| Tallahassee | 1.19 | -3.05 |
| Jacksonville | 1.08 | -1.70 |
| Orlando | 1.83 | -0.65 |
| Tampa | 0.78 | -1.78 |
| Miami | 1.18 | -1.26 |
| Key West | 3.31 | +1.15 |
Figure 1. A graphical depiction of the monthly rainfall departure from normal (inches) for December (courtesy of NOAA, NWS).
La Niña Advisory.
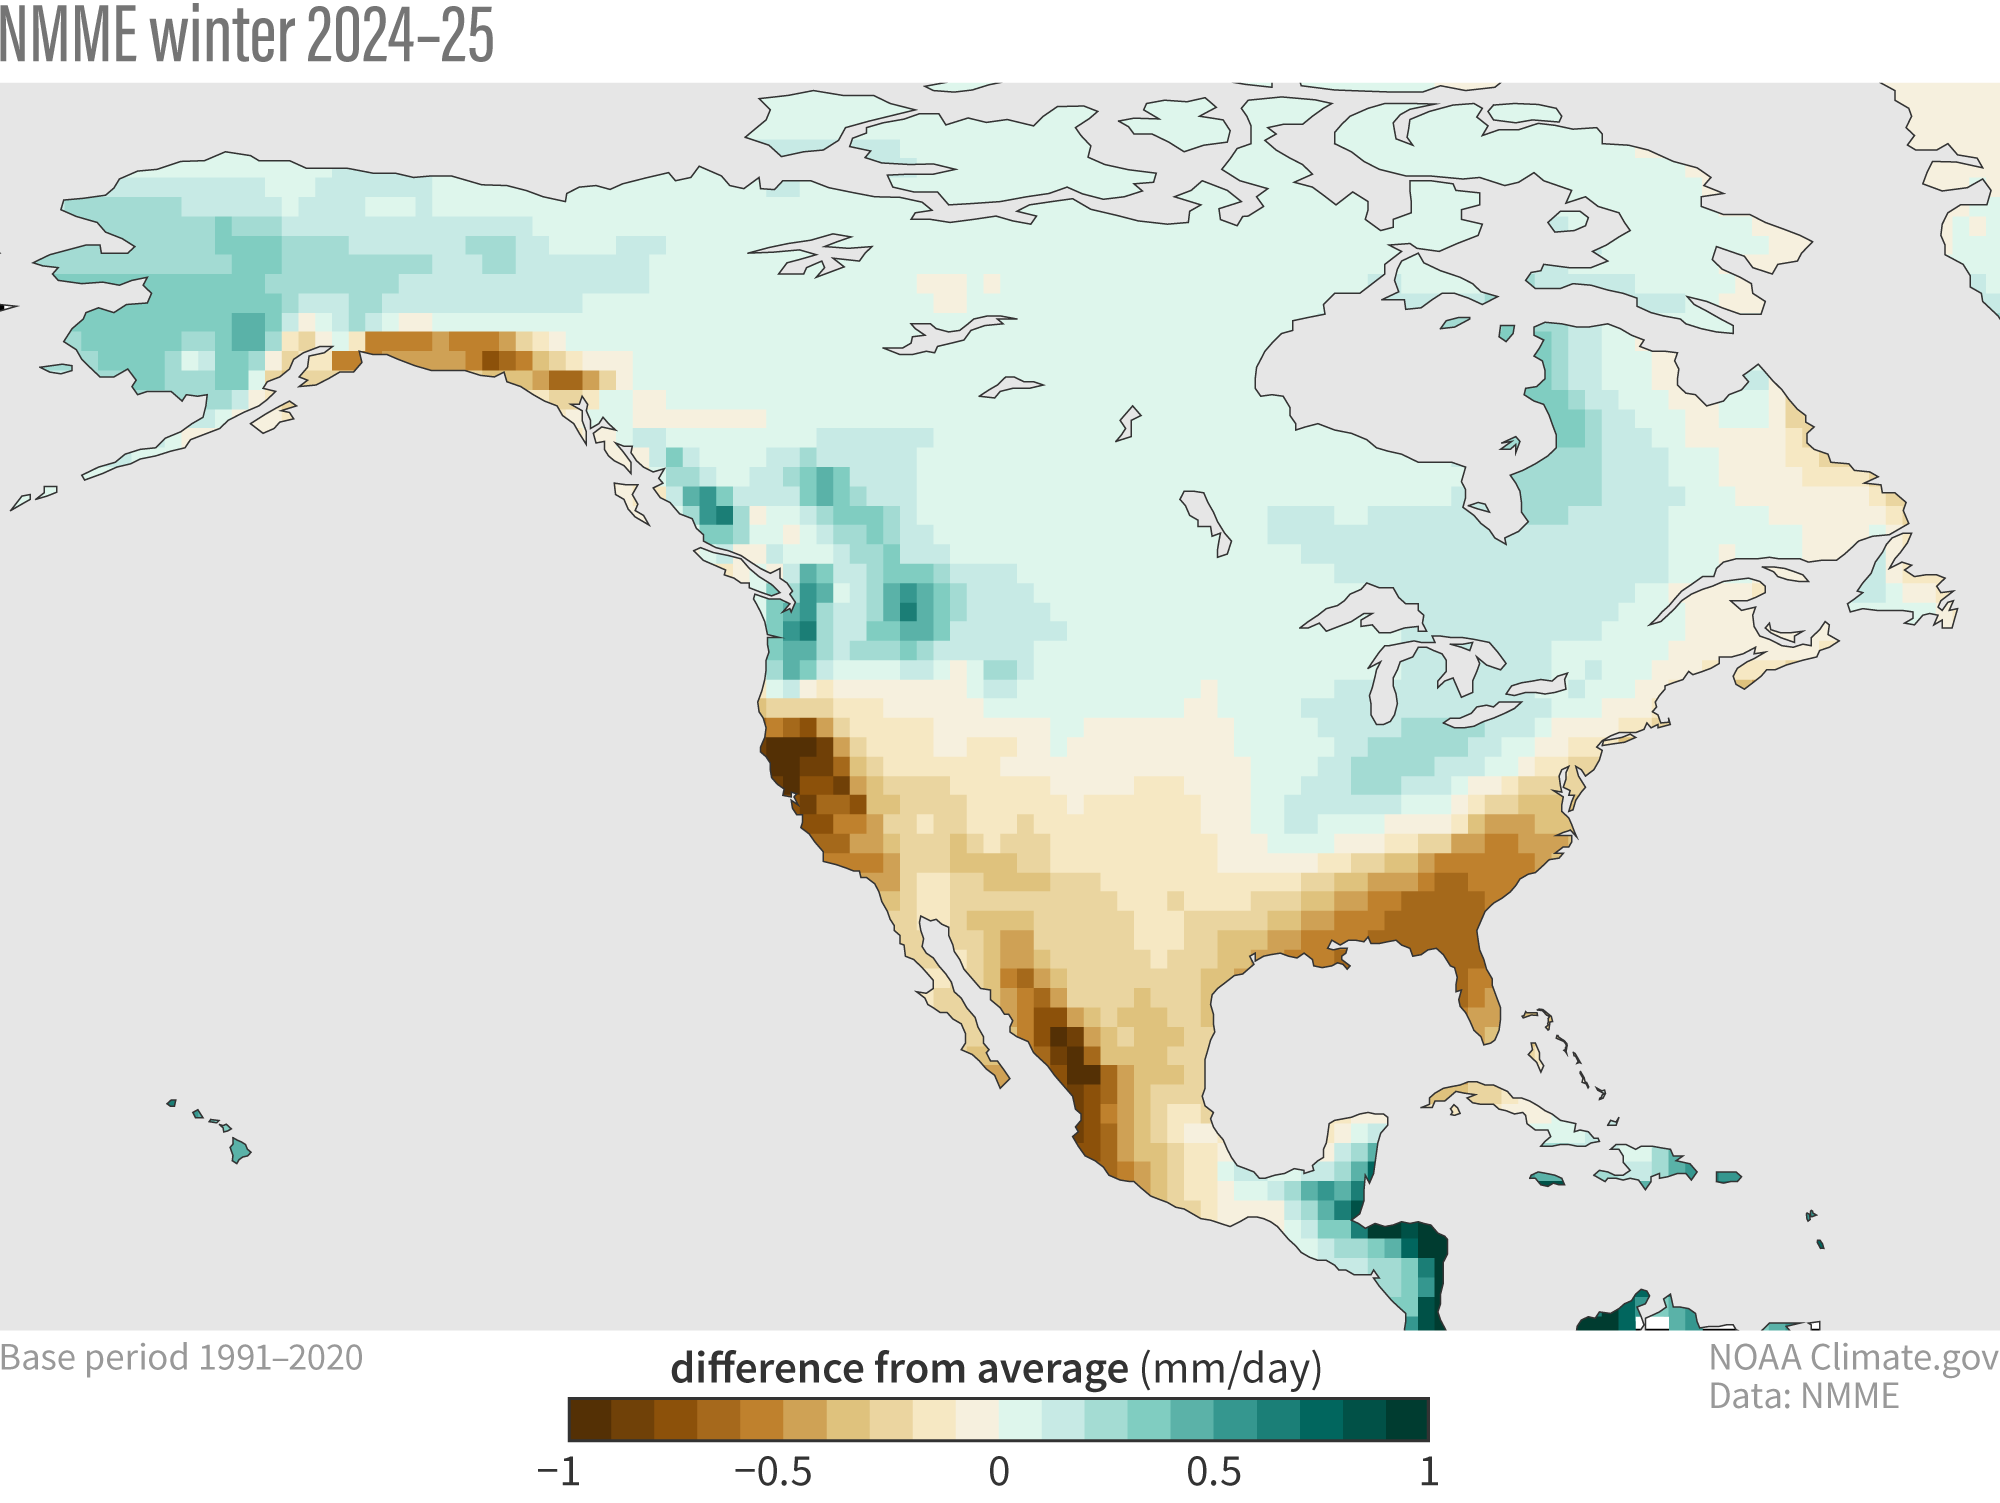
During December 2024, La Niña conditions emerged in the tropical equatorial Pacific Ocean as sea surface temperatures fell below average in the central and eastern equatorial Pacific Ocean. The latest weekly Niño indices were -0.7 ̊C in the Niño-3.4 and -0.6 ̊C in the Niño-4 regions. Models continue to indicate a weak La Niña during this winter season, persisting through February-April 2025 (59% chance) before transitioning to ENSO-neutral likely during March-May 2025 (60% chance). While weak La Niña events are less likely to result in conventional winter/spring impacts, it can still influence the CPC seasonal forecast guidance. Currently, the North American Multi-Model Ensemble (NMME) forecasts a typical La Niña signature with drier than normal conditions this winter (December – February) across the southern tier of the U.S. (Figure 2)
Hazardous Weather Events in December.
According to the Local Storm Reports issued by the local National Weather Service offices serving Florida, there were 71 individual local reports of hazardous weather events recorded across the state during the month of December (see Table 3 for a breakdown by event type). Severe thunderstorms affected parts of the state in December, with heavy rainfall, hail, and damaging winds.
Table 3. Breakdown of storm reports submitted in Florida during the month of December (compiled from Iowa State University/Iowa Environmental Mesonet).
| Report Type | Number of Reports |
| Heavy Rain | 2 |
| Flood | 5 |
| Flash Flood | 0 |
| Hail | 3 |
| Marine Thunderstorm Wind | 9 |
| Non-Thunderstorm Wind Gust | 12 |
| Non-Thunderstorm Wind Damage | 0 |
| Tornado/Waterspout/Funnel Cloud | 0/0/0 |
| Thunderstorm Wind Damage | 10 |
| Thunderstorm Wind Gust | 30 |
| Rip Currents | 0 |
Daily Record Events in December.
Table 4. Summary of daily records broken or set in Florida in December (source: NCEI Daily Weather Records).
| Category | Number of Records |
| Highest daily max. temp. | 11 |
| Highest daily min. temp. | 12 |
| Lowest daily max. temp. | 1 |
| Lowest daily min. temp. | 4 |
| Highest daily precipitation | 15 |
| Total | 43 |
Drought-Related Impacts.
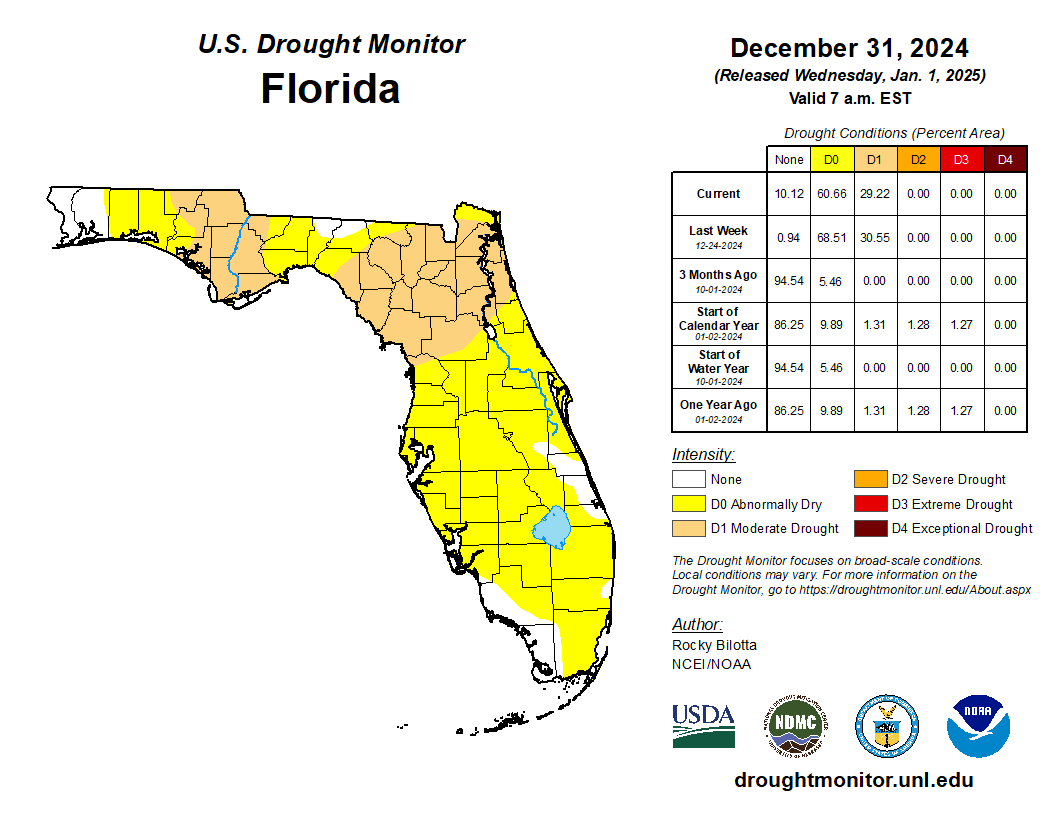
In mid-December, about 29% of the state was in moderate drought (D1) and roughly 70% of the state was abnormally dry (D0), according to the U.S. Drought Monitor. Conditions stayed about the same for the remainder of the month. By the end of the month, moderate drought (D1) continued to affect about 29% of the state and 61% of the state remained abnormally dry (D0) (Figure 3 below).
As of January 1, the Lake Okeechobee water level was 15.12 ft. above sea level (Feet-NGVD29), which is above average for this time of year. At the first of the month, the water level was around 15.70 ft. above sea level.
Figure 3. A graphical depiction of the latest drought conditions in Florida according to the U.S. Drought Monitor (courtesy of the National Drought Mitigation Center, University of Nebraska-Lincoln).
Agriculture-Related Impacts.
Total monthly rainfall fell short in December, with nearly 90% of the state in moderate drought (D1) or experiencing abnormally dry conditions (D0) by the end of the month. Pasture conditions were mostly fair to good during December, despite the cold and dry weather at the beginning of the month that led to freezes. Cattle remained in mostly good to fair condition. Sugarcane planting and harvesting progressed well and grove operations continued. Crops planted and harvested included strawberries, squash, peppers, tomato, snap peas, and others. For more information, consult the Crop Progress State Stories, which is published by the USDA’s National Agricultural Statistics Service December through March.
Appendix 1
Additional December departures from normal data for select Florida locations (Source: NWS).
| Station | Average Temperature (˚F) | Departure from Normal (˚F) | Total Rainfall (in.) | Departure from Normal (in.) |
| Gainesville | 57.0 | -0.3 | 1.38 | -1.50 |
| Sarasota | 65.8 | +0.6 | 0.18 | -2.15 |
| Melbourne | 64.9 | +0.2 | 2.98 | +0.62 |
| Fort Myers | 67.5 | +0.2 | 1.41 | -0.49 |
| West Palm Beach | 69.6 | +0.6 | 1.16 | -2.32 |
Prepared by Florida Climate Center
The Florida State University
Tallahassee, FL
Summary:
- Average monthly temperatures in February were much above average in Florida.
- Monthly precipitation totals in February were generally below normal, except for parts of coastal east-central Florida and the Keys.
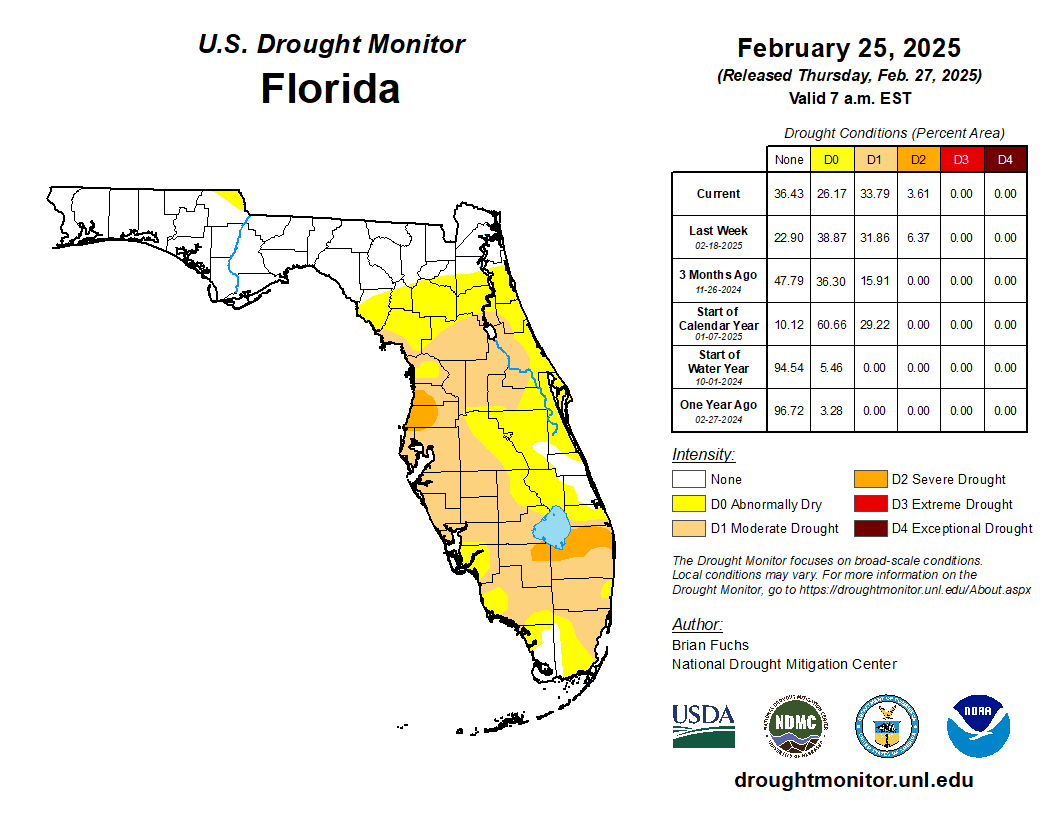
- By the end of February, approximately 4% of the state was in severe drought (D2) and 34% was in moderate drought (D1), while 26% was abnormally dry (D0), according to the U.S. Drought Monitor.
- La Niña conditions persisted in the tropical equatorial Pacific Ocean over the past month; a transition to ENSO-neutral is expected during March-May 2025 (66% chance).
Average monthly temperatures in February were above average in Florida. Average monthly temperature departures from normal ranged from +2.7 ̊F in Key West to +5.5 ̊F in Tallahassee for the month (see Table 1 and Appendix 1 for select cities). The month started off especially warm, with average temperatures from February 1-14 record warm in Tallahassee, Gainesville, Orlando, Melbourne, Sarasota, Fort Myers, and Miami. Cooler weather affected the state during the second part of the month, with mean temperatures averaging out to 3 ̊F -5 ̊F above average for the month as a whole. Several stations recorded one of their top 10 warmest months of February on record. Select daily high maximum temperature records tied or broken during the month are provided in Appendix 2.
Table 1. February average temperatures and departures from normal ( ̊F) for selected cities.
| Station | Mean Temperature | Departure from Normal |
| Pensacola | 59.8 | +3.0 |
| Tallahassee | 61.1 | +5.5 |
| Jacksonville | 61.4 | +3.9 |
| Orlando | 68.7 | +5.1 |
| Tampa | 68.6 | +3.9 |
| Miami | 74.6 | +3.9 |
| Key West | 75.0 | +2.7 |
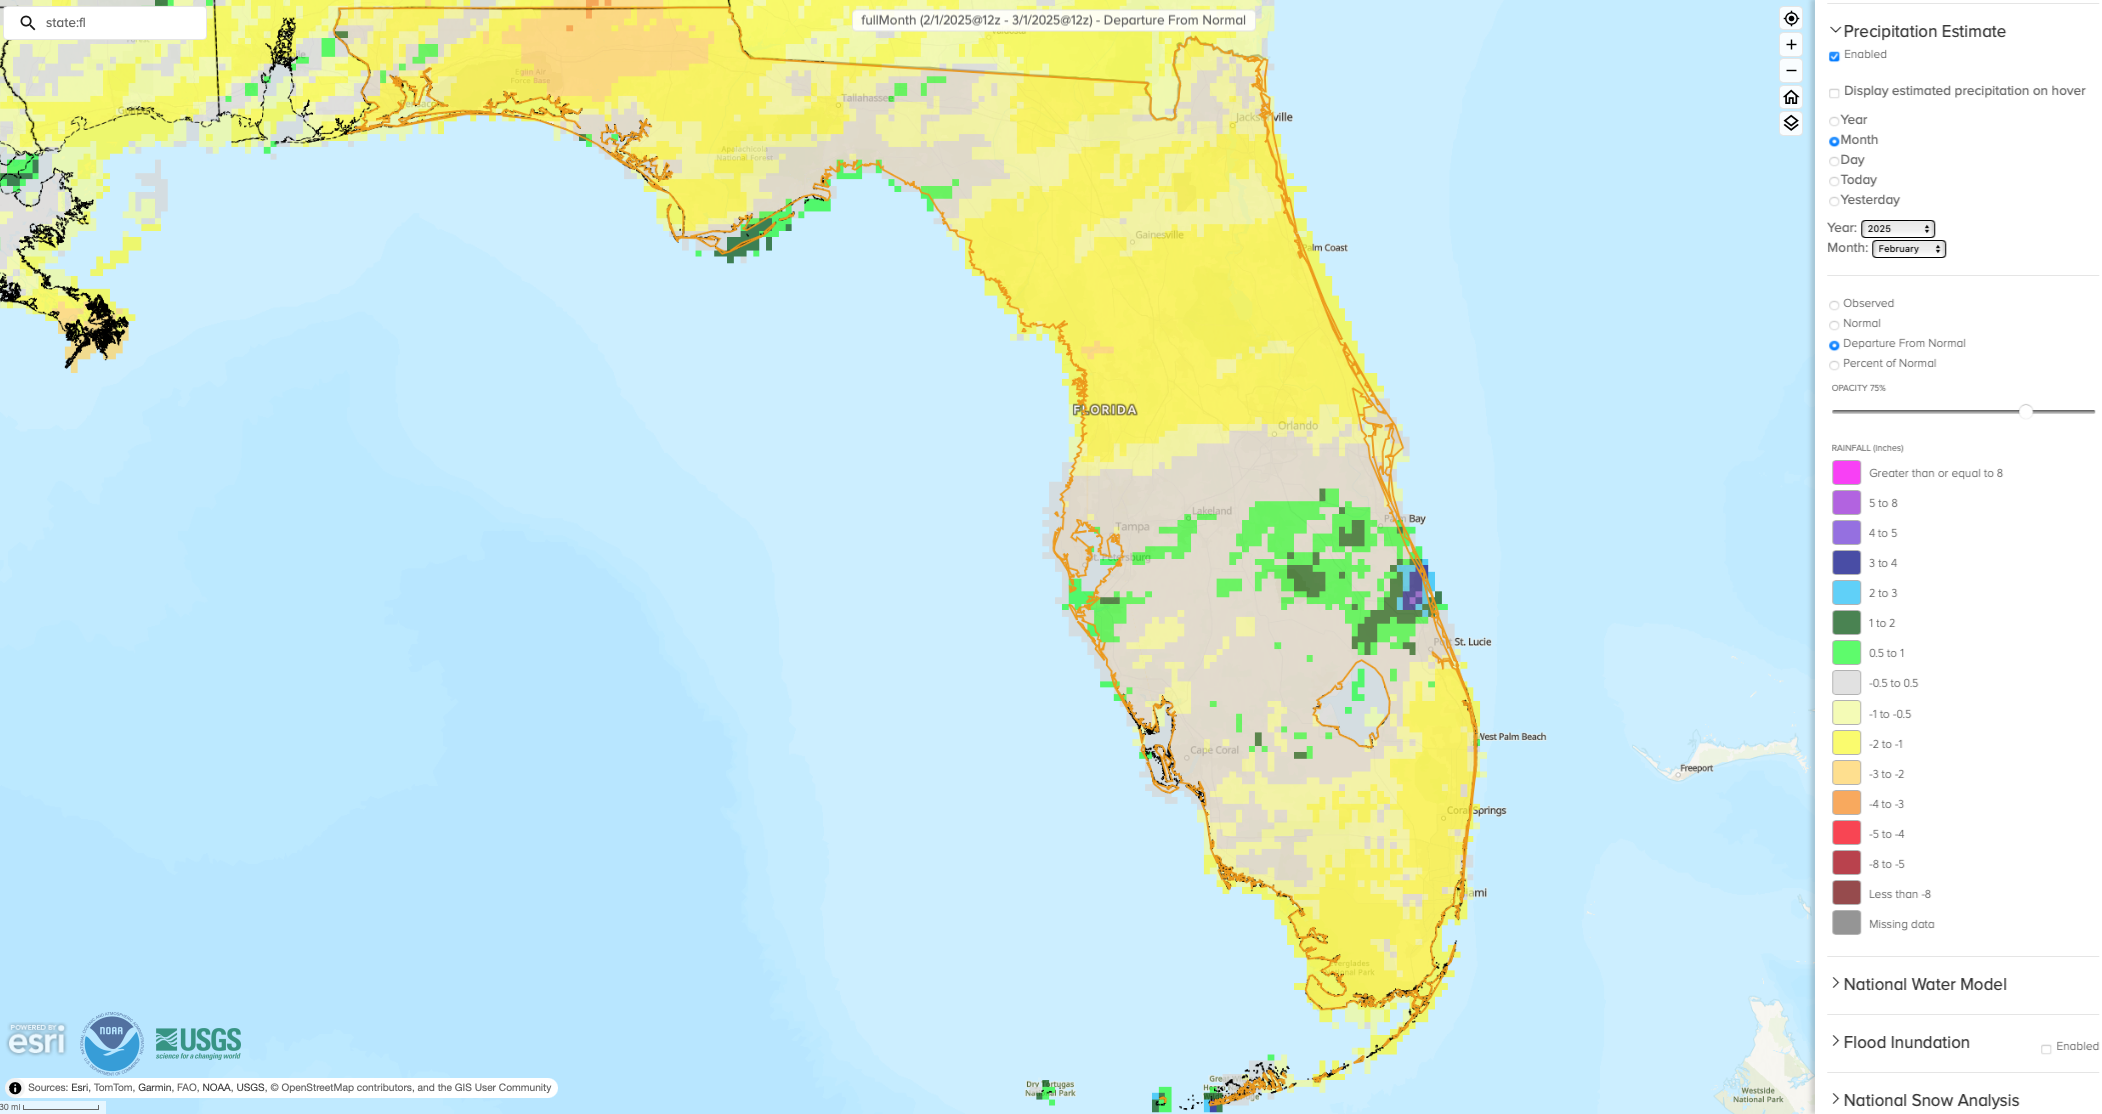
Monthly precipitation totals were generally below normal in February, with the exception of east-central coastal areas (St. Lucie and Indian River Counties) and the Keys. The monthly precipitation departures from normal ranged from -1.69 inches in Pensacola to +2.05 inches in Key West (see Table 2 and Appendix 1 for select locations). Warmer than average temperatures combined with below average rainfall during the winter led to drought expansion and the introduction of severe drought in parts of the Peninsula during February.
Table 2. February precipitation totals and departures from normal (inches) for selected cities.
| Station | Total Rainfall | Departure from Normal |
| Pensacola | 3.08 | -1.69 |
| Tallahassee | 3.02 | -1.26 |
| Jacksonville | 2.15 | -0.71 |
| Orlando | 1.29 | -0.91 |
| Tampa | 2.85 | -0.75 |
| Miami | 0.72 | -1.43 |
| Key West | 3.59 | +2.05 |
Figure 1. A graphical depiction of the monthly rainfall departure from normal (inches) for February (courtesy of NOAA, NWS).
La Niña Advisory.
La Niña conditions continued in the tropical equatorial Pacific Ocean. Sea surface temperatures (SSTs) across the central and east-central equatorial Pacific Ocean continued to be below average over the past month. La Niña conditions are expected to persist in the near-term and transition to ENSO-neutral during March-May 2025 (66% chance). A weak La Niña is favored through February-April. However, there is also a 41% chance of ENSO-neutral emerging in this season.
Hazardous Weather Events in February.
According to the Local Storm Reports issued by the local National Weather Service offices serving Florida, there were 111 individual local reports of hazardous weather events recorded across the state during the month of February (see Table 3 for a breakdown by event type). Strong wind gusts associated with thunderstorms affected areas across the northern half of the state mid-month, while a 650-acre wildfire broke out at the end of the month in northwestern Brevard County, which was fully contained per the Florida Forest Service.
Table 3. Breakdown of storm reports submitted in Florida during the month of February (compiled from Iowa State University/Iowa Environmental Mesonet).
| Report Type | Number of Reports |
| Heavy Rain | 1 |
| Flash Flood | 0 |
| Dense Fog | 1 |
| Marine Thunderstorm Wind | 15 |
| Non-Thunderstorm Wind Gust | 12 |
| Tornado/Waterspout/Funnel Cloud | 0 / 1 / 0 |
| Thunderstorm Wind Damage | 15 |
| Thunderstorm Wind Gust | 65 |
| Wildfire | 1 |
Daily Record Events in February.
Table 4. Summary of daily records broken or set in Florida in February (source: NCEI Daily Weather Records).
| Category | Number of Records |
| Highest daily max. temp. | 51 |
| Highest daily min. temp. | 47 |
| Lowest daily max. temp. | 11 |
| Lowest daily min. temp. | 1 |
| Highest daily precipitation | 14 |
| Total | 124 |
Drought-Related Impacts.
Drought expanded in the Peninsula during the month. In mid-February, about 6% of the state was in severe drought (D2), roughly 32% of the state was in moderate drought (D1), and 39% was abnormally dry (D0), according to the U.S. Drought Monitor. By the end of the month, approximately 4% of the state was in severe drought (D2), about 34% was in moderate drought (D1), and 26% of the state was abnormally dry (D0) (Figure 2 below).
As of February 28, the Lake Okeechobee water level was 13.77 ft. above sea level (Feet-NGVD29), which is below average for this time of year. At the first of the month, the water level was 14.38 ft. above sea level.
Figure 3. A graphical depiction of the latest drought conditions in Florida according to the U.S. Drought Monitor (courtesy of the National Drought Mitigation Center, University of Nebraska-Lincoln).
Agriculture-Related Impacts.
February brought a return to above normal temperatures and overall dry conditions. Chill hour accumulations are running above last year, but still below the historical average given the warmer weather that occurred in February. Drier weather allowed time for field preparations for spring planting. A dip in temperatures toward the end of the month resulted in losses to fruits and vegetables like strawberries in Okaloosa County. Producers prepared fields for rice planting and sugarcane harvest continued as planned throughout the month. Beekeepers prepared for the citrus bloom season. Pasture conditions were mostly fair and had improved near month’s end. Cattle conditions remained in mostly good condition. For more information, consult the Crop Progress State Stories, which is published by the USDA’s National Agricultural Statistics Service December through March.
Appendix 1
Additional February departures from normal data for select Florida locations (Source: NWS).
| Station | Average Temperature (˚F) | Departure from Normal (˚F) | Total Rainfall (in.) | Departure from Normal (in.) |
| Gainesville | 63.4 | +5.1 | 1.91 | -0.76 |
| Sarasota | 69.3 | +4.5 | 3.05 | +1.13 |
| Melbourne | 68.9 | +4.9 | 1.87 | -0.11 |
| Fort Myers | 72.1 | +4.8 | 1.69 | -0.09 |
| West Palm Beach | 72.8 | +4.4 | 1.69 | -0.94 |
Appendix 2
Select daily record low maximum temperatures (°F) tied or broken during February 2025 (compiled from NOAA).
| Location | Date | Record | Broken/Tied | Last |
| Fernandina Beach | 4 | 89 | Broken | 84 in 2014 |
| Plant City | 4 | 88 | Broken | 87 in 1907 |
| Crestview | 4 | 81 | Broken | 76 in 2012 |
| Tallahassee | 4 | 82 | Broken | 81 in 1957 |
| Plant City | 6 | 88 | Broken | 86 in 2020 |
| Crestview | 6 | 78 | Broken | 76 in 1994 |
| Pensacola | 6 | 78 | Broken | 76 in 1994 |
| Fort Lauderdale | 7 | 83 | Tied | 83 in 2022 |
| Ochopee | 7 | 87 | Broken | 86 in 2012 |
| Fort Myers | 7 | 86 | Tied | 86 in 1994 |
| Crestview | 9 | 84 | Broken | 81 in 1994 |
| Pensacola | 9 | 80 | Broken | 78 in 1957 |
| Tallahassee | 9 | 83 | Broken | 82 in 1957 |
| Chipley | 10 | 83 | Broken | 82 in 1994 |
| St. Augustine | 10 | 83 | Broken | 82 in 1994 |
| Quincy | 11 | 80 | Broken | 79 in 1999 |
| Plant City | 12 | 90 | Broken | 89 in 1905 |
| Mayport | 12 | 89 | Broken | 85 in 2019 |
| Gainesville | 12 | 86 | Tied | 86 in 2019 |
| Daytona Beach | 12 | 85 | Broken | 84 in 2021 |
| Jacksonville | 12 | 85 | Broken | 84 in 2020 |
| Hastings | 13 | 84 | Broken | 82 in 2021 |
| Ocala | 13 | 89 | Broken | 88 in 1959 |
| Plant City | 13 | 93 | Broken | 88 in 2020 |
| Gainesville | 13 | 89 | Broken | 85 in 2020 |
| Daytona Beach | 13 | 89 | Broken | 86 in 2020 |
| Lakeland | 13 | 90 | Broken | 88 in 2020 |
| Hastings | 14 | 88 | Broken | 78 in 2007 |
| Kissimmee | 14 | 89 | Broken | 87 in 2020 |
| Ochopee | 14 | 90 | Broken | 87 in 2018 |
| Tampa | 15 | 85 | Broken | 84 in 1990 |
| Gainesville | 15 | 86 | Broken | 84 in 2001 |
| Vero Beach | 16 | 85 | Broken | 84 in 2018 |
Prepared by Florida Climate Center
The Florida State University
Tallahassee, FL
Summary:
- Average monthly temperatures in January were well below normal in Florida.
- Monthly precipitation totals were generally below to near normal in January, except for parts of Northeast Florida which were above normal. On January 21-22, historic snowfall and a wintry mix of snow, sleet, and freezing rain affected the Panhandle and northern Florida.
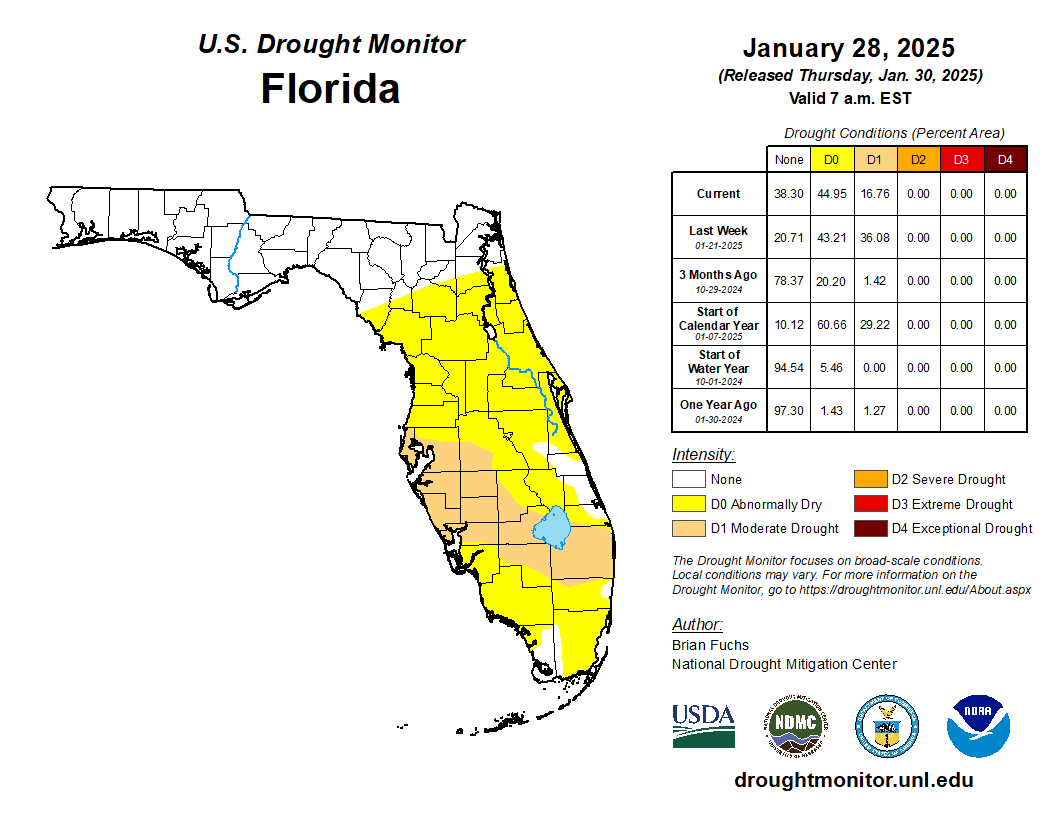
- By the end of January, approximately 17% of the state was in moderate drought (D1) and 45% was abnormally dry (D0), according to the U.S. Drought Monitor.
- La Niña conditions emerged in the tropical equatorial Pacific Ocean during December 2024 and are expected to persist through February-April (59% chance) before transitioning to ENSO-neutral likely during March-May 2025 (60% chance).
Average monthly temperatures in January were well below normal across Florida. Average monthly temperature departures from normal ranged from -6.1 ̊F in Gainesville to -1.9 ̊F in Miami for the month (see Table 1 and Appendix 1 for select cities). A cold Arctic outbreak affected much of the state during the week of January 20, stretching as far south as Naples in Southwest Florida. Southeast Florida missed out on the worst of the cold but also experienced below average temperatures. Gainesville tied for its coldest January on record, with a monthly average temperature of 48.7 ̊F, which ties with 2003. The lowest temperatures of the month arrived on January 22-23 in the western Panhandle, when the minimum temperature departures from normal were ranged from -24 ̊F to -31 ̊F below normal. Warming occurred during the last few days of the month, with mean temperatures rebounding to well above normal. Select daily low maximum temperature records tied or broken during the month are provided in Appendix 2.
Table 1. January average temperatures and departures from normal ( ̊F) for selected cities.
| Station | Mean Temperature | Departure from Normal |
| Pensacola | 47.7 | -5.5 |
| Tallahassee | 47.1 | -5.1 |
| Jacksonville | 48.4 | -5.8 |
| Orlando | 56.6 | -4.0 |
| Tampa | 57.3 | -4.7 |
| Miami | 66.7 | -1.9 |
| Key West | 68.3 | -2.3 |
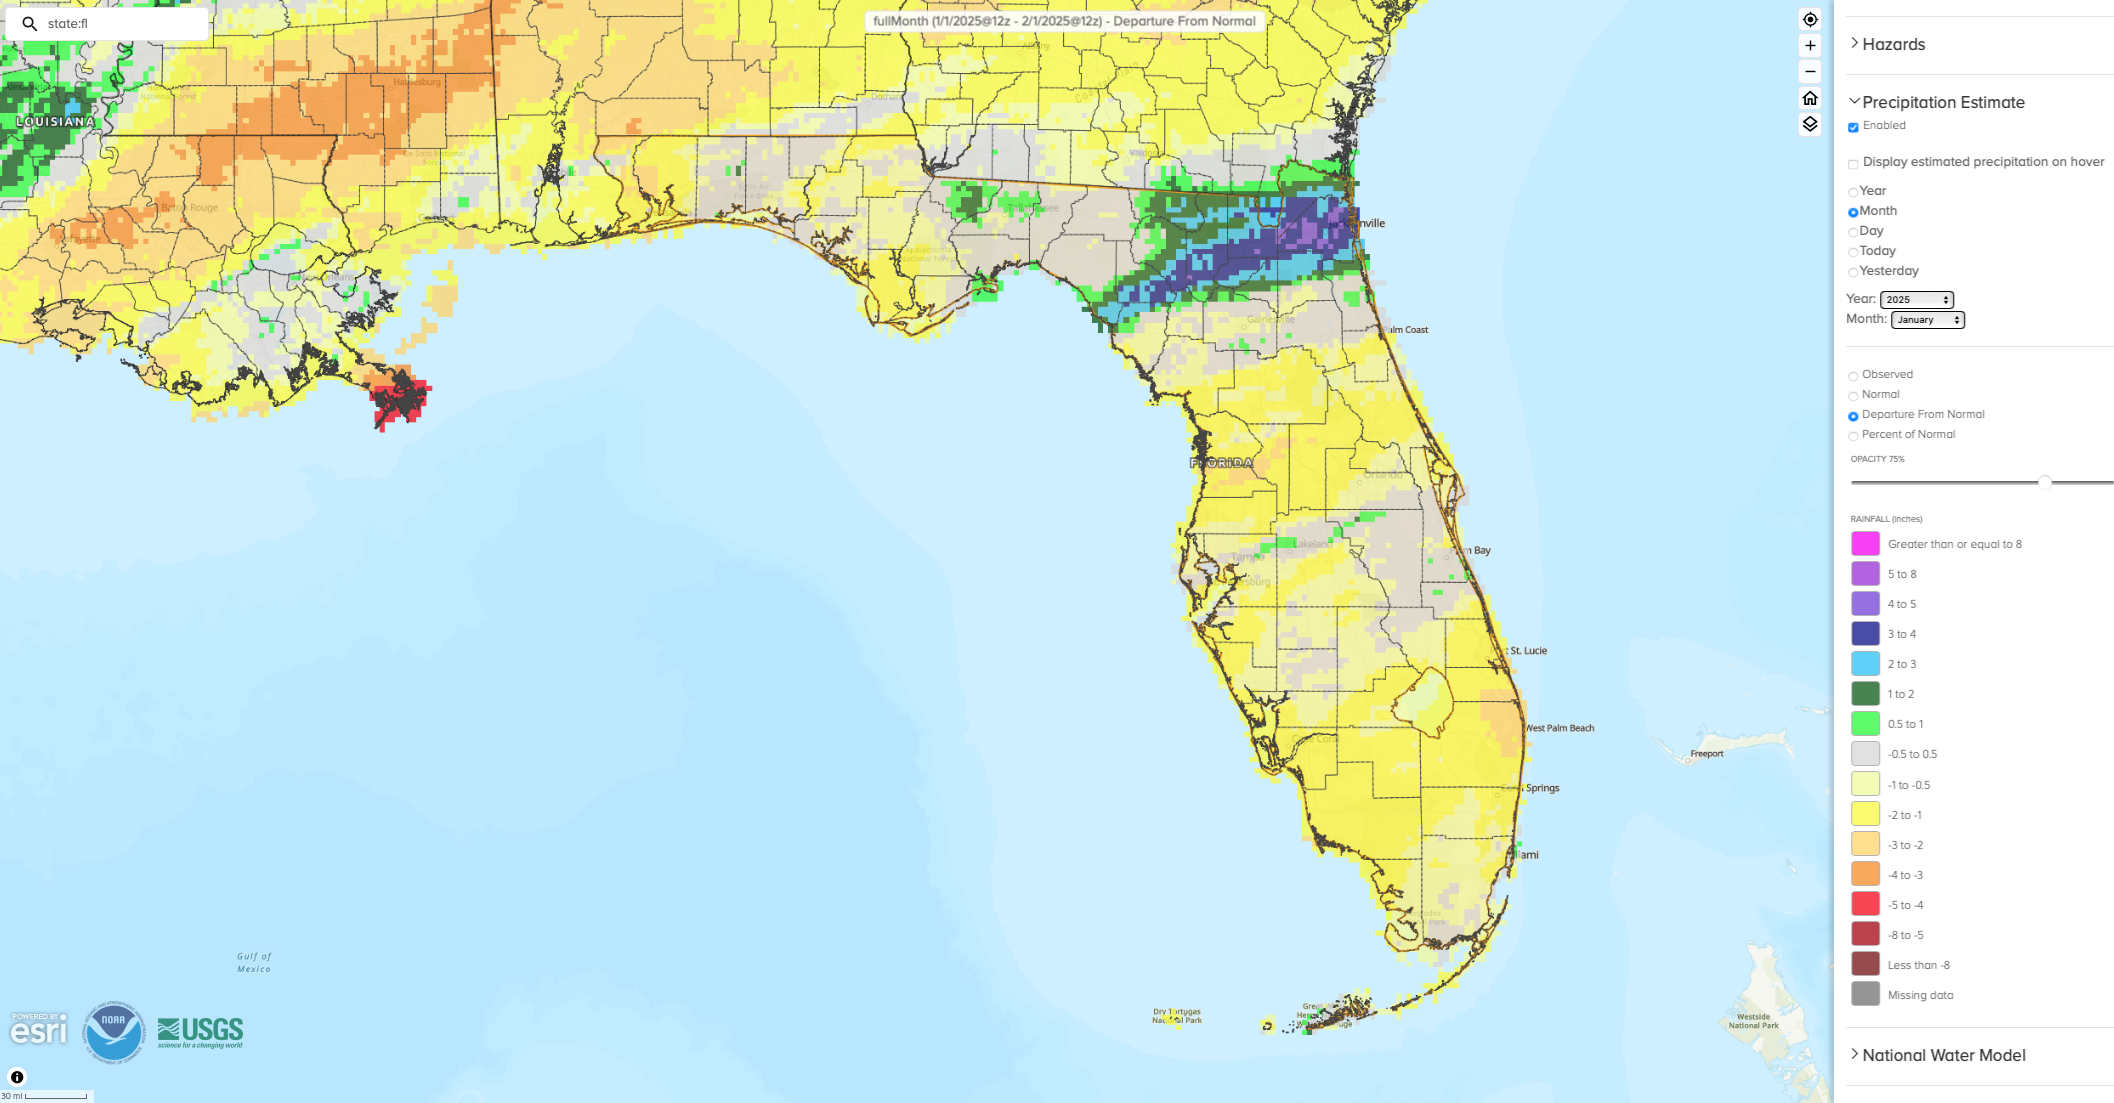
Monthly precipitation totals were generally below to near normal in January, except for parts of Northeast Florida which were above normal. The monthly precipitation departures from normal ranged from -0.94 inches in Miami to +3.32 inches in Jacksonville (see Table 2 and Appendix 1 for select locations). On January 21-22, a wintry mix of snow, sleet, and freezing rain fell across the Florida Panhandle and northern Florida with the highest accumulations of snowfall occurring in the western and northern parts of the Panhandle. The highest snowfall totals reported are between 9” and 10” mostly in the western Panhandle counties in and north of Pensacola. These totals rival the current state snowfall record of 4.0” in Milton, Fla. set on March 6, 1954. Locations further east around Tallahassee received a mix of sleet and snow, and places along the coast like Apalachicola saw freezing rain. Additional snowfall measurements observed during this event are provided in Appendix 3.
Table 2. January precipitation totals and departures from normal (inches) for selected cities.
| Station | Total Rainfall | Departure from Normal | Total Snowfall |
| Pensacola | 5.45 | +0.42 | 8.9 |
| Tallahassee | 4.49 | +0.08 | 1.9 |
| Jacksonville | 6.60 | +3.32 | 0.1 |
| Orlando | 1.57 | -0.91 | NA |
| Tampa | 3.17 | +0.52 | NA |
| Miami | 0.89 | -0.94 | NA |
| Key West | 1.79 | -0.04 | NA |
Figure 1. A graphical depiction of the monthly rainfall departure from normal (inches) for January (courtesy of NOAA, NWS).
La Niña Advisory.
La Niña conditions emerged in December 2024 in the tropical equatorial Pacific Ocean. La Niña conditions are expected to persist through February-April 2025 (59% chance) and transition to ENSO-neutral during March-May 2025 (60% chance). Since this La Niña developed relatively late in the season, temperatures in our region have been driven more by other weather and climate patterns, including a series of cold fronts and a strong polar vortex that led to well below normal temperatures in January. While this La Niña is expected to be a weak event, it can still exert its influence on our weather and climate over the next few months, which typically call for warmer and drier conditions during winter in Florida.
Hazardous Weather Events in January.
According to the Local Storm Reports issued by the local National Weather Service offices serving Florida, there were 240 individual local reports of hazardous weather events recorded across the state during the month of January (see Table 3 for a breakdown by event type). Many local storm reports of snow and wintry precipitation were submitted during the historic snowstorm. One injury was reported in Nassau County on the 22nd due to a car accident on I-95 due to icy road conditions. The historic snowstorm shut down portions of I-10 in the Panhandle and closed schools across the region for several days as thawing of snow and ice occurred slowly as the cold temperatures lingered.
Table 3. Breakdown of storm reports submitted in Florida during the month of January (compiled from Iowa State University/Iowa Environmental Mesonet).
| Report Type | Number of Reports |
| Heavy Rain | 22 |
| Hail | 3 |
| Marine Thunderstorm Wind | 4 |
| Non-Thunderstorm Wind Gust | 18 |
| Non-Thunderstorm Wind Damage | 0 |
| Tornado/Waterspout/Funnel Cloud | 0/0/0 |
| Thunderstorm Wind Damage | 8 |
| Thunderstorm Wind Gust | 23 |
| Snow | 154 |
| Sleet | 6 |
| Freezing Rain | 2 |
Daily Record Events in January.
Table 4. Summary of daily records broken or set in Florida in January (source: NCEI Daily Weather Records).
| Category | Number of Records |
| Highest daily max. temp. | 1 |
| Highest daily min. temp. | 1 |
| Lowest daily max. temp. | 58 |
| Lowest daily min. temp. | 14 |
| Highest daily precipitation | 16 |
| Total | 90 |
Drought-Related Impacts.
Drought improved in the Panhandle but moderate drought affected parts of the Peninsula during the month. In mid-January, about 26% of the state was in moderate drought (D1) and roughly 56% of the state was abnormally dry (D0), according to the U.S. Drought Monitor. By the end of the month, moderate drought (D1) affected about 17% of the state and 45% of the state remained abnormally dry (D0) (Figure 2 below).
As of January 31, the Lake Okeechobee water level was 14.41 ft. above sea level (Feet-NGVD29), which is below average for this time of year. At the first of the month, the water level was 15.12 ft. above sea level.
Figure 3. A graphical depiction of the latest drought conditions in Florida according to the U.S. Drought Monitor (courtesy of the National Drought Mitigation Center, University of Nebraska-Lincoln).
Agriculture-Related Impacts.
The cold temperatures and wintry precipitation in January led to problems with some crops. Snow delayed field work for some producers, and numerous reports of crop damage were made, such as for strawberries, leafy greens, citrus, and others. Snow and ice damaged some trees and blueberry bushes in northern Florida. Pasture conditions were mostly fair but did decline with the freezing temperatures and snow. As temperatures warmed near the end of the month, pasture conditions began to improve. Cattle conditions were mostly good throughout the month. Sugarcane planting and harvest progressed well, and producers have started to prepare for rice planting. For more information, consult the Crop Progress State Stories, which is published by the USDA’s National Agricultural Statistics Service December through March.
Appendix 1
Additional January departures from normal data for select Florida locations (Source: NWS).
| Station | Average Temperature (˚F) | Departure from Normal (˚F) | Total Rainfall (in.) | Departure from Normal (in.) |
| Gainesville | 48.7 | -6.1 | 2.50 | -0.79 |
| Sarasota | 59.1 | -3.3 | 1.08 | -1.71 |
| Melbourne | 57.4 | -4.3 | 1.59 | -1.04 |
| Fort Myers | 61.5 | -3.2 | 0.52 | -1.89 |
| West Palm Beach | 64.3 | -2.0 | 0.94 | -2.53 |
Appendix 2
Select daily record low maximum temperatures (°F) tied or broken during January 2025 (compiled from NOAA).
| Location | Date | Record | Broken/Tied | Last |
| Fort Lauderdale | 8 | 59 | Broken | 63 in 2006 |
| Lake City | 21 | 42 | Broken | 43 in 1984 |
| Marianna | 21 | 38 | Broken | 45 in 2024 |
| Apalachicola | 22 | 38 | Broken | 43 in 1940 |
| Bradenton | 22 | 46 | Broken | 52 in 1984 |
| Ocala | 22 | 42 | Broken | 50 in 1985 |
| Tampa | 22 | 46 | Tied | 46 in 1985 |
| Pensacola | 22 | 37 | Broken | 45 in 1966 |
| Orlando | 22 | 47 | Broken | 48 in 1985 |
| Gainesville | 22 | 38 | Broken | 46 in 2022 |
| Tampa | 22 | 46 | Broken | 49 in 1985 |
| Crestview | 22 | 37 | Broken | 50 in 2014 |
| Jacksonville | 22 | 34 | Broken | 41 in 2022 |
| Tallahassee | 22 | 42 | Broken | 44 in 2022 |
| Bradenton | 23 | 47 | Broken | 49 in 1985 |
| Clermont | 23 | 44 | Broken | 50 in 1960 |
| Daytona Beach | 23 | 50 | Broken | 55 in 1961 |
| Deland | 23 | 44 | Broken | 53 in 2014 |
| Hastings | 23 | 40 | Broken | 46 in 2022 |
| Hialeah | 23 | 59 | Broken | 61 in 1960 |
| Kissimmee | 23 | 46 | Broken | 54 in 1960 |
| Niceville | 23 | 38 | Broken | 46 in 1966 |
| Orlando | 23 | 49 | Broken | 50 in 1960 |
| Tampa | 23 | 49 | Broken | 52 in 1960 |
| Clermont | 24 | 46 | Broken | 50 in 2016 |
Appendix 3
Select preliminary snowfall totals, in inches, from 7:00 am EST January 21 through 9:00 am EST January 22, compiled from the Weather Prediction Center and National Weather Service offices.
| Station | Total Snowfall (in) |
| 1 NE Ferry Pass. | 10.0 |
| Milton | 9.8 |
| Pace | 9.0 |
| Pensacola Intl AP | 8.9 |
| Bellview 1 W | 8.0 |
| Pensacola Beach | 7.5 |
| Crestview | 9.0 |
| Bonifay | 6.0 |
| Defuniak Springs | 4.75 |
Prepared by Florida Climate Center
The Florida State University
Tallahassee, FL
Summary:
- Average monthly temperatures in March were near to above normal in Florida.
- Monthly precipitation totals in March were generally below normal in the Peninsula and above normal across northern Florida and the Keys.
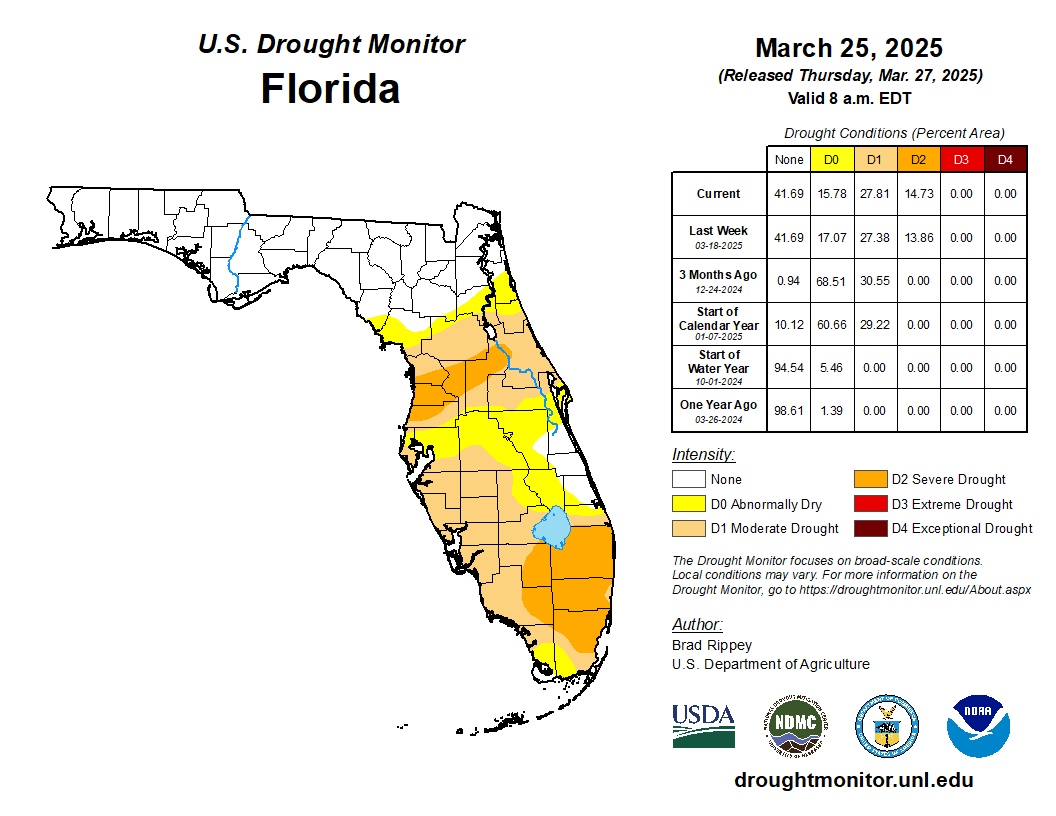
- By the end of March, approximately 15% of the state was in severe drought (D2), 28% was in moderate drought (D1), and 16% of the state was abnormally dry (D0), according to the U.S. Drought Monitor.
- ENSO-neutral conditions are favored to develop in the next month and persist through the Northern Hemisphere summer with a 62% chance in June-August 2025.
Average monthly temperatures in March were near to above normal in Florida. Average monthly temperature departures from normal ranged from -0.5 ̊F in Key West to +1.3 ̊F in Gainesville for the month (see Table 1 and Appendix 1 for select cities). Summer-like temperatures approaching or reaching 90 ̊F arrived this month, with well above normal mean temperatures by the end of the month. There were no reports of frost in March across most of the state, except for isolated locations in the western Panhandle, and a frost is unlikely after March 31st climatologically. No monthly temperature records were set this month. Select daily high maximum temperature records tied or broken during the month are provided in Appendix 2.
Table 1. March average temperatures and departures from normal ( ̊F) for selected cities.
| Station | Mean Temperature | Departure from Normal |
| Pensacola | 63.0 | +0.7 |
| Tallahassee | 62.5 | +1.1 |
| Jacksonville | 63.0 | +0.6 |
| Orlando | 68.5 | +1.2 |
| Tampa | 69.7 | +1.1 |
| Miami | 73.0 | -0.1 |
| Key West | 73.9 | -0.5 |
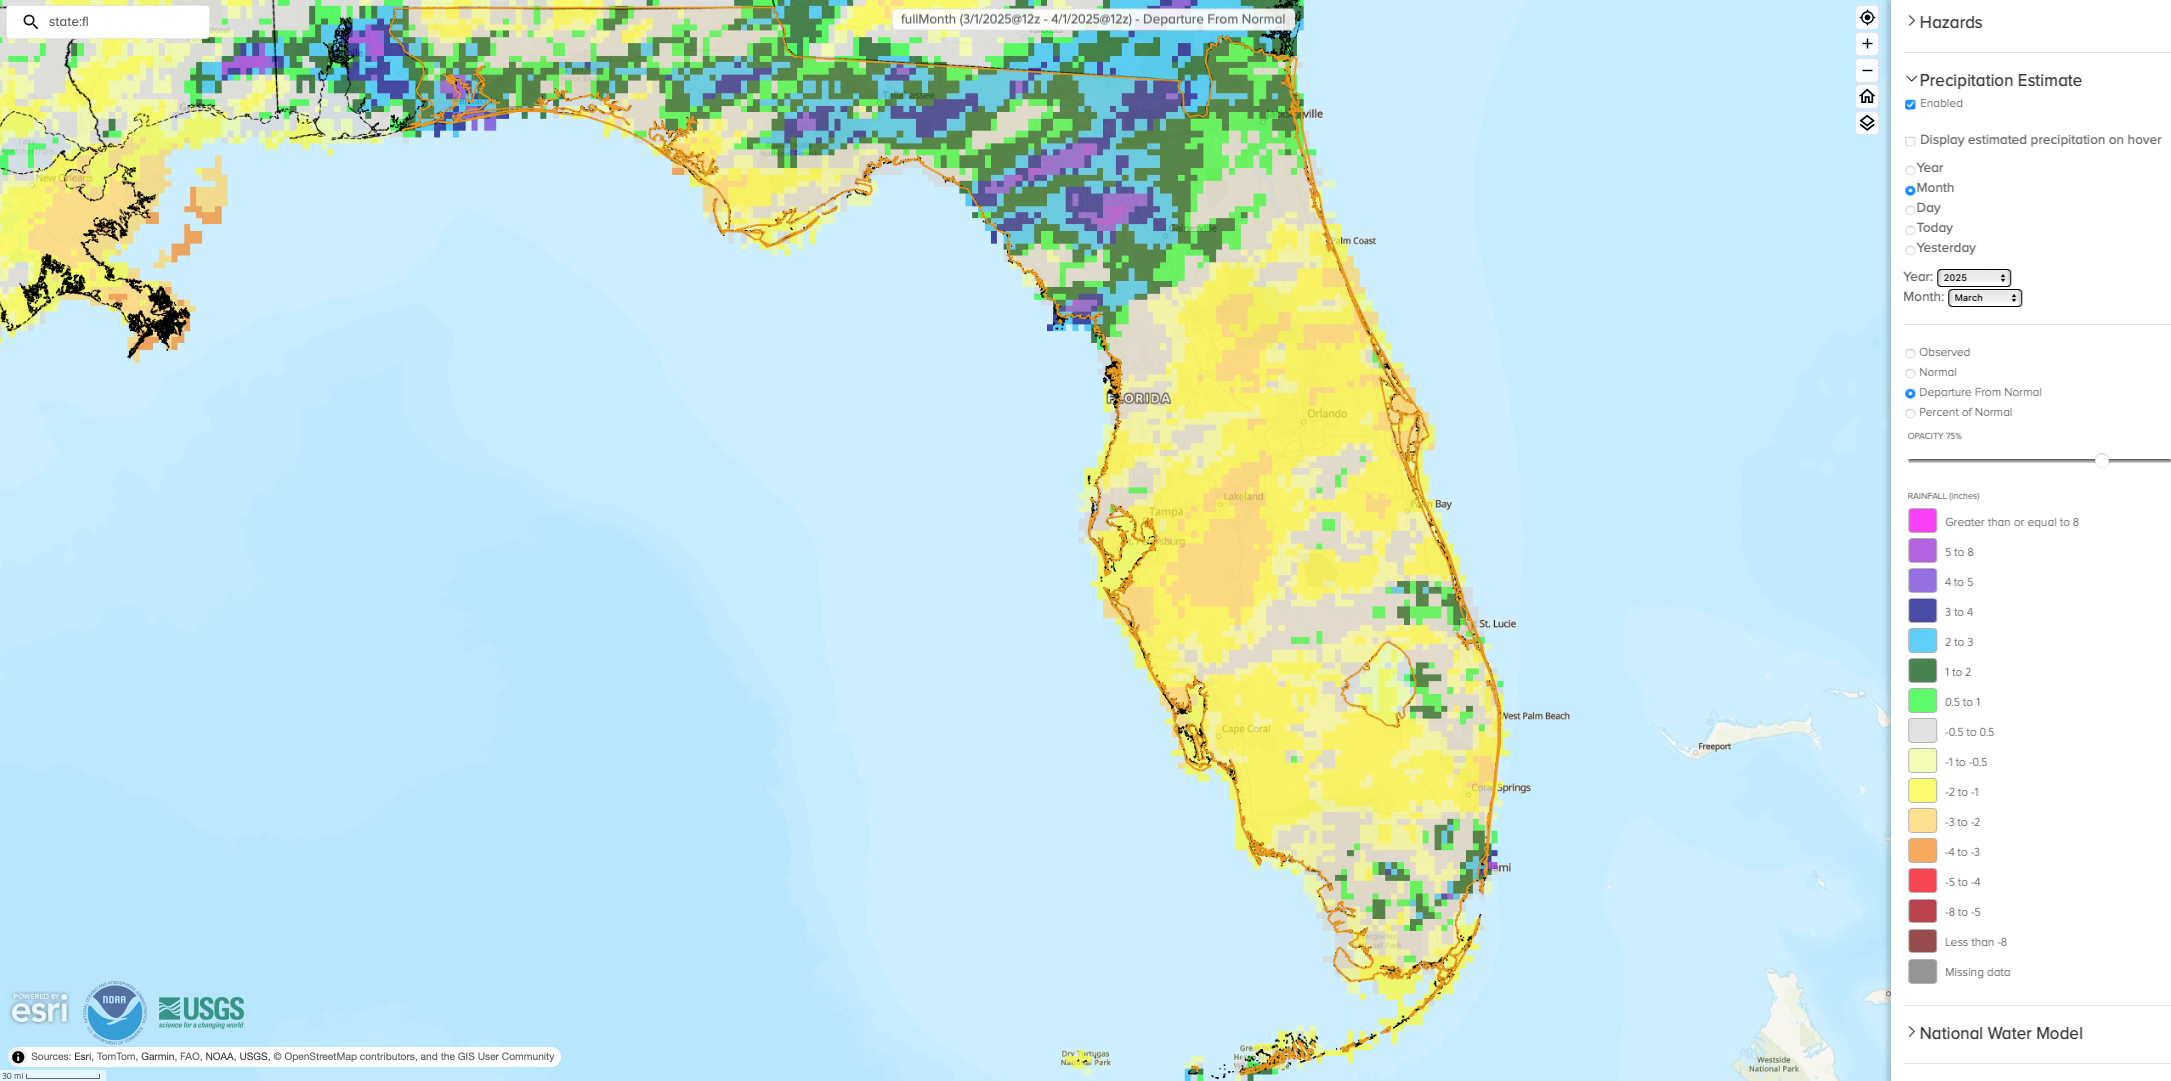
Monthly precipitation totals in March were generally below normal in the Peninsula and above normal across northern Florida and the Keys. The monthly precipitation departures from normal ranged from -2.27 inches in Sarasota to +4.41 inches in Pensacola (see Table 2 and Appendix 1 for select locations). This past winter saw drier than average conditions in the Panhandle with drying conditions developing in the Peninsula in late winter and early spring, indicative of the current La Niña. During March, Southeast Florida was drier than average with the expansion of severe drought (D2). Many stations in Southeast Florida are experiencing one of their top 10 driest periods since the start of the year, including Miami, Fort Lauderdale, and Naples. Heavy rainfall also impacted much of the state during the month. Key West set a new daily rainfall record with 3.73” on March 29. Pensacola recorded a 1-hour rainfall total of 4.19” on March 30, which was their 2nd-highest hourly rainfall total on record; the daily total of 6.09” set a new daily record for that day and represents 63% of the month's total rainfall. Select daily record precipitation totals tied or broken during the month are provided below in Appendix 3.
Table 2. March precipitation totals and departures from normal (inches) for selected cities.
| Station | Total Rainfall | Departure from Normal |
| Pensacola | 9.66 | +4.41 |
| Tallahassee | 6.26 | +1.02 |
| Jacksonville | 4.80 | +1.51 |
| Orlando | 0.79 | -2.24 |
| Tampa | 0.98 | -1.54 |
| Miami | 1.59 | -0.87 |
| Key West | 3.79 | +2.26 |
Figure 1. A graphical depiction of the monthly rainfall departure from normal (inches) for March (courtesy of NOAA, NWS).
La Niña Advisory.
La Niña conditions continued in the tropical equatorial Pacific Ocean over the past month; however, below-average sea surface temperatures (SSTs) weakened in the central and east-central equatorial Pacific Ocean. Near-to-below average SST values lingered in the Niño-3.4 and Niño-4 regions. ENSO-neutral conditions are favored to develop in the next month and persist through the Northern Hemisphere summer (62% chance in June-August 2025).
Hazardous Weather Events in March.
According to the Local Storm Reports issued by the local National Weather Service offices serving Florida, there were 328 individual local reports of hazardous weather events recorded across the state during the month of March (see Table 3 for a breakdown by event type). Wildfires affected the state during the month. The “344 Fire” in southern Miami-Dade County burned over 26,000 acres and was partially contained as of March 25 and is now fully contained. The wildfire closed roadways and damaged power lines and several communication towers in southeastern portions of the county. Wildfires have led to poor air quality throughout Florida, including from both wild and prescribed burns. Severe weather impacted the state this month. Thunderstorms with reports of hail and heavy rainfall occurred throughout the month. One EF-1 tornado was confirmed in northern Florida (Columbia Co.) during a larger tornado outbreak in the Southeast U.S. from March 14-17 which spawned around 110 confirmed tornadoes regionwide. Several other small tornadoes were reported during the month. No injuries or fatalities were reported in Florida.
Table 3. Breakdown of storm reports submitted in Florida during the month of March (compiled from Iowa State University/Iowa Environmental Mesonet).
| Report Type | Number of Reports |
| Heavy Rain | 74 |
| Flash Flood | 4 |
| Flood | 3 |
| Hail | 18 |
| Marine Thunderstorm Wind | 28 |
| Non-Thunderstorm Wind Gust | 82 |
| Tornado/Waterspout/Funnel Cloud | 4 / 5 / 3 |
| Thunderstorm Wind Damage | 37 |
| Non-Thunderstorm Wind Damage | 1 |
| Thunderstorm Wind Gust | 61 |
| Wildfire | 8 |
Daily Record Events in March.
Table 4. Summary of daily records broken or set in Florida in March (source: NCEI Daily Weather Records).
| Category | Number of Records |
| Highest daily max. temp. | 9 |
| Highest daily min. temp. | 20 |
| Lowest daily max. temp. | 1 |
| Lowest daily min. temp. | 5 |
| Highest daily precipitation | 17 |
| Total | 52 |
Drought-Related Impacts.
Drought persisted in much of the Peninsula during the month. In mid-March, roughly 14% of the state was in severe drought (D2), 27% of the state was in moderate drought (D1), and 17% was abnormally dry (D0), according to the U.S. Drought Monitor. By the end of the month, approximately 15% of the state was in severe drought (D2), 28% was in moderate drought (D1), and 16% of the state was abnormally dry (D0) (Figure 2 below).
As of March 31, the Lake Okeechobee water level was 12.55 ft. above sea level (Feet-NGVD29), which is below average for this time of year. At the first of the month, the water level was 13.74 ft. above sea level.
Figure 3. A graphical depiction of the latest drought conditions in Florida according to the U.S. Drought Monitor (courtesy of the National Drought Mitigation Center, University of Nebraska-Lincoln).
Agriculture-Related Impacts.
The warm temperatures and variable rain showers improved cover crops and winter grazing, while spring planting began for crops like corn, melons, and vegetables. Other producers made preparations for planting in April. Near the end of the month, some prepared land for peanuts and cotton. Sugarcane harvest continued through March and rice planting progressed. Pasture conditions improved with warm temperatures and more frequent rainfall. Cattle conditions were mostly good. For more information, consult the Crop Progress State Stories, which is published by the USDA’s National Agricultural Statistics Service December through March.
Appendix 1
Additional March departures from normal data for select Florida locations (Source: NWS).
| Station | Average Temperature (˚F) | Departure from Normal (˚F) | Total Rainfall (in.) | Departure from Normal (in.) |
| Gainesville | 64.0 | +1.3 | 5.76 | +2.27 |
| Sarasota | 68.7 | +0.6 | 0.58 | -2.27 |
| Melbourne | 68.0 | +0.6 | 1.56 | -1.13 |
| Fort Myers | 70.7 | +0.4 | 0.61 | -1.46 |
| West Palm Beach | 71.6 | +0.5 | 1.49 | -1.82 |
Appendix 2
Select daily record high maximum temperatures (°F) tied or broken during March 2025 (compiled from NOAA).
| Location | Date | Record (˚F) | Broken/Tied | Last |
| Miami | 10 | 89 | Tied | 89 in 1964 |
| Fort Lauderdale | 11 | 90 | Broken | 87 in 2024 |
| Tampa Bay | 15 | 90 | Broken | 88 in 2012 |
| Apalachicola | 26 | 85 | Broken | 82 in 2012 |
| Homestead | 26 | 90 | Broken | 89 in 2016 |
| Pensacola | 26 | 81 | Broken | 80 in 2023 |
| Key West | 27 | 87 | Broken | 86 in 2020 |
| Bradenton | 30 | 89 | Tied | 89 in 2020 |
| Kissimmee | 31 | 90 | Broken | 89 in 2021 |
| Tampa Bay | 31 | 88 | Broken | 87 in 2023 |
| Lakeland | 31 | 91 | Tied | 91 in 2021 |
Appendix 3.
Select daily record precipitation totals (in inches) tied or broken during March 2025 (compiled from NOAA).
| Location | Date | Record (in) | Broken/Tied | Last |
| Niceville | 9 | 1.70 | Broken | 1.60 in 1976 |
| Tallahassee | 9 | 4.25 | Broken | 2.75 in 1948 |
| Fernandina Beach | 10 | 2.00 | Broken | 1.42 in 1909 |
| Jacksonville Beach | 10 | 2.49 | Broken | 2.05 in 1980 |
| Quincy | 10 | 3.80 | Broken | 1.91 in 2011 |
| Key West | 29 | 3.73 | Broken | 0.37 in 1966 |
| Pensacola | 30 | 6.09 | Broken | 3.50 in 1996 |
| Fort Lauderdale | 31 | 2.30 | Broken | 1.98 in 2016 |
| Hialeah | 31 | 2.30 | Broken | 0.94 in 1958 |
| Usher Tower | 31 | 4.10 | Broken | 2.87 in 1972 |
| Miami Beach | 31 | 7.25 | Broken | 1.42 in 1994 |
Prepared by Florida Climate Center
The Florida State University
Tallahassee, FL
Summary:
- Average monthly temperatures in May were above normal across Florida.
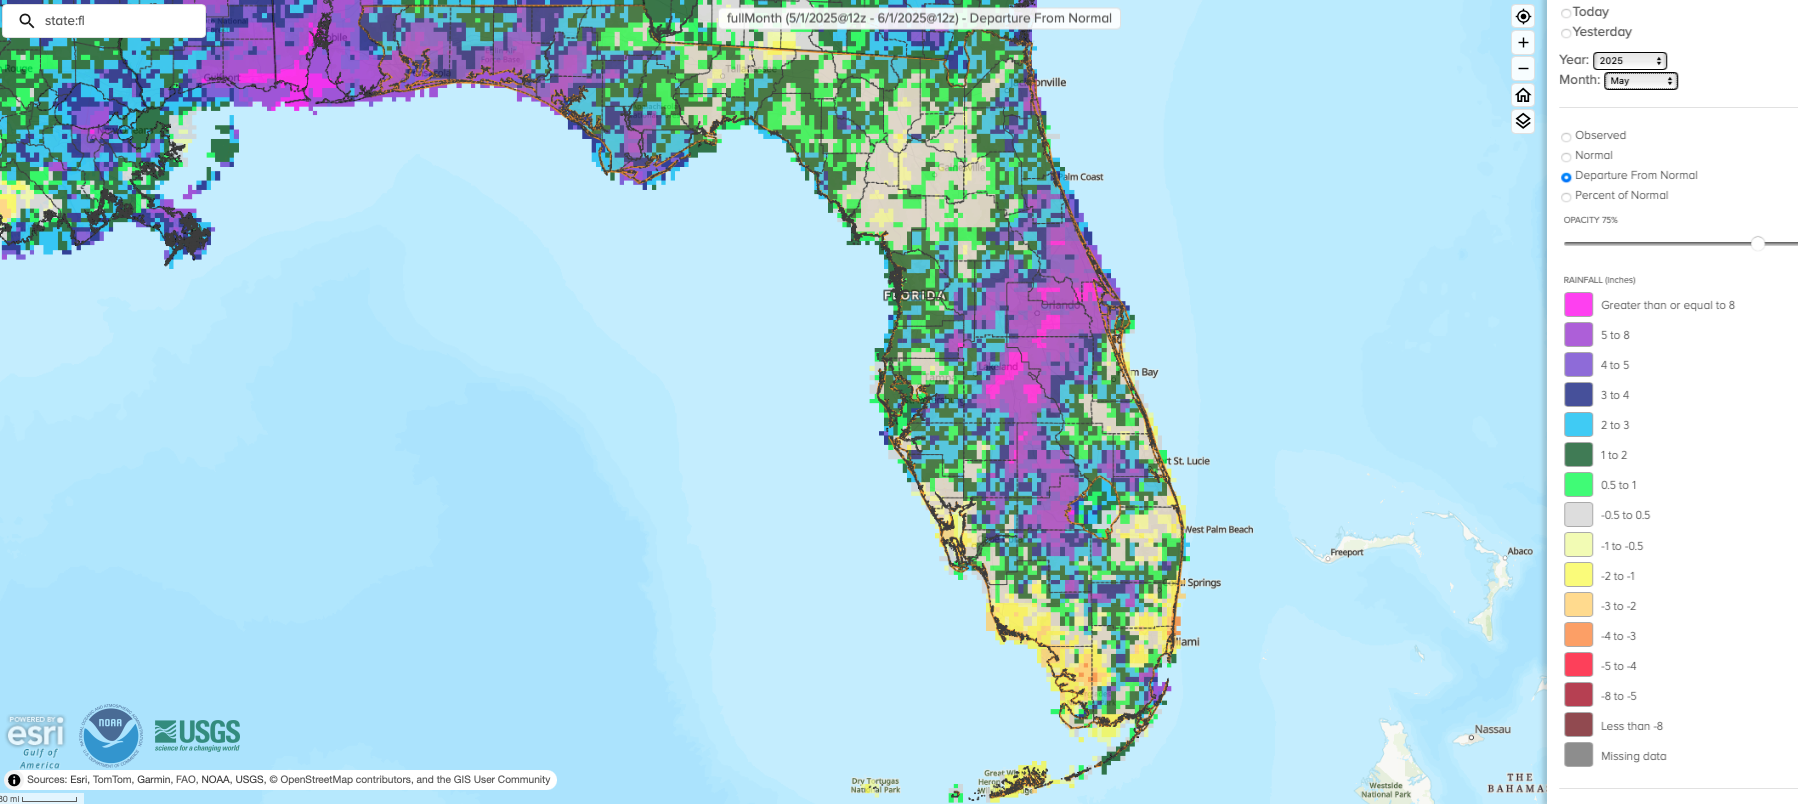
- Monthly precipitation totals in May were generally above normal except in parts of South Florida.
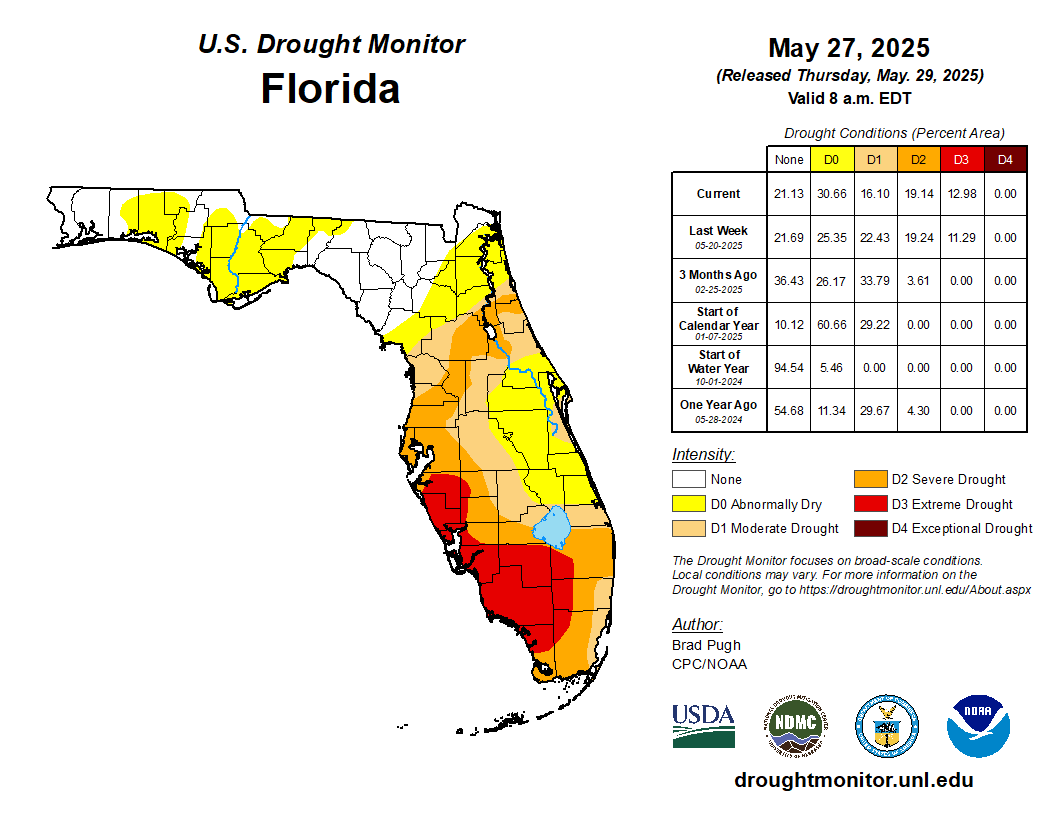
- By the end of May, drought conditions had improved across much of the state but extreme drought (D3) expanded in southwest Florida, according to the U.S. Drought Monitor.
- ENSO-neutral conditions continued in the tropical Pacific Ocean and are expected to persist through the Northern Hemisphere summer (74% chance during June-August 2025).
Table 1. May average temperatures and departures from normal ( ̊F) for selected cities.
| Station | Mean Temperature | Departure from Normal |
| Pensacola | 76.3 | +0.3 |
| Tallahassee | 78.3 | +3.1 |
| Jacksonville | 78.6 | +3.7 |
| Orlando | 80.6 | +3.3 |
| Tampa | 82.6 | +3.1 |
| Miami | 82.4 | +2.3 |
| Key West | 82.9 | +1.8 |
Table 2. May precipitation totals and departures from normal (inches) for selected cities.
| Station | Total Rainfall | Departure from Normal |
| Pensacola | 6.99 | +3.09 |
| Tallahassee | 3.43 | +0.07 |
| Jacksonville | 3.34 | -0.08 |
| Orlando | 13.18 | +9.16 |
| Tampa | 4.18 | +1.58 |
| Miami | 7.98 | +1.66 |
| Key West | 1.40 | -1.72 |
Figure 1. A graphical depiction of the monthly rainfall departure from normal (inches) for May (courtesy of NOAA, NWS).
ENSO-Neutral Conditions Present in Pacific.
ENSO-neutral conditions are currently present in the tropical equatorial Pacific Ocean. Over the past month, near-average sea surface temperatures covered most of the equatorial Pacific Ocean, and all the weekly Niño index values were near zero. ENSO-neutral conditions are favored to persist through the Northern Hemisphere summer (74% chance during June-August 2025). There is a greater than 50% chance of ENSO-neutral extending through October 2025.
Hazardous Weather Events in May.
According to the Local Storm Reports issued by the local National Weather Service offices serving Florida, there were 382 individual local reports of hazardous weather events recorded across the state during the month of May (see Table 3 for a breakdown by event type). Severe thunderstorm activity ramped up during the month, with reports of hail up to golf ball size, damaging winds, heavy rain, and several reports of tornadoes. Rip currents led to two fatalities during the month, and another fatality occurred due to a snapped tree during a thunderstorm in Ocala on the 29th. Wildfires during the month led to road closures and one fire resulted in mandatory evacuations in Marion County during the early part of the month, though the wildfire was quickly contained.
Table 3. Breakdown of storm reports submitted in Florida during the month of May (compiled from Iowa State University/Iowa Environmental Mesonet).
| Report Type | Number of Reports |
| Heavy Rain | 28 |
| Flash Flood | 4 |
| Flood | 2 |
| Hail | 92 |
| Marine Thunderstorm Wind | 43 |
| Non-Thunderstorm Wind Gust | 0 |
| Tornado/Waterspout/Funnel Cloud | 11 / 15 / 16 |
| Thunderstorm Wind Damage | 47 |
| Non-Thunderstorm Wind Damage | 0 |
| Thunderstorm Wind Gust | 108 |
| Wildfire | 8 |
| Rip Currents | 3 |
Daily Record Events in May.
Table 4. Summary of daily records broken or set in Florida in May (source: NCEI Daily Weather Records).
| Category | Number of Records |
| Highest daily max. temp. | 67 |
| Highest daily min. temp. | 79 |
| Lowest daily max. temp. | 1 |
| Lowest daily min. temp. | 0 |
| Highest daily precipitation | 46 |
| Total | 193 |
Drought-Related Impacts.
Drought conditions improved in Florida during May, but extreme drought expanded in southwest Florida which missed out on heavy rainfall during the month. In mid-May, roughly 9% of the state was in extreme drought (D3), 21% was in severe drought (D2), 21% of the state was in moderate drought (D1), and 36% was abnormally dry (D0), according to the U.S. Drought Monitor. By the end of the month, approximately 13% of the state was in extreme drought (D3), 19% was in severe drought (D2), 16% was in moderate drought (D1), and 31% of the state was abnormally dry (D0) (Figure 2 below).
As of May 31, the Lake Okeechobee water level was 10.95 ft. above sea level (Feet-NGVD29), which is below average for this time of year. At the first of the month, the water level was 11.22 ft. above sea level.
Figure 3. A graphical depiction of the latest drought conditions in Florida according to the U.S. Drought Monitor (courtesy of the National Drought Mitigation Center, University of Nebraska-Lincoln).
Agriculture-Related Impacts.
In mid-May, topsoil moisture conditions were adequate in 59% of the state, short in 31%, and very short in 9% of the state, while 1% of the state had surplus topsoil moisture conditions. By the end of May, topsoil moisture conditions were adequate in 50% of the state, short in 33%, and very short in 10% of the state; while 7% of the state had surplus topsoil moisture conditions. For more information, consult the Crop Progress and Conditions report, which is published by the USDA’s National Agricultural Statistics Service.
Appendix 1
Additional May departures from normal data for select Florida locations (Source: NWS).
| Station | Average Temperature (˚F) | Departure from Normal (˚F) | Total Rainfall (in.) | Departure from Normal (in.) |
| Gainesville | 78.4 | +3.4 | 2.86 | -0.22 |
| Sarasota | 80.1 | +2.3 | 2.80 | +0.22 |
| Melbourne | 79.9 | +3.1 | 4.43 | +0.90 |
| Fort Myers | 82.0 | +2.7 | 3.69 | +0.23 |
| West Palm Beach | 82.2 | +3.5 | 4.28 | -0.63 |
Appendix 2
Select daily record high maximum temperatures (°F) tied or broken during May 2025 (compiled from NOAA).
| Location | Date | Record (˚F) | Broken/Tied | Last |
| Bradenton | 6 | 92 | Broken | 91 in 2024 |
| Key West | 6 | 92 | Broken | 91 in 2024 |
| Jacksonville Beach | 16 | 96 | Broken | 92 in 1961 |
| Orlando | 16 | 96 | Broken | 94 in 1995 |
| Daytona Beach | 16 | 96 | Broken | 94 in 1994 |
| Jacksonville | 16 | 97 | Broken | 96 in 1995 |
| Tallahassee | 16 | 98 | Broken | 95 in 1962 |
| Clermont | 17 | 99 | Broken | 97 in 1981 |
| Daytona Beach | 17 | 94 | Broken | 93 in 2001 |
| St. Augustine | 17 | 96 | Broken | 93 in 1990 |
| Tallahassee | 17 | 98 | Broken | 94 in 1993 |
| Clermont | 18 | 98 | Broken | 96 in 2003 |
| Ft. Lauderdale | 18 | 92 | Broken | 90 in 2023 |
| Clermont | 20 | 98 | Broken | 96 in 2015 |
| Vero Beach | 21 | 96 | Broken | 95 in 2015 |
| Daytona Beach | 22 | 96 | Broken | 95 in 1938 |
| Ft. Lauderdale | 22 | 96 | Broken | 95 in 1990 |
| Fort Pierce | 22 | 97 | Broken | 95 in 1988 |
| Homestead | 22 | 98 | Broken | 96 in 2020 |
| Vero Beach | 22 | 95 | Broken | 94 in 2016 |
| Key West | 22 | 96 | Broken | 92 in 2020 |
| Ft. Lauderdale | 23 | 96 | Broken | 94 in 1951 |
| Homestead | 23 | 98 | Broken | 96 in 2015 |
| Bradenton | 24 | 97 | Broken | 95 in 2024 |
| Clermont | 24 | 99 | Broken | 98 in 2000 |
| Clermont | 25 | 100 | Broken | 98 in 2024 |
| Ft. Lauderdale | 26 | 96 | Broken | 94 in 1963 |
| Bradenton | 29 | 97 | Broken | 95 in 2024 |
| Ft. Lauderdale Beach | 29 | 94 | Broken | 92 in 2017 |
Building A, Suite 292
Tallahassee, FL 32306-2741
Phone: (850) 644-3417 | (850) 644-0719
climate@coaps.fsu.edu