


The Florida Climate Center serves as the primary resource for climate data, information, and services in the state of Florida.
Learn more

The Florida Climate Center achieves its mission by providing climate monitoring, research, and expertise to be applied by the people, institutions, and businesses of Florida and the surrounding region.
We provide direct service by fulfilling requests for climate and weather data and information in a variety of formats.
We perform research that advances the understanding of the climate variability and changes of Florida and the surrounding region.
We provide outreach in presentations and at events aimed at a variety of groups, interests, and ages.
Prepared by Florida Climate Center
The Florida State University
Tallahassee, FL

Summary:
- This month brought extreme weather and record heat to the state.
- Average monthly temperatures in May were above normal, with record warmth across central and southern Florida.
- Monthly precipitation totals were above normal in the Panhandle and below normal in the Peninsula.
- Drought expanded across central to south Florida and severe drought (D2) was introduced in Sarasota and Charlotte Counties east to parts of Highlands and Glades Counties.
- A transition to ENSO-neutral conditions is expected sometime in the next month; a transition to La Nina conditions is expected during July-September (69% chance).
Average monthly temperatures in May were above normal. Average monthly temperature departures from normal ranged from +1.5 ̊F in Pensacola to +5.5 ̊F in West Palm Beach for the month (see Table 1 and Appendix 1 for select cities). It was still technically spring, but May 2024 felt like the middle of summer in southern Florida with record breaking heat indices during the middle and end of the month. May 2024 became the hottest May on record for most stations throughout the Peninsula, including Orlando, Melbourne, Tampa, Sarasota, Lakeland, Fort Myers, Naples, West Palm Beach, Miami, Homestead, and Key West. The Hollywood North Perry Airport hit 100 ̊F on May 15th and 26th, and it hit 101 ̊F on the 19th, which became the all-time highest temperature for that station. The Sarasota Bradenton AP reached a high temperature of 99 ̊F on the 30th. West Palm Beach and Fort Lauderdale experienced a peak heat index of 115 ̊F on May 18th. The Miami International Airport station reached triple digit heat indices earliest on record and tied its 3rd-highest heat index value of 112 ̊F on the 18th and 19th. Key West hit a heat index value of 114 ̊F on the 15th. High SSTs and a large area of high pressure are contributing to these extreme temperatures. There was a total of 146 daily high maximum temperature records set during the month; select daily high maximum temperature records are provided in Appendix 2.
Table 1. May average temperatures and departures from normal ( ̊F) for selected cities.
| Station | Mean Temperature | Departure from Normal |
| Pensacola | 77.5 | +1.5 |
| Tallahassee | 78.6 | +3.4 |
| Jacksonville | 78.3 | +3.4 |
| Orlando | 81.4 | +4.1 |
| Tampa | 83.0 | +3.5 |
| Miami | 83.7 | +3.6 |
| Key West | 84.7 | +3.6 |
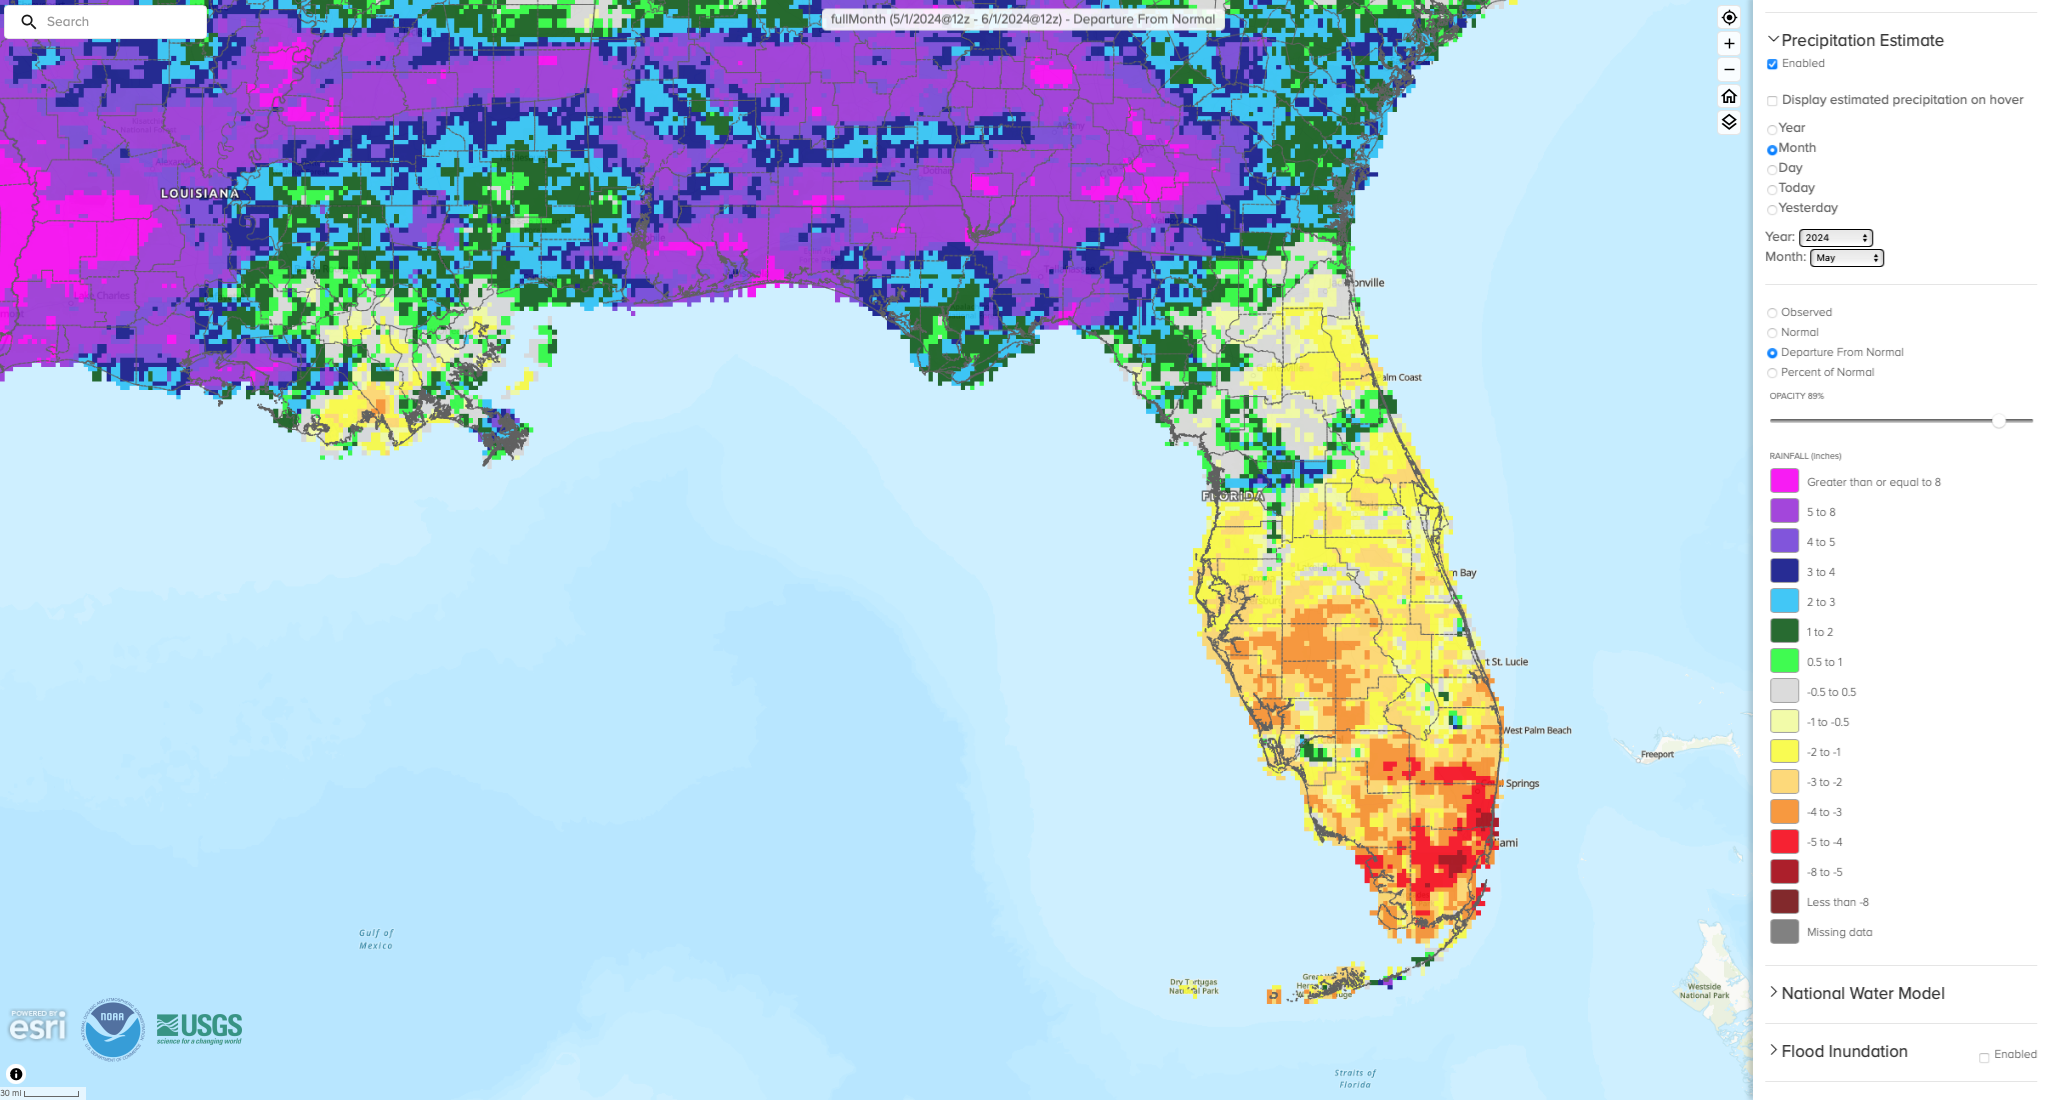
Monthly rainfall totals in May were above normal in the Panhandle and below normal across the Peninsula. The monthly precipitation departures from normal ranged from -5.89 inches in Ft. Lauderdale to +4.33 inches in Tallahassee (see Table 2 and Appendix 1 for select locations). Sarasota experienced its driest May on record (based on a 113-year period of record). As a result of drying conditions and record high temperatures across the central and southern Peninsula, moderate drought conditions expanded and severe drought emerged in southwest Florida in parts of Sarasota and Charlotte Counties east to Glades and southern Highlands County (see below for more drought information).
Table 2. May precipitation totals and departures from normal (inches) for selected cities.
| Station | Total Rainfall | Departure from Normal |
| Pensacola | 7.38 | +3.48 |
| Tallahassee | 7.69 | +4.33 |
| Jacksonville | 3.05 | -0.37 |
| Orlando | 1.80 | -2.22 |
| Tampa | 1.07 | -1.53 |
| Miami | 4.21 | -2.11 |
| Key West | 2.13 | -0.99 |
Figure 1. A graphical depiction of the monthly rainfall departure from normal (inches) for May (courtesy of NOAA, NWS).
El Niño Advisory / La Niña Watch.
El Niño conditions, the warm phase of the El Niño Southern Oscillation climate pattern in the tropical equatorial Pacific Ocean, have continued to weaken. A transition to ENSO-neutral is expected within the next month. The atmospheric components of El Niño have essentially shut off, while ocean signals have weakened with some regions seeing decreased sea surface temperatures and lower Niño index values over the last month. La Niña is expected to emerge during June-August 2024 (49% chance). Chances increase to 69% deeper into summer, during July-September 2024. Historically, La Niña conditions typically follow strong El Niños, which adds to the forecast confidence.
Hazardous Weather Events in May.
According to the Local Storm Reports issued by the local National Weather Service offices serving Florida, there were 465 individual local reports of hazardous weather events recorded across the state during the month of May (see Table 4 for a breakdown by event type). An active weather pattern this month led to severe weather across the state with high winds and golf-ball sized hail leading to downed trees, downed power lines, and flash flooding. Strong storms and straight-line winds impacted parts of southwest Florida, and the Panhandle saw multiple rounds of severe weather with straight-line winds and tornadoes. This includes an outbreak in Leon and surrounding counties on May 10th, which is described in more detail below.
Table 3. Breakdown of storm reports submitted in Florida during the month of May (compiled from Iowa State University/Iowa Environmental Mesonet).
| Report Type | Number of Reports |
| Heavy Rain | 3 |
| Flood | 3 |
| Flash Flood | 18 |
| Coastal Flood | 0 |
| Hail | 51 |
| Marine Thunderstorm Wind | 41 |
| Non-Thunderstorm Wind Gust | 18 |
| Non-Thunderstorm Wind Damage | 0 |
| Tornado/Waterspout/Funnel Cloud | 8/5/8 |
| Thunderstorm Wind Damage | 103 |
| Thunderstorm Wind Gust | 201 |
| Rip Currents | 0 |
| Lightning | 1 |
| Wildfire | 5 |
Daily Record Events in May.
Table 4. Summary of daily records broken or set in Florida in May (source: NCEI Daily Weather Records).
| Category | Number of Records |
| Highest daily max. temp. | 146 |
| Highest daily min. temp. | 172 |
| Lowest daily max. temp. | 3 |
| Lowest daily min. temp. | 0 |
| Highest daily precipitation | 29 |
| Total | 350 |
Weather/Climate Highlights of the Month: May 10th Tornadoes in Leon County.
May brought an active weather pattern both in Florida and across the country. Nationally, the number of local storm reports since January 1st ranks 2nd dating back to 2010. A tornado outbreak on May 8-10 affected much of the Southeast U.S. On the morning of May 10, a squall line affected the tri-state area with 100+ mph straight-line winds and the storm spawned 5 tornadoes in the area. Three tornadoes touched down in Tallahassee in less than 30 minutes, according to the National Weather Service. The number of broken power poles from this event exceeded that from hurricanes Hermine, Michael, and Idalia combined, according to NWS and the City of Tallahassee. Over 70,000 customers were without power on Friday, and over 400 utility poles were downed. In addition to damage to utility structures, numerous trees were broken, homes damaged, and businesses affected, including FSU, FAMU, and the Railroad Square district.
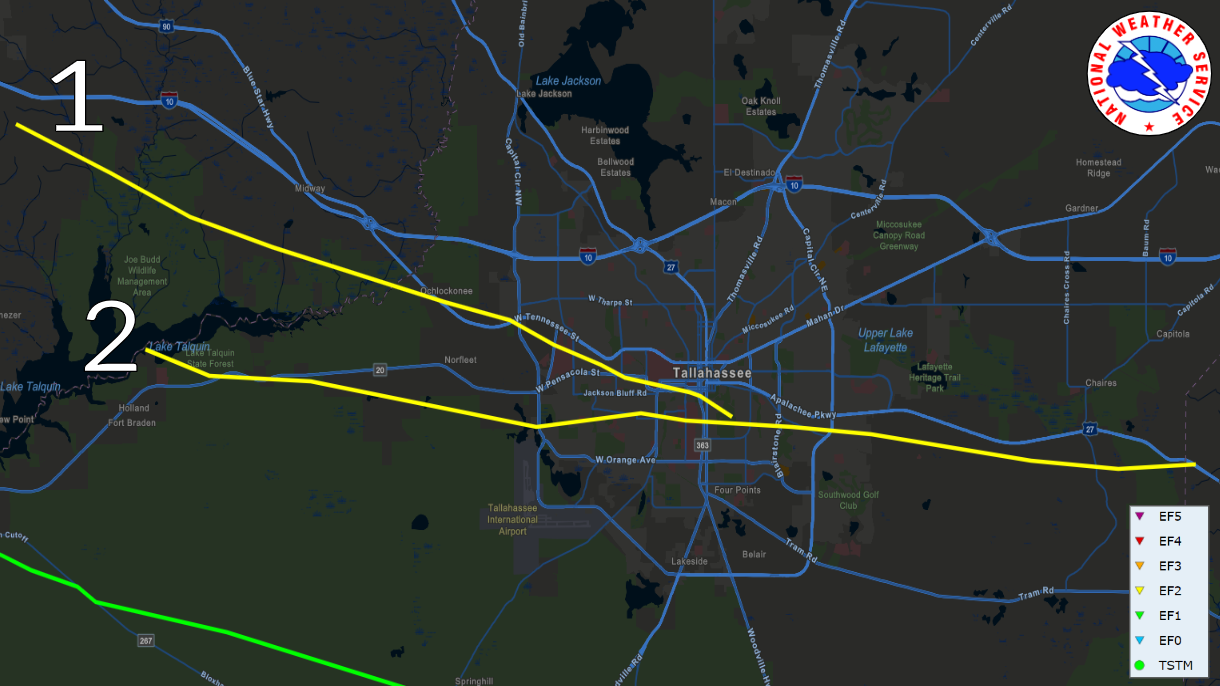
The first tornado path shown in the image above was rated an EF2. It was on the ground for nearly 20 miles with peak wind speeds of 115 mph. The second tornado was also rated EF2 and was on the ground for 27 miles. These two tornadoes converged at the Capital City Country Club in Tallahassee, where the second tornado became the dominant circulation moving on toward the east. A third tornado, rated EF1 (shown in the bottom left of the image above) moved across southern Leon County in Woodville with a path length of nearly 32 miles and peak wind speeds of 110 mph. Three other tornadoes, including an EF1 and two EF0s touched down in surrounding counties. Read more about the storm and damages from the Tallahassee National Weather Service office here: https://www.weather.gov/tae/2024_05_Tornadoes.
Drought-Related Impacts.
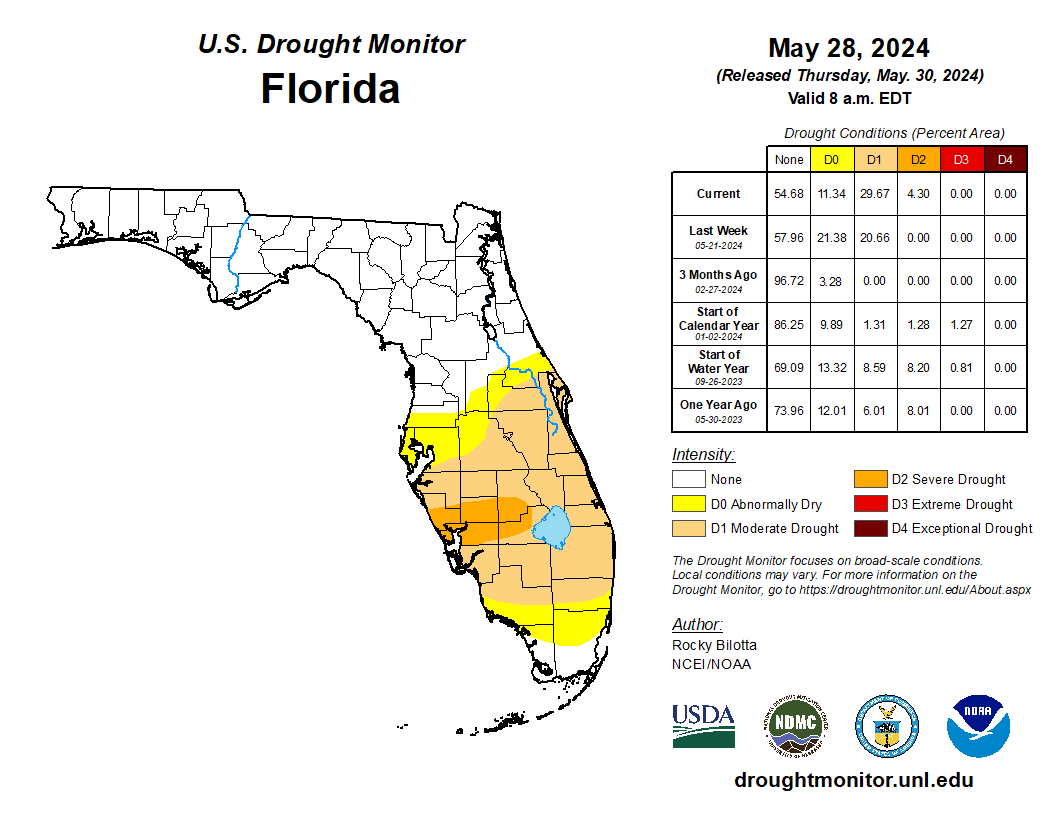
By mid-May, approximately 16% of the state was experiencing moderate drought (D1) conditions and 22% of the state was abnormally dry (D0), according to the U.S. Drought Monitor. Drought expansion and degradation occurred by the end of the month, with 4% of the state in severe drought (D2), 30% in moderate drought (D1), and 11% abnormally dry (D0) (see Figure 3 below). As of the end of the month, 13 counties in central and southern Florida had outdoor burn bans in place, and wildfires broke out during the month across these regions.
As of May 31, the Lake Okeechobee water level was 12.97 ft. above sea level (Feet-NGVD29), which is just below average for this time of year. At the first of the month, the water level was 14.18 ft. above sea level.
Figure 2. A graphical depiction of the latest drought conditions in Florida according to the U.S. Drought Monitor (courtesy of the National Drought Mitigation Center, University of Nebraska-Lincoln).
Agriculture-Related Impacts.
In mid-May, topsoil moisture conditions were adequate in 71% of the state, short in 23%, and very short in 5% of the state, while 1% of the state had surplus topsoil moisture conditions. Near the end of May, topsoil moisture conditions were adequate in 65% of the state, short in 23%, and very short in 7% of the state; 5% of the state was in surplus conditions. While much of the Southeast region has grappled with wet conditions, drought is beginning to affect the main citrus belt region in Florida with daily irrigation needed. For more information, consult the Crop Progress and Conditions report, which is published by the USDA’s National Agricultural Statistics Service.
Appendix 1
Additional May departures from normal data for select Florida locations (Source: NWS).
| Station | Average Temperature (˚F) | Departure from Normal (˚F) | Total Rainfall (in.) | Departure from Normal (in.) |
| Gainesville | 77.4 | +2.4 | 1.59 | -1.49 |
| Sarasota | 81.4 | +3.6 | 0.02 | -2.56 |
| Naples | 83.0 | +4.2 | 0.72 | -2.04 |
| Fort Myers | 83.2 | +3.9 | 3.83 | +0.37 |
| West Palm Beach | 84.2 | +5.5 | 1.18 | -3.73 |
Appendix 2
Select daily record high maximum temperatures (°F) broken during May (compiled from NOAA).
| Location | Date | Record | Broken/Tied | Last |
| Orlando | 8 | 96 | Broken | 95 in 2009 |
| Jacksonville | 8 | 97 | Broken | 95 in 2009 |
| Clermont | 9 | 97 | Broken | 96 in 2009 |
| Deland | 9 | 97 | Broken | 96 in 1916 |
| Plant City | 9 | 100 | Broken | 96 in 1955 |
| Orlando | 9 | 97 | Broken | 95 in 2009 |
| Daytona Beach | 9 | 97 | Broken | 94 in 1978 |
| Tallahassee | 9 | 96 | Broken | 95 in 2015 |
| Jacksonville | 9 | 99 | Broken | 95 in 2009 |
| Hialeah | 10 | 96 | Broken | 94 in 1998 |
| Vero Beach | 10 | 96 | Broken | 92 in 1998 |
| Fort Lauderdale | 11 | 96 | Broken | 93 in 2008 |
| West Palm Beach | 11 | 97 | Broken | 95 in 2011 |
| Key West | 11 | 94 | Broken | 90 in 2019 |
| Homestead | 13 | 96 | Broken | 93 in 2021 |
| Fort Lauderdale | 14 | 96 | Broken | 94 in 1971 |
| Key West | 15 | 92 | Broken | 90 in 1991 |
| West Palm Beach | 15 | 98 | Broken | 94 in 1995 |
| Fort Lauderdale | 16 | 96 | Broken | 94 in 1995 |
| Homestead | 17 | 97 | Broken | 92 in 2022 |
| Hialeah | 18 | 96 | Broken | 93 in 1989 |
| Orlando | 18 | 96 | Broken | 95 in 1981 |
| Fort Lauderdale | 19 | 98 | Broken | 94 in 2008 |
| West Palm Beach | 19 | 98 | Broken | 94 in 2008 |
| Miami | 19 | 96 | Broken | 94 in 1995 |
| Homestead | 20 | 100 | Broken | 93 in 2008 |
| Bradenton | 25 | 98 | Broken | 94 in 2015 |
| Bradenton | 26 | 97 | Broken | 95 in 1975 |
| Homestead | 26 | 98 | Broken | 92 in 1999 |
| Miami | 26 | 96 | Broken | 94 in 1949 |
| Homestead | 26 | 98 | Broken | 92 in 1999 |
| Miami | 26 | 96 | Broken | 94 in 1949 |
| Archbold Bio Stn | 27 | 100 | Broken | 99 in 2000 |
| Fort Lauderdale | 27 | 99 | Broken | 94 in 1924 |
| Homestead | 27 | 98 | Broken | 93 in 1999 |
| Fort Pierce | 28 | 97 | Broken | 95 in 1973 |
| West Palm Beach | 28 | 99 | Broken | 93 in 2017 |
| Stuart | 29 | 97 | Broken | 95 in 1973 |
| Bradenton | 30 | 100 | Broken | 95 in 2005 |
| Clermont | 30 | 100 | Broken | 98 in 2019 |
| Homestead | 30 | 98 | Broken | 92 in 2017 |
| Tampa | 30 | 98 | Broken | 96 in 2022 |
Prepared by Florida Climate Center
The Florida State University
Tallahassee, FL
Summary:
- Average monthly temperatures continued to be above normal in June.
- Monthly precipitation totals were below normal in North Florida and the Panhandle and above normal in South Florida.
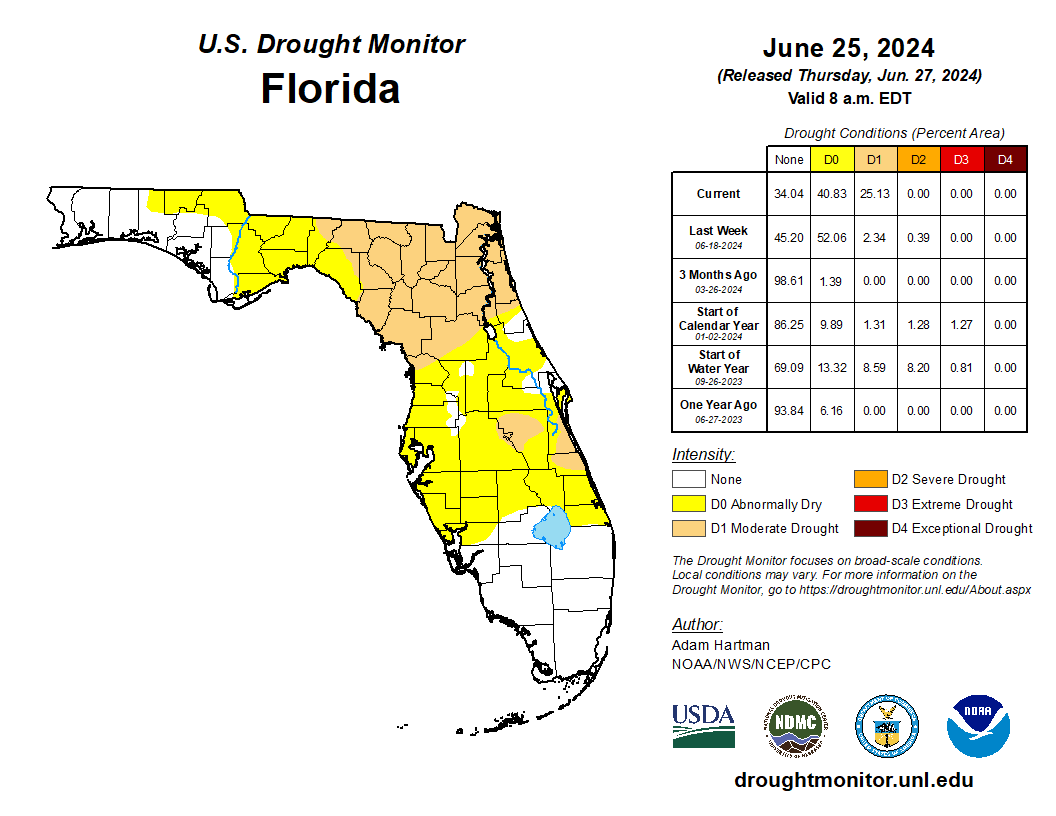
- Drought was removed in South Florida by mid-June following heavy rainfall; drought developed in North Florida by the end of the month. As of June 25, 25% of the state was in moderate drought (D1) and 41% was abnormally dry (D0), according to the U.S. Drought Monitor.
- ENSO-neutral conditions are currently present in the equatorial Pacific Ocean; a transition to La Niña conditions is expected during July-September (65% chance).
- Hurricane Beryl became the strongest hurricane on record in the Atlantic Basin during June, and it is the earliest Category 5 hurricane on record to form in the main development region of the tropical Atlantic Ocean.
Average monthly temperatures in June continued to be above normal. Average monthly temperature departures from normal ranged from -0.2 ̊F in Pensacola to +3.4 ̊F in Tallahassee for the month (see Table 1 and Appendix 1 for select cities). It was the warmest June on record in Tampa Bay (38 years), Plant City (121 years), and Punta Gorda (102 years). Several other locations recorded one of their top five warmest Junes on record, including Tallahassee, Apalachicola, Daytona Beach, Orlando, Leesburg, Tampa, Naples, Sarasota, and Melbourne. Much above normal temperatures were experienced during the first week of June, with maximum temperatures reaching 100-101 ̊F in central Florida, which was 9-12 ̊ F above normal. North Florida experienced triple-digit temperatures later in the month from Crestview to Jacksonville. Select daily high maximum temperature records tied or broken during the month are provided in Appendix 2.
Table 1. June average temperatures and departures from normal ( ̊F) for selected cities.
| Station | Mean Temperature | Departure from Normal |
| Pensacola | 81.5 | -0.2 |
| Tallahassee | 84.2 | +3.4 |
| Jacksonville | 82.6 | +2.3 |
| Orlando | 83.3 | +2.1 |
| Tampa | 84.1 | +1.2 |
| Miami | 83.1 | +0.3 |
| Key West | 84.2 | +0.1 |
Monthly rainfall totals in June were below normal in North Florida and the Panhandle and above normal across South Florida. The monthly precipitation departures from normal ranged from -3.85 inches in Tallahassee to +12.62 inches in Fort Myers (see Table 2 and Appendix 1 for select locations). The month began with moderate to severe drought affecting central and southern Florida. However, a system known as Invest 90L brought warm tropical moisture into the state and produced bands of heavy rainfall during June 11-14 across central and southern Florida, leading to drought improvement across the region. Locations affected by the system experienced well-above normal rainfall for the month. June 2024 became the wettest June on record in Fort Myers (120 years), 2nd-wettest in Fort Lauderdale (27 years) and Naples (23 years), 3rd-wettest in Sarasota (111 years), and 8th-wettest in Miami (88 years).
Table 2. June precipitation totals and departures from normal (inches) for selected cities.
| Station | Total Rainfall | Departure from Normal |
| Pensacola | 8.45 | +1.13 |
| Tallahassee | 3.91 | -3.85 |
| Jacksonville | 4.29 | -3.31 |
| Orlando | 6.37 | -1.68 |
| Tampa | 11.91 | +4.54 |
| Miami | 17.34 | +6.83 |
| Key West | 8.47 | +4.24 |
Figure 1. A graphical depiction of the monthly rainfall departure from normal (inches) for June (courtesy of NOAA, NWS).
La Niña Watch.
El Niño conditions, the warm phase of the El Niño Southern Oscillation climate pattern in the tropical equatorial Pacific Ocean, have ended. ENSO-neutral conditions returned over the past month. The coupled ocean-atmosphere system currently reflects ENSO-neutral conditions. Near to below average sea surface temperatures expanded across the eastern equatorial Pacific Ocean, and upper level winds were near average. La Niña conditions are expected to emerge during July-September 2024 (65% chance) and are expected to persist into the Northern Hemisphere winter (85% during November-January).
Hazardous Weather Events in June.
According to the Local Storm Reports issued by the local National Weather Service offices serving Florida, there were 269 individual local reports of hazardous weather events recorded across the state during the month of June (see Table 4 for a breakdown by event type). Heavy rainfall led to multiple occasions of flooded roadways during the month, stranding vehicles, closing roadways, and leading to water rescues. Lightning strikes led to two fatalities, and rip currents led to 8 additional fatalities this month.
Table 3. Breakdown of storm reports submitted in Florida during the month of June (compiled from Iowa State University/Iowa Environmental Mesonet).
| Report Type | Number of Reports |
| Heavy Rain | 44 |
| Flood | 15 |
| Flash Flood | 30 |
| Coastal Flood | 0 |
| Hail | 8 |
| Marine Thunderstorm Wind | 17 |
| Non-Thunderstorm Wind Gust | 29 |
| Non-Thunderstorm Wind Damage | 0 |
| Tornado/Waterspout/Funnel Cloud | 5/12/6 |
| Thunderstorm Wind Damage | 26 |
| Thunderstorm Wind Gust | 68 |
| Rip Currents | 5 |
| Lightning | 3 |
| Wildfire | 1 |
Daily Record Events in June.
Table 4. Summary of daily records broken or set in Florida in June (source: NCEI Daily Weather Records).
| Category | Number of Records |
| Highest daily max. temp. | 66 |
| Highest daily min. temp. | 96 |
| Lowest daily max. temp. | 5 |
| Lowest daily min. temp. | 0 |
| Highest daily precipitation | 37 |
| Total | 204 |
Weather/Climate Highlights of the Month: Heavy Rainfall Event in South Florida June 11 – 14 from Invest 90L.
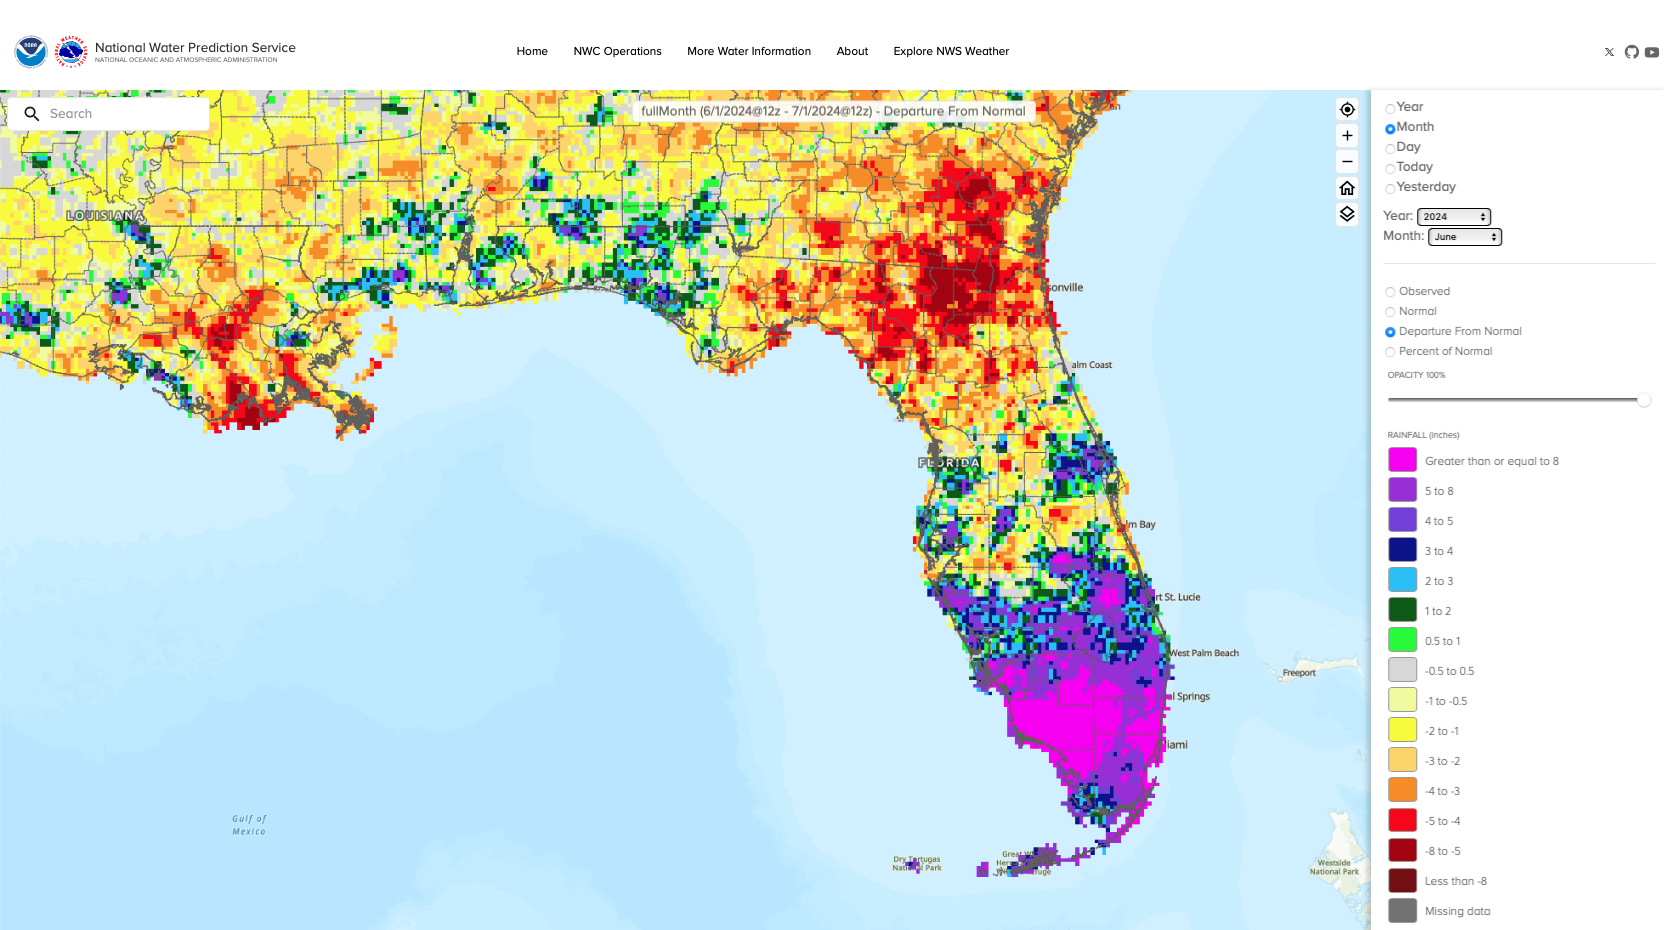
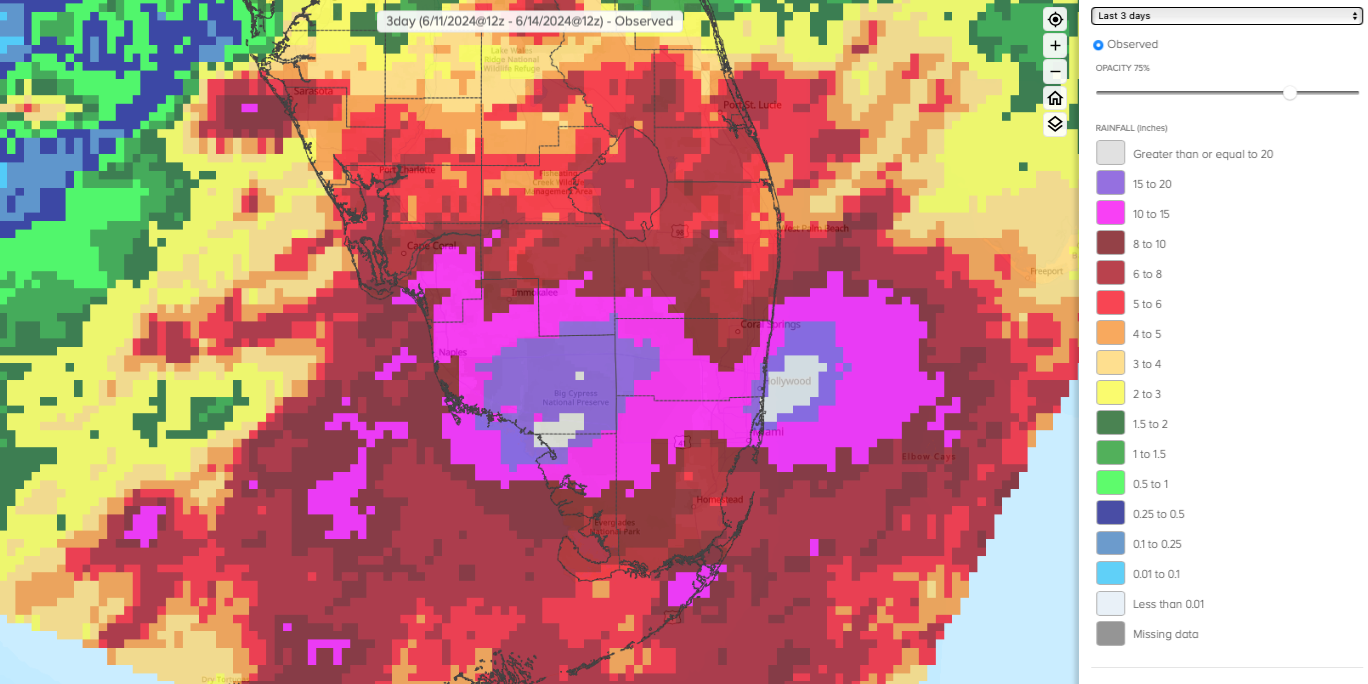
On June 11-13, Invest 90L tracked across the Peninsula, bringing warm tropical moisture and multiple rounds of heavy rainfall to the state. Some locations received well over a foot of rain from the system, causing extensive flooding. Figure 2 shows the 3-day observed rainfall totals across South Florida from June 11- 14, from the National Water Prediction Service. The heaviest rainfall fell as two bullseyes over southwest and coastal southeastern areas. The 72-hour storm totals, ending Friday June 14, exceeded 20 inches in several locations, including Hallandale in Broward County with 20.65 inches, the Big Cypress NR Everglades station in Collier County with 27.95 inches, and the Miami Shores station in Miami-Dade County with 21.66 inches, according to reports from the Weather Service Office in Miami.
Several hourly and daily rainfall records were broken. The Sarasota-Bradenton Airport reported an all-time one-hour rainfall record of 3.93 inches on June 11. The airport also observed a new daily rainfall record of 6.47 inches that day, which surpassed the previous record of 2.50 inches set in 1940. On June 11 and 12, Fort Lauderdale reported back-to-back new daily records of 3.30 inches and 9.54 inches, respectively, surpassing the previous daily records of 3.10 inches in 1947 and 5.47 inches in 1978, respectively. The Miami International Airport reported its second-highest daily precipitation on record with 6.25 inches on the 12th; the record for this day is 8.25 inches set in 1901.
Figure 2. The 3-day observed rainfall totals in South Florida from June 11 – 14, 2024. Source: National Water Prediction Service.
Drought-Related Impacts.
While June started out very dry across South Florida, heavy rainfall in the region and the beginning of the rainy season led to drought removal by mid-month. Conversely, areas further to the north experienced drying conditions during the month. By mid-June, 0.39% of the state was experiencing severe drought (D2) conditions, 2.34% of the state was in moderate drought (D1), and 52% of the state was abnormally dry (D0), according to the U.S. Drought Monitor. By the end of the month, 25% of the state was in moderate drought (D1) and 41% was abnormally dry (D0) (Figure 3 below).
As of June 30, the Lake Okeechobee water level was 13.45 ft. above sea level (Feet-NGVD29), which is about average for this time of year. At the first of the month, the water level was below average at 12.91 ft. above sea level.
Figure 3. A graphical depiction of the latest drought conditions in Florida according to the U.S. Drought Monitor (courtesy of the National Drought Mitigation Center, University of Nebraska-Lincoln).
Agriculture-Related Impacts.
In mid-June, topsoil moisture conditions were adequate in 43% of the state, short in 19%, and very short in 11% of the state, while 27% of the state had surplus topsoil moisture conditions. By the end of June, topsoil moisture conditions were adequate in 74% of the state, short in 13%, and very short in 4% of the state; 9% of the state was in surplus conditions. For more information, consult the Crop Progress and Conditions report, which is published by the USDA’s National Agricultural Statistics Service.
Appendix 1
Additional June departures from normal data for select Florida locations (Source: NWS).
| Station | Average Temperature (˚F) | Departure from Normal (˚F) | Total Rainfall (in.) | Departure from Normal (in.) |
| Gainesville | 81.7 | +1.8 | 6.29 | -0.64 |
| Sarasota | 83.1 | +1.3 | 16.88 | +9.83 |
| Naples | 83.4 | +1.3 | 16.98 | +9.48 |
| Fort Myers | 83.6 | +1.3 | 22.28 | +12.62 |
| West Palm Beach | 82.9 | +1.2 | 9.84 | +1.36 |
Appendix 2
Select daily record high maximum temperatures (°F) tied or broken during June (compiled from NOAA).
| Location | Date | Record | Broken/Tied | Last |
| Fort Lauderdale Beach | 1 | 98 | Broken | 90 in 2022 |
| Tampa Bay | 2 | 96 | Broken | 94 in 1986 |
| Tampa Bay | 4 | 98 | Broken | 95 in 2016 |
| Fort Myers | 5 | 98 | Tied | 98 in 1985 |
| Plant City | 6 | 103 | Broken | 100 in 1985 |
| Raccoon Point | 6 | 100 | Broken | 99 in 2006 |
| Key West | 6 | 94 | Broken | 92 in 2022 |
| Orlando | 6 | 101 | Broken | 96 in 2000 |
| Lakeland | 6 | 100 | Broken | 99 in 1985 |
| Jacksonville | 6 | 101 | Broken | 98 in 1998 |
| Clermont | 7 | 102 | Broken | 99 in 2021 |
| Deland | 7 | 100 | Tied | 100 in 1933 |
| Kissimmee | 7 | 101 | Broken | 99 in 1999 |
| Plant City | 7 | 103 | Broken | 99 in 1985 |
| Orlando | 7 | 96 | Broken | 94 in 2022 |
| Bradenton | 8 | 97 | Broken | 96 in 1993 |
| Clermont | 8 | 100 | Broken | 97 in 2022 |
| Lisbon | 8 | 98 | Broken | 96 in 1985 |
| Clermont | 9 | 100 | Broken | 98 in 2021 |
| Fort Lauderdale Beach | 9 | 96 | Broken | 91 in 2019 |
| Kissimmee | 9 | 101 | Broken | 95 in 2014 |
| Jacksonville | 9 | 102 | Broken | 100 in 2007 |
| Fort Pierce | 11 | 96 | Broken | 94 in 1990 |
| Tampa Bay | 14 | 96 | Broken | 95 in 2022 |
| Pensacola | 15 | 98 | Broken | 97 in 2011 |
| Naples | 20 | 98 | Broken | 96 in 1964 |
| Jacksonville | 23 | 100 | Tied | 100 in 2022 |
| Chipley | 24 | 100 | Tied | 100 in 2022 |
| Marianna | 25 | 101 | Broken | 100 in 2010 |
| Tallahassee | 25 | 101 | Tied | 101 in 1988 |
| Key West | 30 | 96 | Broken | 94 in 2022 |
Prepared by Florida Climate Center
The Florida State University
Tallahassee, FL
Summary:
- Average monthly temperatures in August were above normal.
- Monthly precipitation totals were above normal in areas impacted by Hurricane Debby along the west coast and north-central Florida, but below normal in the Panhandle and east coast of Florida.
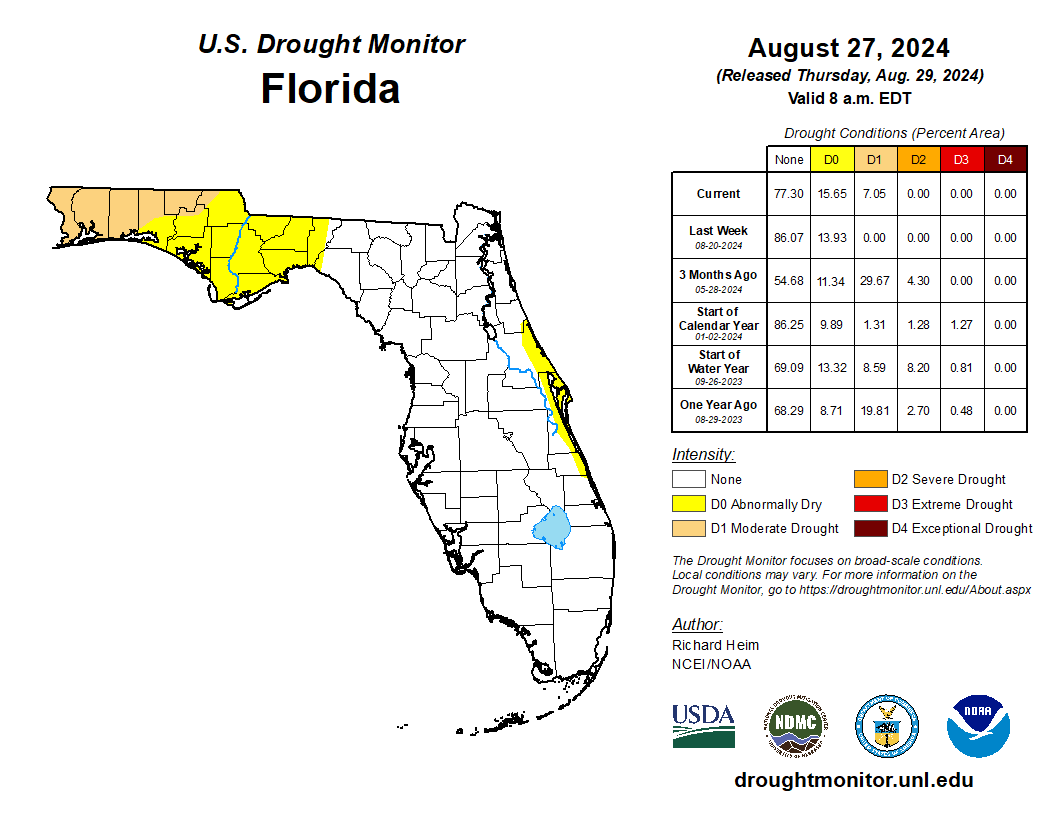
- Drought development occurred toward the end of the month in the western Panhandle; 7% of the state was in moderate drought (D1) and 16% was abnormally dry (D0) at the end of the month.
- ENSO-neutral conditions are currently present in the tropical equatorial Pacific Ocean. A transition to La Niña conditions is expected during September-November (66% chance).
- Hurricane Debby made landfall in Florida’s Big Bend (Taylor County) as a Category 1 hurricane on August 5, which brought torrential rainfall and storm surge flooding, damaging winds, and tornadoes.
Average monthly temperatures in August were above normal. Average monthly temperature departures from normal ranged from +0.3°F in Sarasota to +2.9°F in Tallahassee for the month (see Table 1 and Appendix 1 for select cities). Several stations recorded one of their warmest Augusts on record; it was the 2nd-warmest August on record for Niceville, Tallahassee, Tampa, and Punta Gorda, and 3rd-warmest August on record for Daytona Beach, Fort Myers, and Naples. Pensacola saw several 100°F+ days during the first half of the month, smashing previous daily records by several degrees. Key West smashed their daily record high on the 10th and 13th, with 101°F and 102°F, respectively. For the summer as a whole (JJA), rankings show that several stations recorded their warmest summer on record, including Tallahassee (127 years), Orlando (70 years), Plant City (118 years), Punta Gorda (99 years), and Ft. Lauderdale (104 years). Select daily high maximum temperature records tied or broken during the month are provided in Appendix 2.
Table 1. August average temperatures and departures from normal ( ̊F) for selected cities.
| Station | Mean Temperature | Departure from Normal |
| Pensacola | 83.5 | +0.5 |
| Tallahassee | 85.3 | +2.9 |
| Jacksonville | 83.1 | +1.0 |
| Orlando | 84.3 | +1.7 |
| Tampa | 84.7 | +0.7 |
| Miami | 85.0 | +0.8 |
| Key West | 86.1 | +0.6 |
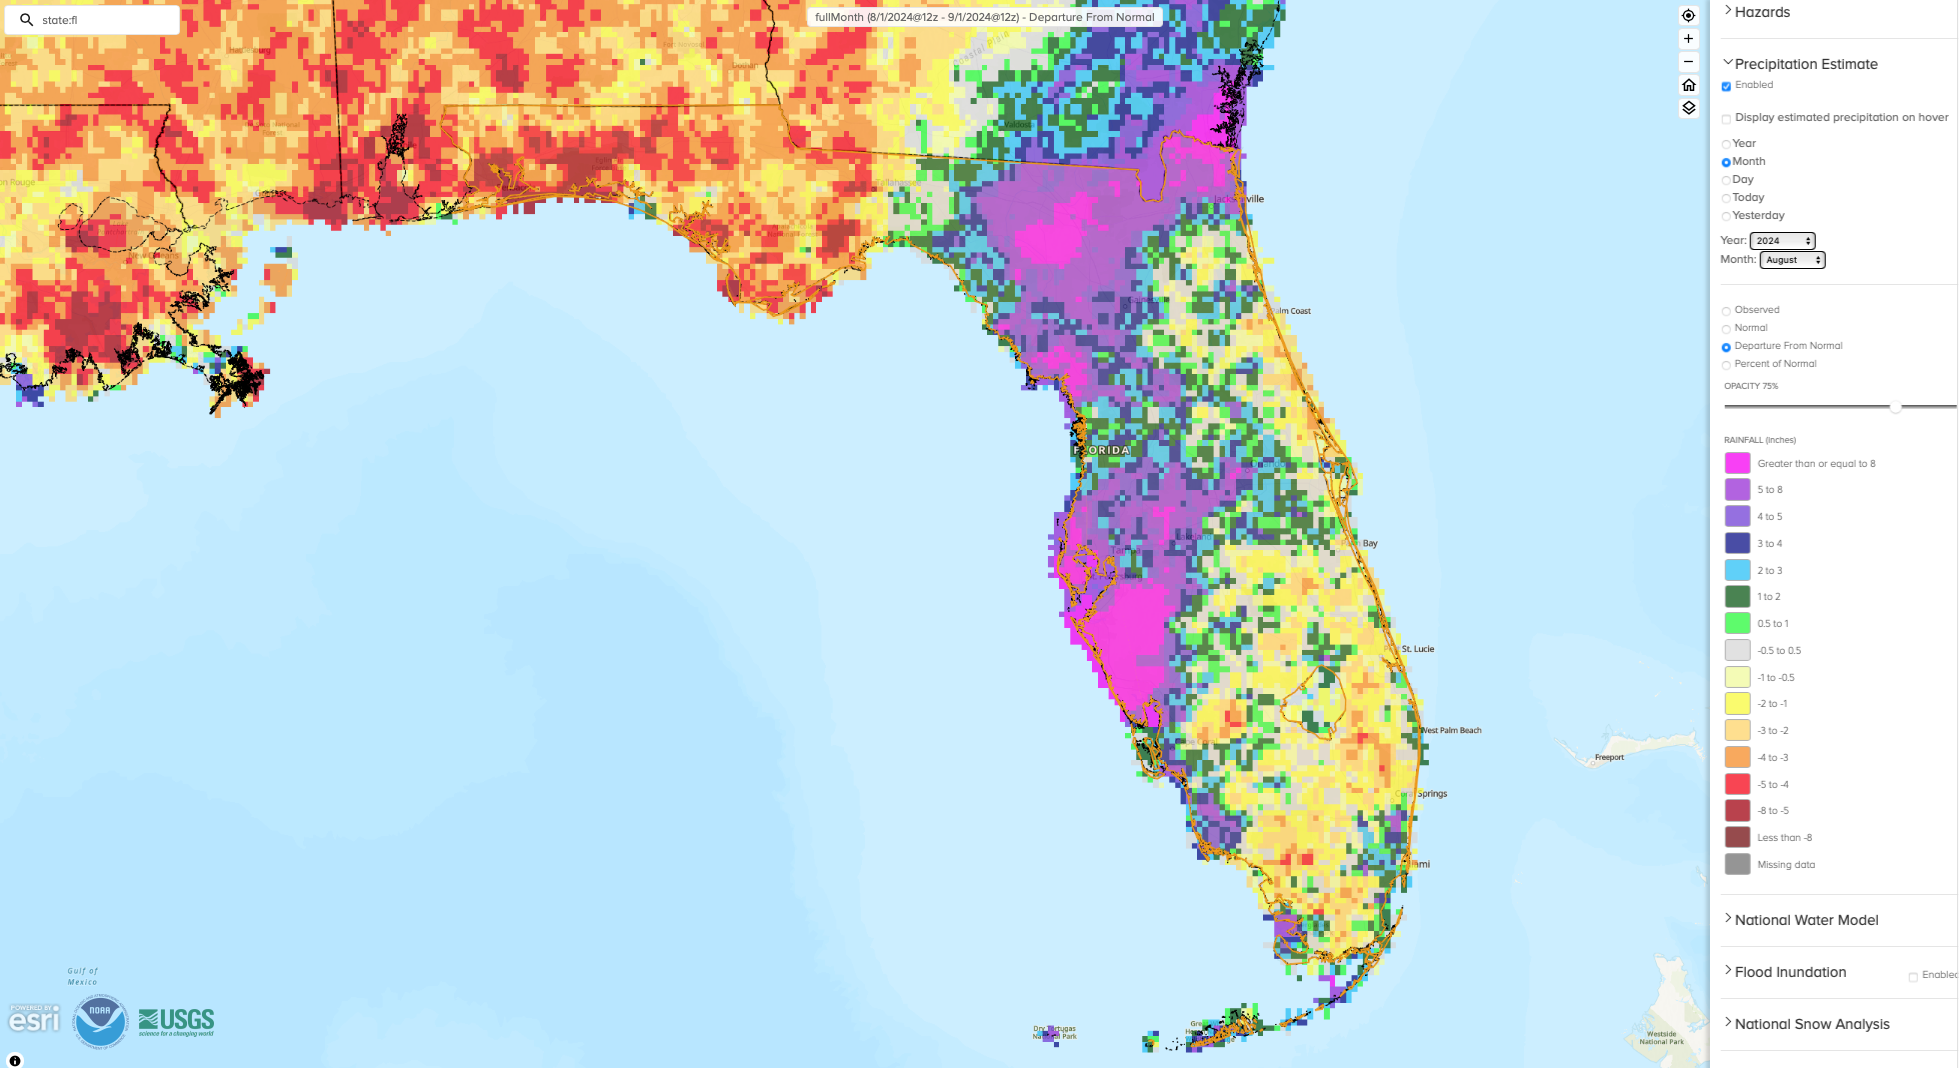
Monthly rainfall totals in August were above normal along the west coast and north-central Florida and below normal in the Panhandle and east coast of Florida. The monthly precipitation departures from normal ranged from -6.54 inches in Pensacola to +14.44 inches in Sarasota (see Table 2 and Appendix 1 for select locations). Hurricane Debby’s rainfall shows clearly in the monthly departures from normal map with much wetter than normal conditions (Figure 1). Southwest Florida had a surplus of 8 inches or more in August, and this region was wetter than normal for the summer as a whole (JJA). Locations that recorded their wettest summer on record include Fort Myers (124 years) and Sarasota (110 years), while Tampa and Naples observed their 2nd-wettest summer on record. These locations recorded a surplus of 14 inches or more in summer rainfall. Hurricane Debby left other parts of the state with below normal rainfall for the month. With less than one inch of rain for the entire month, Pensacola saw their 3rd-driest August on record. Below-normal rainfall combined with high temperatures led to drought development in the western Panhandle (see Figure 2).
Table 2. August precipitation totals and departures from normal (inches) for selected cities.
| Station | Total Rainfall | Departure from Normal |
| Pensacola | 0.96 | -6.54 |
| Tallahassee | 4.11 | -3.49 |
| Jacksonville | 12.44 | +5.56 |
| Orlando | 7.79 | +0.10 |
| Tampa | 17.78 | +8.75 |
| Miami | 12.83 | +3.25 |
| Key West | 9.04 | +3.67 |
Figure 1. A graphical depiction of the monthly rainfall departure from normal (inches) for August (courtesy of NOAA, NWS).
ENSO Neutral / La Niña Watch.
ENSO-neutral conditions continue to linger in the tropical equatorial Pacific Ocean and are expected to persist for the next few months. La Niña conditions are still expected to emerge during September-November 2024 (66% chance) and persist through the Northern Hemisphere winter (74% chance during November-January). The cooling of SSTs has been slow, but below-average ocean temperatures and low-level easterly wind anomalies point to La Niña developing in the coming months.
Hazardous Weather Events in August.
According to the Local Storm Reports issued by the local National Weather Service offices serving Florida, there were 619 individual local reports of hazardous weather events recorded across the state during the month of August (see Table 4 for a breakdown by event type). Hurricane Debby made landfall as a Category 1 storm near Steinhatchee, FL on the morning of August 5th, bringing heavy rain, high winds, and storm surge along Florida’s west coast and Big Bend regions. A wind gust of 70 mph was reported in Mayo in Lafayette County, and 60+ wind gusts were observed in Madison and Suwannee Counties. Debby led to flooded roadways and homes. Major flooding and water rescues were reported in Columbia County, in Live Oak in Suwannee County, and Sarasota County. Multiple injuries were reported as well, mostly from fallen trees, and Debby led to several fatalities in the state. See our Hurricane Debby Post-Storm Summary Report for more information on the storm and its impacts. August 2024 also brought extreme heat to parts of the state. A heat index of 116°F was reported in Bay County, and a heat index of 115°F was observed in Franklin County, both observed on the 8th.
Table 3. Breakdown of storm reports submitted in Florida during the month of August (compiled from Iowa State University/Iowa Environmental Mesonet).
| Report Type | Number of Reports |
| Heavy Rain | 54 |
| Flood | 21 |
| Flash Flood | 25 |
| Coastal Flood | 3 |
| Hail | 1 |
| Marine Thunderstorm Wind | 55 |
| Non-Thunderstorm Wind Gust | 47 |
| Non-Thunderstorm Wind Damage | 4 |
| Tornado/Waterspout/Funnel Cloud | 8/26/5 |
| Thunderstorm Wind Damage | 25 |
| Thunderstorm Wind Gust | 175 |
| Rip Currents | 1 |
| Lightning | 7 |
| Extreme Heat | 4 |
| Tropical Cylone | 141 |
| Storm Surge | 17 |
Daily Record Events in August.
Table 4. Summary of daily records broken or set in Florida in August (source: NCEI Daily Weather Records).
| Category | Number of Records |
| Highest daily max. temp. | 41 |
| Highest daily min. temp. | 105 |
| Lowest daily max. temp. | 14 |
| Lowest daily min. temp. | 3 |
| Highest daily precipitation | 43 |
| Total | 206 |
Drought-Related Impacts.
By mid-August, the state was drought free and 1.6% of the state was abnormally dry (D0), according to the U.S. Drought Monitor. By the end of the month, drought developed in the western Panhandle. About 7% of the state was in moderate drought (D1) and 15.7% was abnormally dry (D0) (Figure 2 below).
As of August 31, the Lake Okeechobee water level was 14.27 ft. above sea level (Feet-NGVD29), which is average for this time of year. At the first of the month, the water level was 13.56 ft. above sea level.
Figure 2. A graphical depiction of the latest drought conditions in Florida according to the U.S. Drought Monitor (courtesy of the National Drought Mitigation Center, University of Nebraska-Lincoln).
Agriculture-Related Impacts.
Hurricane Debby was a major rainmaker in Florida and up through the Carolinas. The storm drowned or otherwise damaged many crops. In mid-August, topsoil moisture conditions were adequate in 62% of the state, short in 17%, and very short in 3% of the state, while 18% of the state had surplus topsoil moisture conditions. By the end of August, topsoil moisture conditions were adequate in 66% of the state, short in 17%, and very short in 2% of the state; 15% of the state was in surplus conditions. For more information, consult the Crop Progress and Conditions report, which is published by the USDA’s National Agricultural Statistics Service.
Appendix 1
Additional August departures from normal data for select Florida locations (Source: NWS).
| Station | Average Temperature (˚F) | Departure from Normal (˚F) | Total Rainfall (in.) | Departure from Normal (in.) |
| Gainesville | 82.3 | +1.0 | 10.82 | +4.42 |
| Sarasota | 83.7 | +0.3 | 23.55 | +14.44 |
| Naples | 83.8 | +2.0 | 7.43 | -3.40 |
| Fort Myers | 84.8 | +1.4 | 12.20 | +1.77 |
| West Palm Beach | 84.8 | +1.6 | 8.72 | +0.04 |
Appendix 2
Select daily record high maximum temperatures (°F) tied or broken during August (compiled from NOAA).
| Location | Date | Record | Broken/Tied | Last |
| Key West | 1 | 98 | Broken | 96 in 2022 |
| Canal Point | 2 | 98 | Broken | 97 in 1992 |
| Fort Myers | 2 | 97 | Broken | 96 in 2022 |
| Clermont | 4 | 98 | Tied | 98 in 1972 |
| Pensacola | 4 | 99 | Broken | 98 in 2023 |
| Pensacola | 5 | 100 | Broken | 97 in 1972 |
| Pensacola | 6 | 101 | Broken | 97 in 1989 |
| Apalachicola | 7 | 98 | Tied | 98 in 1999 |
| Hialeah | 8 | 96 | Broken | 95 in 1999 |
| Homestead | 8 | 97 | Broken | 96 in 2023 |
| Pensacola | 8 | 100 | Broken | 96 in 2023 |
| Pensacola | 10 | 97 | Broken | 95 in 2023 |
| Key West | 10 | 101 | Broken | 96 in 2023 |
| Fort Lauderdale | 11 | 95 | Tied | 95 in 2023 |
| Key West | 11 | 99 | Broken | 95 in 2023 |
| Naples | 12 | 98 | Broken | 96 in 1990 |
| Apalachicola | 13 | 98 | Broken | 96 in 1999 |
| Key West | 13 | 102 | Broken | 95 in 2011 |
| Apalachicola | 14 | 99 | Broken | 96 in 2011 |
| Pensacola | 14 | 100 | Broken | 96 in 1993 |
| Crestview | 14 | 101 | Broken | 99 in 2023 |
| Clermont | 15 | 99 | Broken | 98 in 2023 |
| Miami | 15 | 98 | Broken | 97 in 1995 |
| Homestead | 16 | 99 | Broken | 96 in 2023 |
| Pensacola | 18 | 101 | Broken | 97 in 1993 |
| Niceville | 19 | 99 | Broken | 97 in 1952 |
| Plant City | 19 | 100 | Broken | 98 in 2023 |
| Daytona Beach | 21 | 97 | Broken | 96 in 2014 |
| Fort Lauderdale | 21 | 97 | Broken | 93 in 2015 |
| Key West | 22 | 95 | Broken | 93 in 1995 |
| Tampa | 27 | 97 | Broken | 96 in 2023 |
| Tallahassee | 31 | 97 | Tied | 97 in 2014 |
Prepared by Florida Climate Center
The Florida State University
Tallahassee, FL
Summary:
- Average monthly temperatures in September were mostly above normal, with the exception of the western Panhandle.
- Monthly precipitation totals were mostly above normal in September, but below normal in southern Florida.
- Drought improvement occurred in the western Panhandle during September; 6% of the state was in moderate drought (D1) and 7% was abnormally dry (D0) as of September 26.
- A transition to La Niña conditions is favored during September-November (71% chance); La Niña is expected to persist through January-March 2025.
- Hurricane Helene made landfall in Florida’s Big Bend in Taylor County just southwest of Perry on the night of September 26 as a category 4 hurricane with peak winds of 140 mph. It became the third hurricane in 13 months to strike this part of the state.
Average monthly temperatures in September were mostly above normal, except in the far western Panhandle. Average monthly temperature departures from normal ranged from -1.1 ̊F in Pensacola to +2.2 ̊F in Orlando for the month (see Table 1 and Appendix 1 for select cities). South Florida was especially warm in September. September 2024 ranked as the warmest September on record for Key West (150 years), West Palm Beach (131 years), Punta Gorda (108 years), Vero Beach (81 years), and Plant City (115 years). It was the 2nd-warmest September on record for Ft. Lauderdale (103 years), Ft. Myers (122 years), and Tampa (135 years).
Table 1. September average temperatures and departures from normal ( ̊F) for selected cities.
| Station | Mean Temperature | Departure from Normal |
| Pensacola | 78.9 | -1.1 |
| Tallahassee | 80.7 | +1.6 |
| Jacksonville | 79.7 | +0.9 |
| Orlando | 83.2 | +2.2 |
| Tampa | 84.0 | +1.3 |
| Miami | 84.7 | +1.7 |
| Key West | 86.2 | +2.1 |
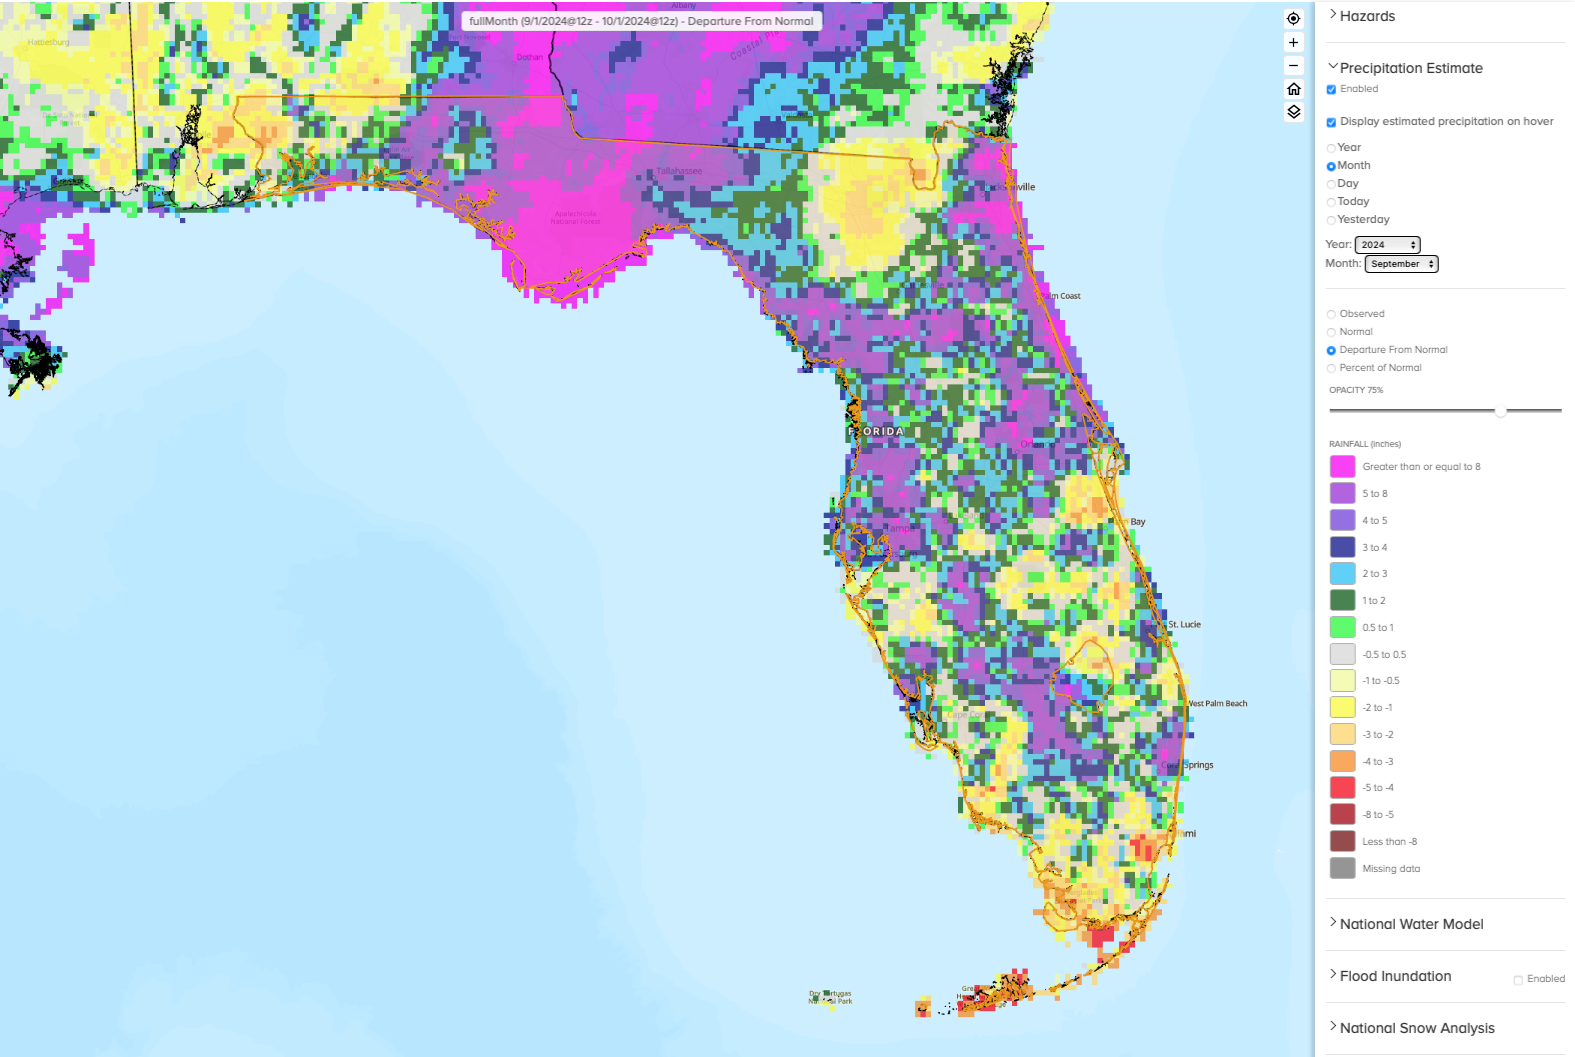
Monthly precipitation totals were mostly above normal in September, but below normal in southern Florida. The monthly precipitation departures from normal ranged from -3.90 inches in Key West to +21.61 inches in Apalachicola (see Table 2 and Appendix 1 for select locations). A stalled frontal boundary brought ample rainfall to the Florida Peninsula and Northeast Florida during the early part of the month. By the 5th, Tampa had already observed 9.23 inches of rain since the first of the month, which was the wettest on record for the September 1-5 period. The Jacksonville area observed over 10 inches of rain by September 15. Several CoCoRaHS stations across the Jacksonville and northeast coastal areas reported over 15 inches of rain during the first half of September, with a peak of 21.89 inches recorded by an observer in St. Johns County (FL-SJ-29). From September 1-15, the Jacksonville Intl AP station recorded 11.42 inches of rain, ranking 4th-wettest on record (85 years), and Daytona Beach recorded 10.97 inches of rain, which ranked as 3rd-wettest on record (88 years) for this period. For the entire month, Apalachicola recorded a total of 26.99 inches of rain, which was +21.61 inches above normal and ranked as the wettest September on record (89 years). Year-to-date rainfall in Apalachicola is now +29.18 inches above normal. Rainfall in the western Panhandle led to drought improvement during the month (see Figure 2). Below normal rainfall was observed in Miami, Naples, and the Keys.
Table 2. September precipitation totals and departures from normal (inches) for selected cities.
| Station | Total Rainfall | Departure from Normal |
| Pensacola | 8.69 | +2.08 |
| Tallahassee | 11.21 | +6.30 |
| Jacksonville | 13.53 | +5.97 |
| Orlando | 5.38 | -0.99 |
| Tampa | 13.35 | +7.26 |
| Miami | 9.11 | -1.11 |
| Key West | 3.34 | -3.90 |
Figure 1. A graphical depiction of the monthly rainfall departure from normal (inches) for September (courtesy of NOAA, NWS).
La Niña Watch.
ENSO-neutral conditions have continued in the tropical equatorial Pacific Ocean over the past month. La Niña conditions are expected to emerge during September-November 2024 (now at 71% chance) and persist through the Northern Hemisphere winter (January-March 2025). Models predict a weak and short duration La Niña event. The Climate Prediction Center’s seasonal outlook reflects equal chances of below, above, or near normal precipitation in Florida and the Southeast U.S. from October-December 2024.
Hazardous Weather Events in September.
According to the Local Storm Reports issued by the local National Weather Service offices serving Florida, there were 716 individual local reports of hazardous weather events recorded across the state during the month of September (see Table 4 for a breakdown by event type). Heavy rainfall associated with a stalled frontal boundary affected Florida in early September, generally from September 4-6. Heavy rainfall led to street flooding in Tampa and surrounding areas, as well as in Duval, St. Johns, and surrounding counties of Northeast Florida. A station in the Durbin area of St. Johns County reported 4 inches of rain in just over one hour on the 4th. On the 13-14, heavy rains and flooding impacted the Panhandle. Two-day rainfall totals in Franklin County included 12.62 inches recorded in Lanark Village, 12.23 inches on St. George Island, and 11.87 inches at the Apalachicola Airport. At the end of the month, Hurricane Helene impacted much of the state. The storm’s expansive wind field led to tropical storm force winds or greater as far as Florida’s east coast and brought major coastal flooding along the west coast of Florida and Big Bend regions. Read more about the storm below.
Table 3. Breakdown of storm reports submitted in Florida during the month of September (compiled from Iowa State University/Iowa Environmental Mesonet).
| Report Type | Number of Reports |
| Heavy Rain | 154 |
| Flood | 53 |
| Flash Flood | 54 |
| Coastal Flood | 9 |
| Hail | 0 |
| Marine Thunderstorm Wind | 9 |
| Non-Thunderstorm Wind Gust | 46 |
| Non-Thunderstorm Wind Damage | 5 |
| Tornado/Waterspout/Funnel Cloud | 0/20/10 |
| Thunderstorm Wind Damage | 6 |
| Thunderstorm Wind Gust | 62 |
| Lightning | 4 |
| Tropical Cylone | 274 |
| Storm Surge | 9 |
Weather/Climate Highlights of the Month: Hurricane Helene
Hurricane Helene made landfall as a category 4 storm southwest of Perry, FL in Taylor County on the night of September 26 with peak winds of 140 mph. The storm’s expansive wind field led to tropical storm force winds, or even higher at times, as far as Florida’s east coast, hundreds of miles away from the storm’s center.
Due to its fast forward motion (at 23 mph) and distance from the coast, Helene did not produce heavy rainfall in central or south Florida. However, the storm produced record storm surge and caused major coastal flooding along Florida’s west coast with strong onshore winds, even as the storm’s center was about 170 miles west-southwest of Tampa.
The highest rainfall totals in Florida were found along the west side of the storm’s center around landfall in North Florida, with peak rainfall just west of Tallahassee. Rainfall totals were 6-12 inches in the Panhandle and much higher further north into Georgia and the Appalachians, where the storm’s moisture was amplified by uplift from the mountainous terrain and precursor rainfall from a stalled cold front.
Helene’s development and intensification in the Gulf of Mexico was aided by above normal water temperatures in the Gulf of Mexico, low atmospheric wind shear, and its track over the Gulf loop current which is an area of very warm waters. These factors led to rapid intensification, as the storm intensified from a Category 1 to a Category 4 hurricane on Thursday prior to landfall that night.
Helene became the 3rd hurricane in 13 months to make landfall in the Big Bend region, following Hurricanes Idalia in August 2023 (category 3) and Debby in August 2024 (category 1). It was the 7th hurricane to make landfall in the Panhandle or Big Bend in the past 9 years since 2016.
Drought-Related Impacts.
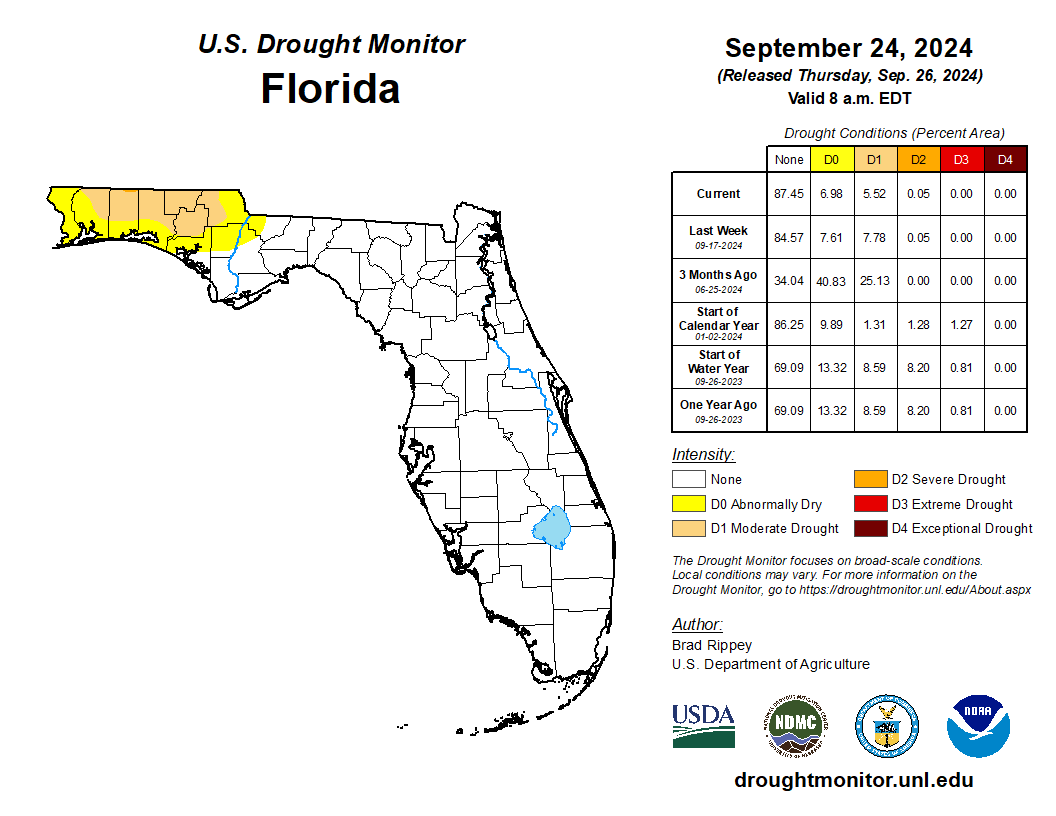
By mid-September, about 8% of the state was experiencing moderate drought (D1) and 8% was abnormally dry (D0), according to the U.S. Drought Monitor. By the end of the month, drought improved slightly with 5.5% of the state in moderate drought (D1) and 7% abnormally dry (D0) (Figure 2 below).
As of September 30, the Lake Okeechobee water level was 15.33 ft. above sea level (Feet-NGVD29), which is above average for this time of year. At the first of the month, the water level was 14.28 ft. above sea level.
Figure 2. A graphical depiction of the latest drought conditions in Florida according to the U.S. Drought Monitor (courtesy of the National Drought Mitigation Center, University of Nebraska-Lincoln).
Agriculture-Related Impacts.
Following a wet summer, September brought more rain to much of Florida and wet conditions have led to crop damages. In mid-September, topsoil moisture conditions were adequate in 66% of the state, short in 7%, and very short in 2% of the state, while 25% of the state had surplus topsoil moisture conditions. By the end of September, topsoil moisture conditions were adequate in 48% of the state, short in 8%, and very short in 3% of the state; surplus topsoil moisture conditions increased to 41% of the state. For more information, consult the Crop Progress and Conditions report, which is published by the USDA’s National Agricultural Statistics Service.
Appendix 1
Additional September departures from normal data for select Florida locations (Source: NWS).
| Station | Average Temperature (˚F) | Departure from Normal (˚F) | Total Rainfall (in.) | Departure from Normal (in.) |
| Apalachicola | 80.4 | +1.2 | 26.99 | +21.61 |
| Gainesville | 79.4 | +0.6 | 7.61 | +2.56 |
| Sarasota | 83.1 | +0.9 | 7.50 | +1.50 |
| Naples | 84.3 | +1.9 | 6.24 | -2.36 |
| Fort Myers | 84.4 | +2.2 | 10.84 | +1.84 |
| West Palm Beach | 84.4 | +2.5 | 11.20 | +3.24 |
Prepared by Florida Climate Center
The Florida State University
Tallahassee, FL
Summary:
- Average monthly temperatures in November were above normal.
- Monthly precipitation totals were generally below normal, except in portions of the Panhandle.
- Drought developed in the Panhandle during the month; approximately 16% of the state was in moderate drought (D1) and 52% was abnormally dry (D0) by the end of the month.
- A transition to La Niña conditions is expected soon (57% chance). It is expected to persist through January – March 2025 and will likely be a weak event.
Average monthly temperatures in November were above normal in Florida. Average monthly temperature departures from normal ranged from +1.4 ̊F in Key West to +8.0 ̊F in Tallahassee for the month (see Table 1 and Appendix 1 for select cities). Following a near average October, temperatures in November were well above normal for the month. Monthly mean temperatures were +6-8 ̊F above normal across the Panhandle and North Florida. Apalachicola and Crestview recorded their warmest November on record, while Tallahassee and Pensacola had their 2nd-warmest November on record. In addition, stations across the Peninsula experienced one of their top 10 warmest Novembers on record. There were 187 total daily high minimum temperature records broken during the month; select daily high maximum temperature records tied or broken this month are provided in Appendix 2.
Table 1. November average temperatures and departures from normal ( ̊F) for selected cities.
| Station | Mean Temperature | Departure from Normal |
| Pensacola | 67.5 | +6.1 |
| Tallahassee | 68.2 | +8.0 |
| Jacksonville | 67.8 | +5.5 |
| Orlando | 71.4 | +3.2 |
| Tampa | 73.0 | +3.2 |
| Miami | 76.8 | +2.0 |
| Key West | 78.0 | +1.4 |
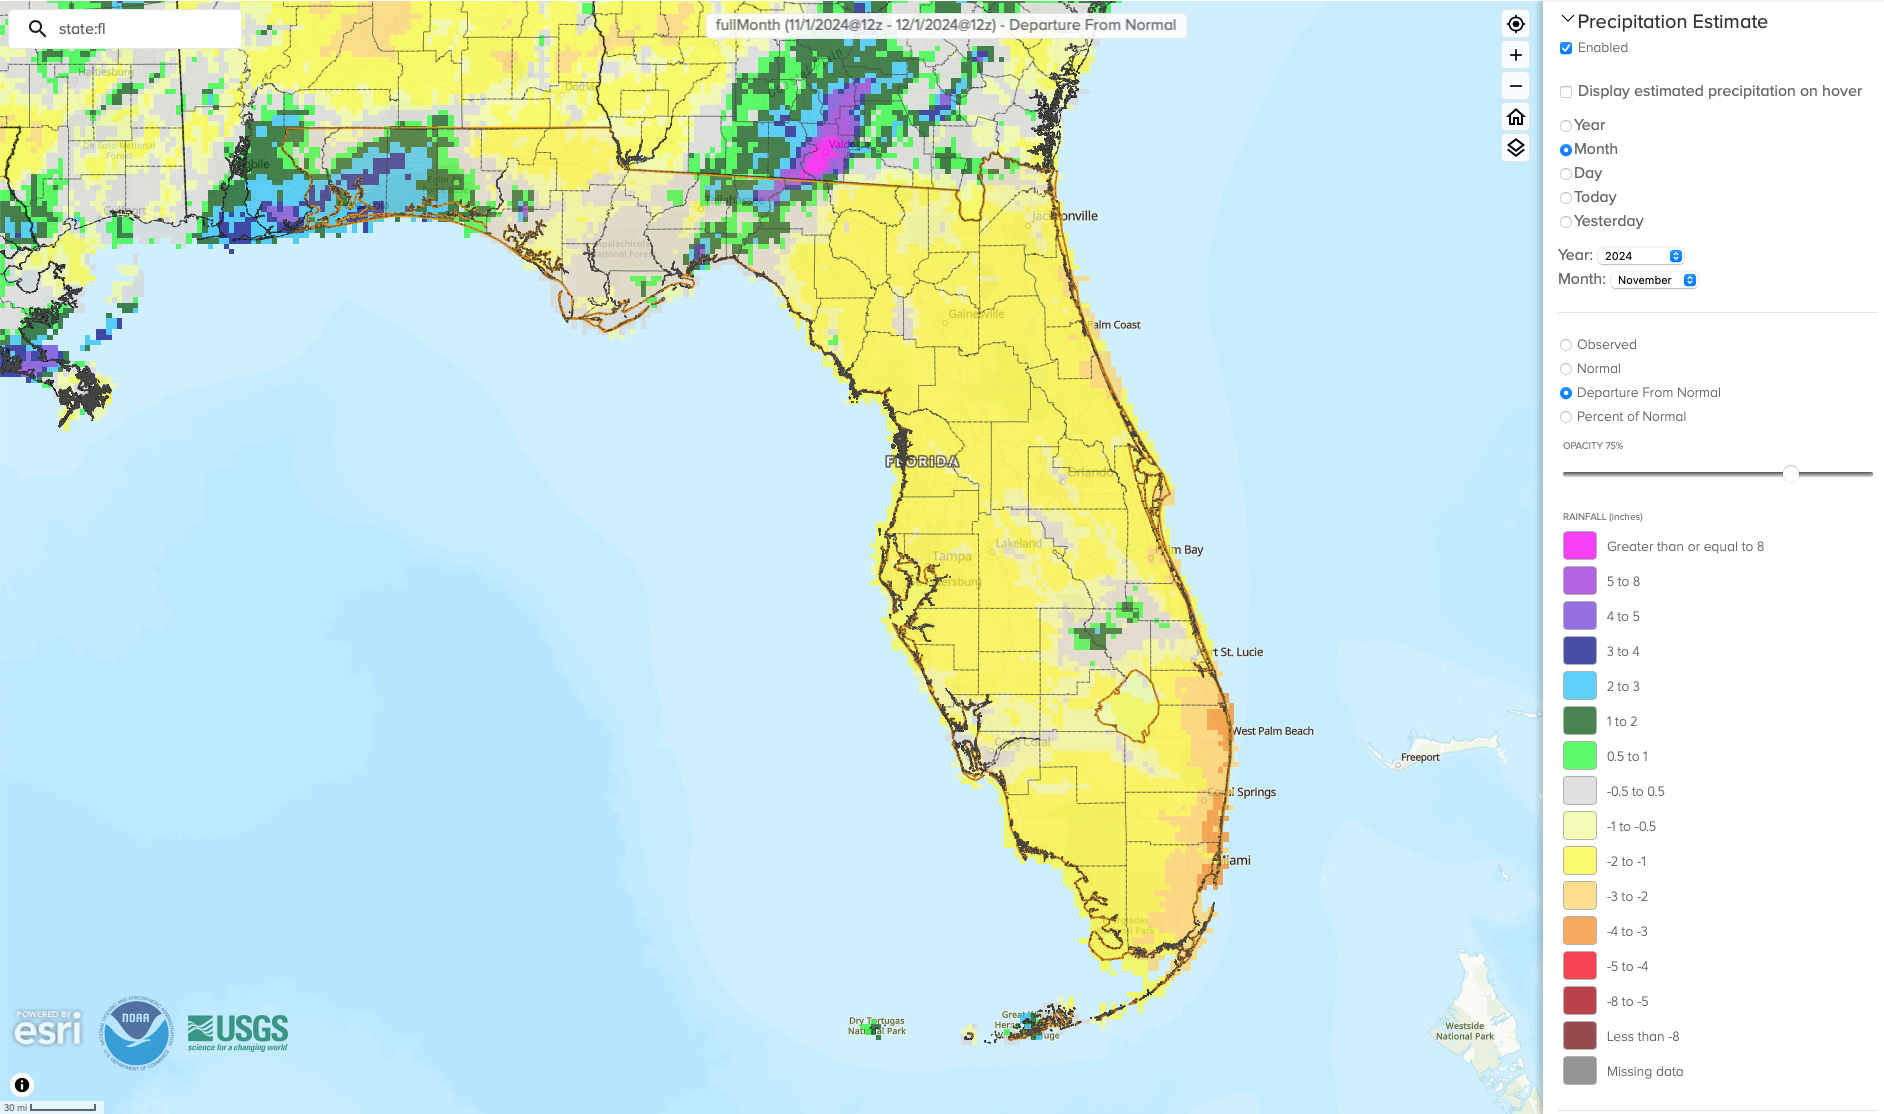
Monthly precipitation totals were generally below normal, with few exceptions that include the western Panhandle and the Keys. The monthly precipitation departures from normal ranged from -3.49 inches in West Palm Beach to +2.21 inches in Pensacola (see Table 2 and Appendix 1 for select locations). While November is typically a dry month in Florida, warmer than normal temperatures and little rainfall led to drought development in the Panhandle and in northeast Florida by the end of the month. Abnormally dry conditions developed in Southeast Florida where rainfall deficits were more than 3 inches (Figure 2).
Table 2. November precipitation totals and departures from normal (inches) for selected cities.
| Station | Total Rainfall | Departure from Normal |
| Pensacola | 6.63 | +2.21 |
| Tallahassee | 2.88 | -0.22 |
| Jacksonville | 1.44 | -0.56 |
| Orlando | 0.60 | -1.19 |
| Tampa | 1.94 | +0.54 |
| Miami | 0.47 | -3.06 |
| Key West | 3.16 | +1.11 |
Figure 1. A graphical depiction of the monthly rainfall departure from normal (inches) for November (courtesy of NOAA, NWS).
La Niña Watch.
ENSO-neutral conditions have continued in the tropical equatorial Pacific Ocean with overall near-average sea surface temperatures in the central and eastern equatorial Pacific Ocean. The latest weekly Niño indices ranged from +0.2 ̊C (Niño-4) to -0.3 ̊C (Niño-3.4). La Niña conditions are expected to emerge soon in December 2024 (now a 57% chance) and persist through January-March 2025. It is favored to be a weak La Niña event, with a less than 25% chance it would be a moderate event (SST anomaly >= 1 ̊C), according to the Climate Prediction Center.
Hazardous Weather Events in November.
According to the Local Storm Reports issued by the local National Weather Service offices serving Florida, there were 53 individual local reports of hazardous weather events recorded across the state during the month of November (see Table 3 for a breakdown by event type). Wind gusts of 40-66 mph were felt in the Keys from the passing of Hurricane Rafael to the south and west. Rafael made landfall in western Cuba on November 6 as a category 3 hurricane. High wind gusts of 40-55 mph were also reported across the Panhandle on November 19-20 associated with a passing frontal boundary.
Table 3. Breakdown of storm reports submitted in Florida during the month of November (compiled from Iowa State University/Iowa Environmental Mesonet).
| Report Type | Number of Reports |
| Heavy Rain | 1 |
| Flood | 0 |
| Flash Flood | 0 |
| Coastal Flood | 1 |
| Marine Thunderstorm Wind | 15 |
| Non-Thunderstorm Wind Gust | 18 |
| Non-Thunderstorm Wind Damage | 1 |
| Tornado/Waterspout/Funnel Cloud | 0/0/0 |
| Thunderstorm Wind Damage | 0 |
| Thunderstorm Wind Gust | 0 |
| Tropical Cylone | 15 |
| Storm Surge | 0 |
| Rip Currents | 2 |
Daily Record Events in November.
Table 4. Summary of daily records broken or set in Florida in November (source: NCEI Daily Weather Records).
| Category | Number of Records |
| Highest daily max. temp. | 31 |
| Highest daily min. temp. | 187 |
| Lowest daily max. temp. | 0 |
| Lowest daily min. temp. | 0 |
| Highest daily precipitation | 15 |
| Total | 233 |
Drought-Related Impacts.
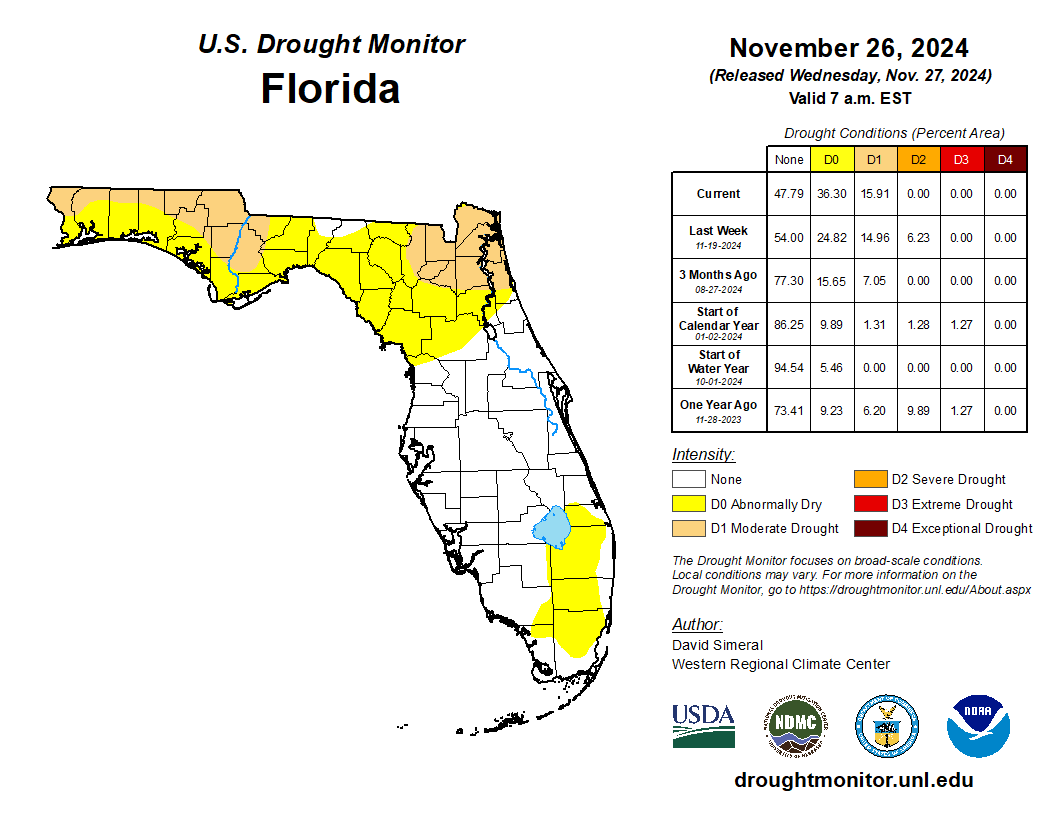
In mid-November, about 1.6% of the state was in severe drought (D2), 16% was in moderate drought (D1), and about 25% was abnormally dry (D0), according to the U.S. Drought Monitor. By the end of the month, moderate drought (D1) affected about 16% of the state and 36% of the state was abnormally dry (D0) (Figure 2 below).
As of November 30, the Lake Okeechobee water level was 15.78 ft. above sea level (Feet-NGVD29), which is above average for this time of year. At the first of the month, the water level was 16.10 ft. above sea level.
Figure 2. A graphical depiction of the latest drought conditions in Florida according to the U.S. Drought Monitor (courtesy of the National Drought Mitigation Center, University of Nebraska-Lincoln).
Agriculture-Related Impacts.
Following tropical rainfall earlier in the season, drying conditions set in and persisted during the month of November. In mid-November, topsoil moisture conditions were adequate in 62% of the state, short in 25%, and very short in 10% of the state, while 3% of the state had surplus topsoil moisture conditions. Near the end of November, topsoil moisture conditions were adequate in 57% of the state, short in 30%, and very short in 10% of the state, while 3% had surplus topsoil moisture conditions. For more information, consult the Crop Progress and Conditions report, which is published by the USDA’s National Agricultural Statistics Service.
Appendix 1
Additional November departures from normal data for select Florida locations (Source: NWS).
| Station | Average Temperature (˚F) | Departure from Normal (˚F) | Total Rainfall (in.) | Departure from Normal (in.) |
| Gainesville | 66.6 | +3.9 | 0.17 | -1.62 |
| Sarasota | 72.8 | +2.7 | 0.13 | -1.68 |
| Melbourne | 71.4 | +2.4 | 1.42 | -1.113 |
| Fort Myers | 74.0 | +2.5 | 2.20 | +0.42 |
| West Palm Beach | 75.0 | +2.0 | 0.13 | -3.49 |
Appendix 2
Select daily record high maximum temperatures (°F) tied or broken during November 2024 (compiled from NOAA).
| Location | Date | Record | Broken/Tied | Last |
| Tallahassee | 1 | 88 | Tied | 88 in 2016 |
| Venice | 3 | 89 | Tied | 89 in 2022 |
| Tampa | 3 | 88 | Tied | 88 in 2022 |
| Tallahassee | 5 | 89 | Broken | 88 in 2015 |
| Chipley | 6 | 87 | Broken | 86 in 2015 |
| Tarpon Springs | 6 | 91 | Broken | 90 in 1935 |
| Tampa | 6 | 91 | Broken | 90 in 2015 |
| Apalachicola | 7 | 85 | Broken | 84 in 2003 |
| Bradenton | 7 | 90 | Tied | 90 in 1996 |
| Fernandina Beach | 7 | 88 | Broken | 85 in 2003 |
| Jacksonville | 7 | 87 | Tied | 87 in 2003 |
| Cross City | 8 | 89 | Broken | 87 in 2003 |
| Tampa | 8 | 89 | Broken | 88 in 2015 |
| Cross City | 11 | 89 | Broken | 86 in 1986 |
| Niceville | 11 | 84 | Broken | 83 in 2020 |
| Ochopee | 11 | 92 | Broken | 91 in 2015 |
| Clermont | 12 | 89 | Tied | 89 in 2023 |
| Venice | 12 | 89 | Tied | 89 in 2023 |
| Tampa | 12 | 89 | Broken | 88 in 2023 |
| Fernandina Beach | 13 | 85 | Broken | 84 in 2008 |
| Tallahassee | 13 | 85 | Broken | 83 in 2005 |
| Fernandina Beach | 15 | 86 | Broken | 84 in 1955 |
| Pensacola | 18 | 82 | Broken | 80 in 2021 |
| Fernandina Beach | 21 | 89 | Broken | 83 in 1962 |
| Fort Lauderdale | 22 | 86 | Broken | 85 in 2015 |
| Fernandina Beach | 23 | 88 | Broken | 85 in 1948 |
| Crestview | 25 | 81 | Broken | 80 in 2001 |
| Homestead | 30 | 90 | Broken | 88 in 1997 |
Building A, Suite 292
Tallahassee, FL 32306-2741
Phone: (850) 644-3417 | (850) 644-0719
climate@coaps.fsu.edu