


The Florida Climate Center serves as the primary resource for climate data, information, and services in the state of Florida.

The Florida Climate Center achieves its mission by providing climate monitoring, research, and expertise to be applied by the people, institutions, and businesses of Florida and the surrounding region.
We provide direct service by fulfilling requests for climate and weather data and information in a variety of formats.
We perform research that advances the understanding of the climate variability and changes of Florida and the surrounding region.
We provide outreach in presentations and at events aimed at a variety of groups, interests, and ages.
Prepared by Florida Climate Center
The Florida State University
Tallahassee, FL

Summary:
- Average monthly temperatures in March were above normal.
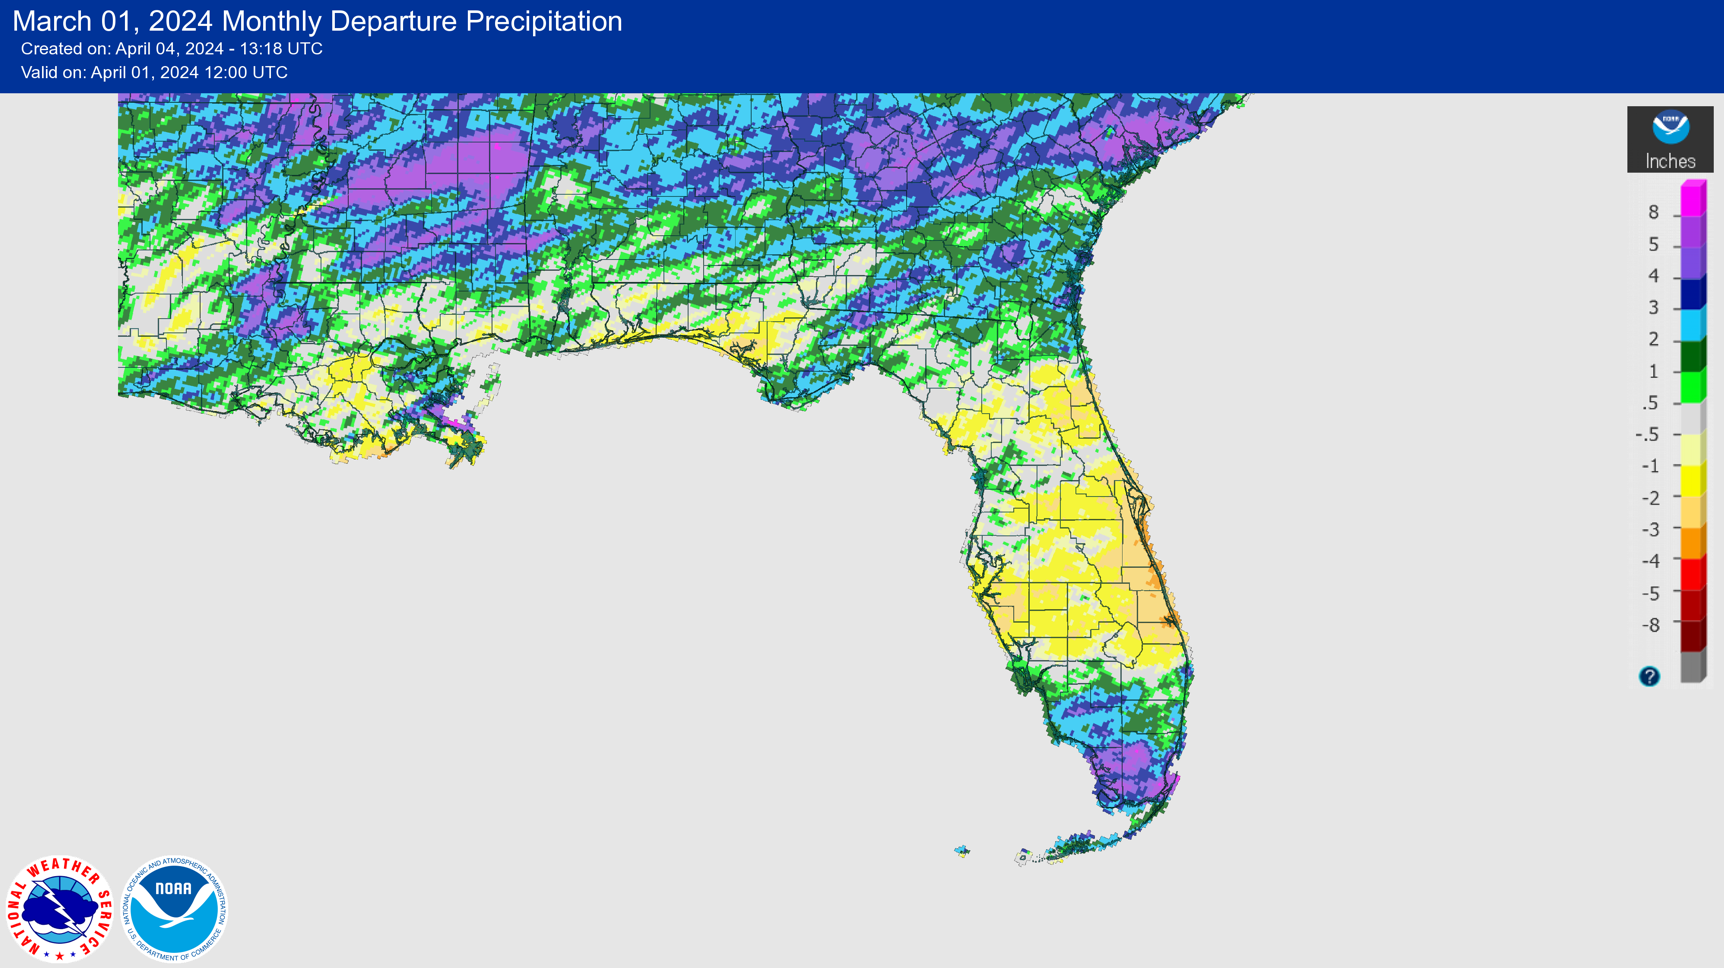
- Monthly precipitation totals in March were variable, with above normal rainfall in South Florida and parts of North Florida, while central Florida and parts of the Panhandle had below normal rainfall.
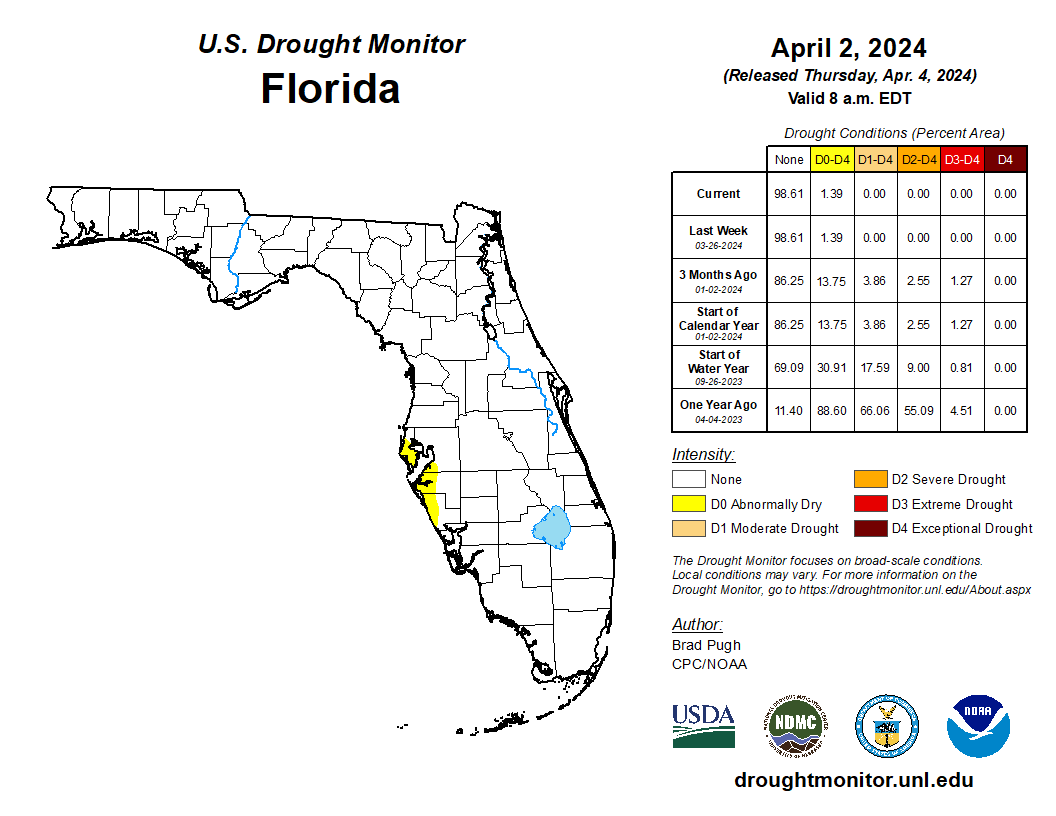
- Florida remained drought free in March, with abnormally dry conditions lingering in coastal west-central Florida.
- A transition to ENSO-neutral conditions is expected April-June 2024 (83% chance), with a good chance of a transition to La Niña during August-October (82% chance).
Average monthly temperatures in March were above normal. Average temperature departures from normal ranged from +0.7 ̊F in Pensacola to +4.4 ̊F in Orlando for the month (see Table 1 and Appendix 1 for select cities). Southern and central Florida were the warmest areas of the state in March; Key West and Ft. Lauderdale had their 3rd-warmest March on record, and March 2024 ranked in the top five warmest on record for several other locations. Several daily high maximum and high minimum temperature records were broken during the month.
Table 1. March average temperatures and departures from normal ( ̊F) for selected cities.
| Station | Mean Temperature | Departure from Normal |
| Pensacola | 63.0 | +0.7 |
| Tallahassee | 64.9 | +3.5 |
| Jacksonville | 65.5 | +3.1 |
| Orlando | 71.7 | +4.4 |
| Tampa | 71.7 | +3.1 |
| Miami | 75.8 | +2.7 |
| Key West | 77.6 | +3.2 |
Monthly rainfall totals in March were variable across Florida. The monthly precipitation departures from normal ranged from -1.64 inches in Orlando to +3.40 inches in Key West (see Table 2 and Appendix 1 for select locations). Areas that received the most rainfall during the month were in South Florida and around Apalachicola in the Panhandle. The driest areas of the state were in east-central Florida. While this year’s El Niño has brought ample rainfall in Florida, we have not seen as much rain compared with past strong El Niño events.
Table 2. March precipitation totals and departures from normal (inches) for selected cities.
| Station | Total Rainfall | Departure from Normal |
| Pensacola | 5.25 | 0.00 |
| Tallahassee | 7.67 | +2.43 |
| Jacksonville | 5.69 | +2.40 |
| Orlando | 1.39 | -1.64 |
| Tampa | 2.57 | +0.05 |
| Miami | 4.78 | +2.32 |
| Key West | 4.39 | +3.40 |
Figure 1. A graphical depiction of the monthly rainfall departure from normal (inches) for March (courtesy of NOAA, NWS).
El Niño Advisory.
El Niño conditions, the warm phase of the El Niño Southern Oscillation climate pattern in the tropical equatorial Pacific Ocean, continued but the coupled ocean-atmosphere system reflects a weakening El Niño. A transition to ENSO-neutral conditions is expected this spring during April-June 2024 (83% chance). There are increasing chances of a La Niña developing during June-August (62% chance), which increases to 82% during August-October 2024.
Hazardous Weather Events in March.
According to the Local Storm Reports issued by the local National Weather Service offices serving Florida, there were 226 individual local reports of hazardous weather events recorded across the state during the month of March (see Table 4 for a breakdown by event type). Storms in late March moved through the panhandle, with 2-inch sized hail reported in Gulf County and over 9 inches of rain reported at Lake Lamonia in Leon County. One fatality occurred due to rip currents in Panama City.
Table 3. Breakdown of storm reports submitted in Florida during the month of March (compiled from Iowa State University/Iowa Environmental Mesonet).
| Report Type | Number of Reports |
| Heavy Rain | 23 |
| Flood | 4 |
| Flash Flood | 2 |
| Coastal Flood | 0 |
| Hail | 38 |
| Marine Thunderstorm Wind | 10 |
| Non-Thunderstorm Wind Gust | 80 |
| Non-Thunderstorm Wind Damage | 0 |
| Tornado/Waterspout/Funnel Cloud | 1/1/2 |
| Thunderstorm Wind Damage | 7 |
| Thunderstorm Wind Gust | 55 |
| Rip Currents | 1 |
| Lightning | 2 |
Daily Record Events in March.
Table 4. Summary of daily records broken or set in Florida in March (source: NCEI Daily Weather Records).
| Category | Number of Records |
| Highest daily max. temp. | 21 |
| Highest daily min. temp. | 38 |
| Lowest daily max. temp. | 1 |
| Lowest daily min. temp. | 1 |
| Highest daily precipitation | 24 |
| Total | 85 |
Weather/Climate Highlights of the Month: Early hurricane season forecasts predict an extremely active Atlantic hurricane season this year.
Colorado State University recently released its April forecast for the 2024 Atlantic hurricane season, which calls for a near-record active hurricane season with 23 named storms, 11 hurricanes, and 5 major hurricanes. Accumulated cyclone energy, a measure of the overall energy from all named systems during the season, is predicted to be 210, or 171% of average. The likelihood of a transition to La Nina conditions in the eastern tropical Pacific Ocean around the time of peak hurricane season in combination with record warm ocean temperatures in the tropical and subtropical Atlantic and Gulf of Mexico regions are the main driving factors behind predictions for a hyperactive season. More information can be found on the CSU seasonal hurricane forecasting page: https://tropical.colostate.edu/forecasting.html
Drought-Related Impacts.
Ample rainfall over the past few months has led to drought removal in Florida. During mid-March, approximately 1.4% of the state had abnormally dry (D0) conditions and this had not changed by the end of the month, according to the U.S. Drought Monitor (see Figure 3 below).
As of March 31, the Lake Okeechobee water level was 15.22 ft. above sea level (Feet-NGVD29), which is above average for this time of year. At the first of the month, the water level was 16.15 ft. above sea level.
Figure 2. A graphical depiction of the latest drought conditions in Florida according to the U.S. Drought Monitor (courtesy of the National Drought Mitigation Center, University of Nebraska-Lincoln).
Agriculture-Related Impacts.
Average temperatures were above normal for the month, and a late March frost in northern parts of the state was not severe with only limited damage observed. Rainfall was variable during the month, but much of the state received moderate to heavy amounts of rainfall. Warmer temperatures and rainfall improved pasture and range conditions since February. Overall cattle remained in fair to good condition. Heavy rain, wind, and hail in west-central Florida caused total crop loss for some strawberry and melon producers. Sugarcane operations are near completion, and citrus has started to bloom. Other crops planted and harvested include tomatoes, sweet corn, squash, peppers, avocado, and other tropical fruits. For more information, consult the Crop Progress State Stories, which is published by the USDA’s National Agricultural Statistics Service December through March.
Appendix 1
Additional March departures from normal data for select Florida locations (Source: NWS).
| Station | Average Temperature (˚F) | Departure from Normal (˚F) | Total Rainfall (in.) | Departure from Normal (in.) |
| Gainesville | 65.8 | +3.1 | 3.20 | -0.29 |
| Ocala | 69.2 | +3.9 | 4.27 | +0.59 |
| Sarasota | 71.9 | +3.8 | 1.04 | -1.81 |
| Naples | 73.9 | +3.6 | 5.34 | +3.46 |
| Fort Myers | 73.6 | +3.3 | 2.80 | +0.73 |
| West Palm Beach | 74.3 | +3.2 | 8.01 | +4.70 |
Prepared by Florida Climate Center
The Florida State University
Tallahassee, FL
Key Points:
- July 2023 was the hottest July on record for many stations, and July 2023 became the hottest month ever recorded at several stations.
- July 2023 tied June 1998 as the hottest month ever in Florida.
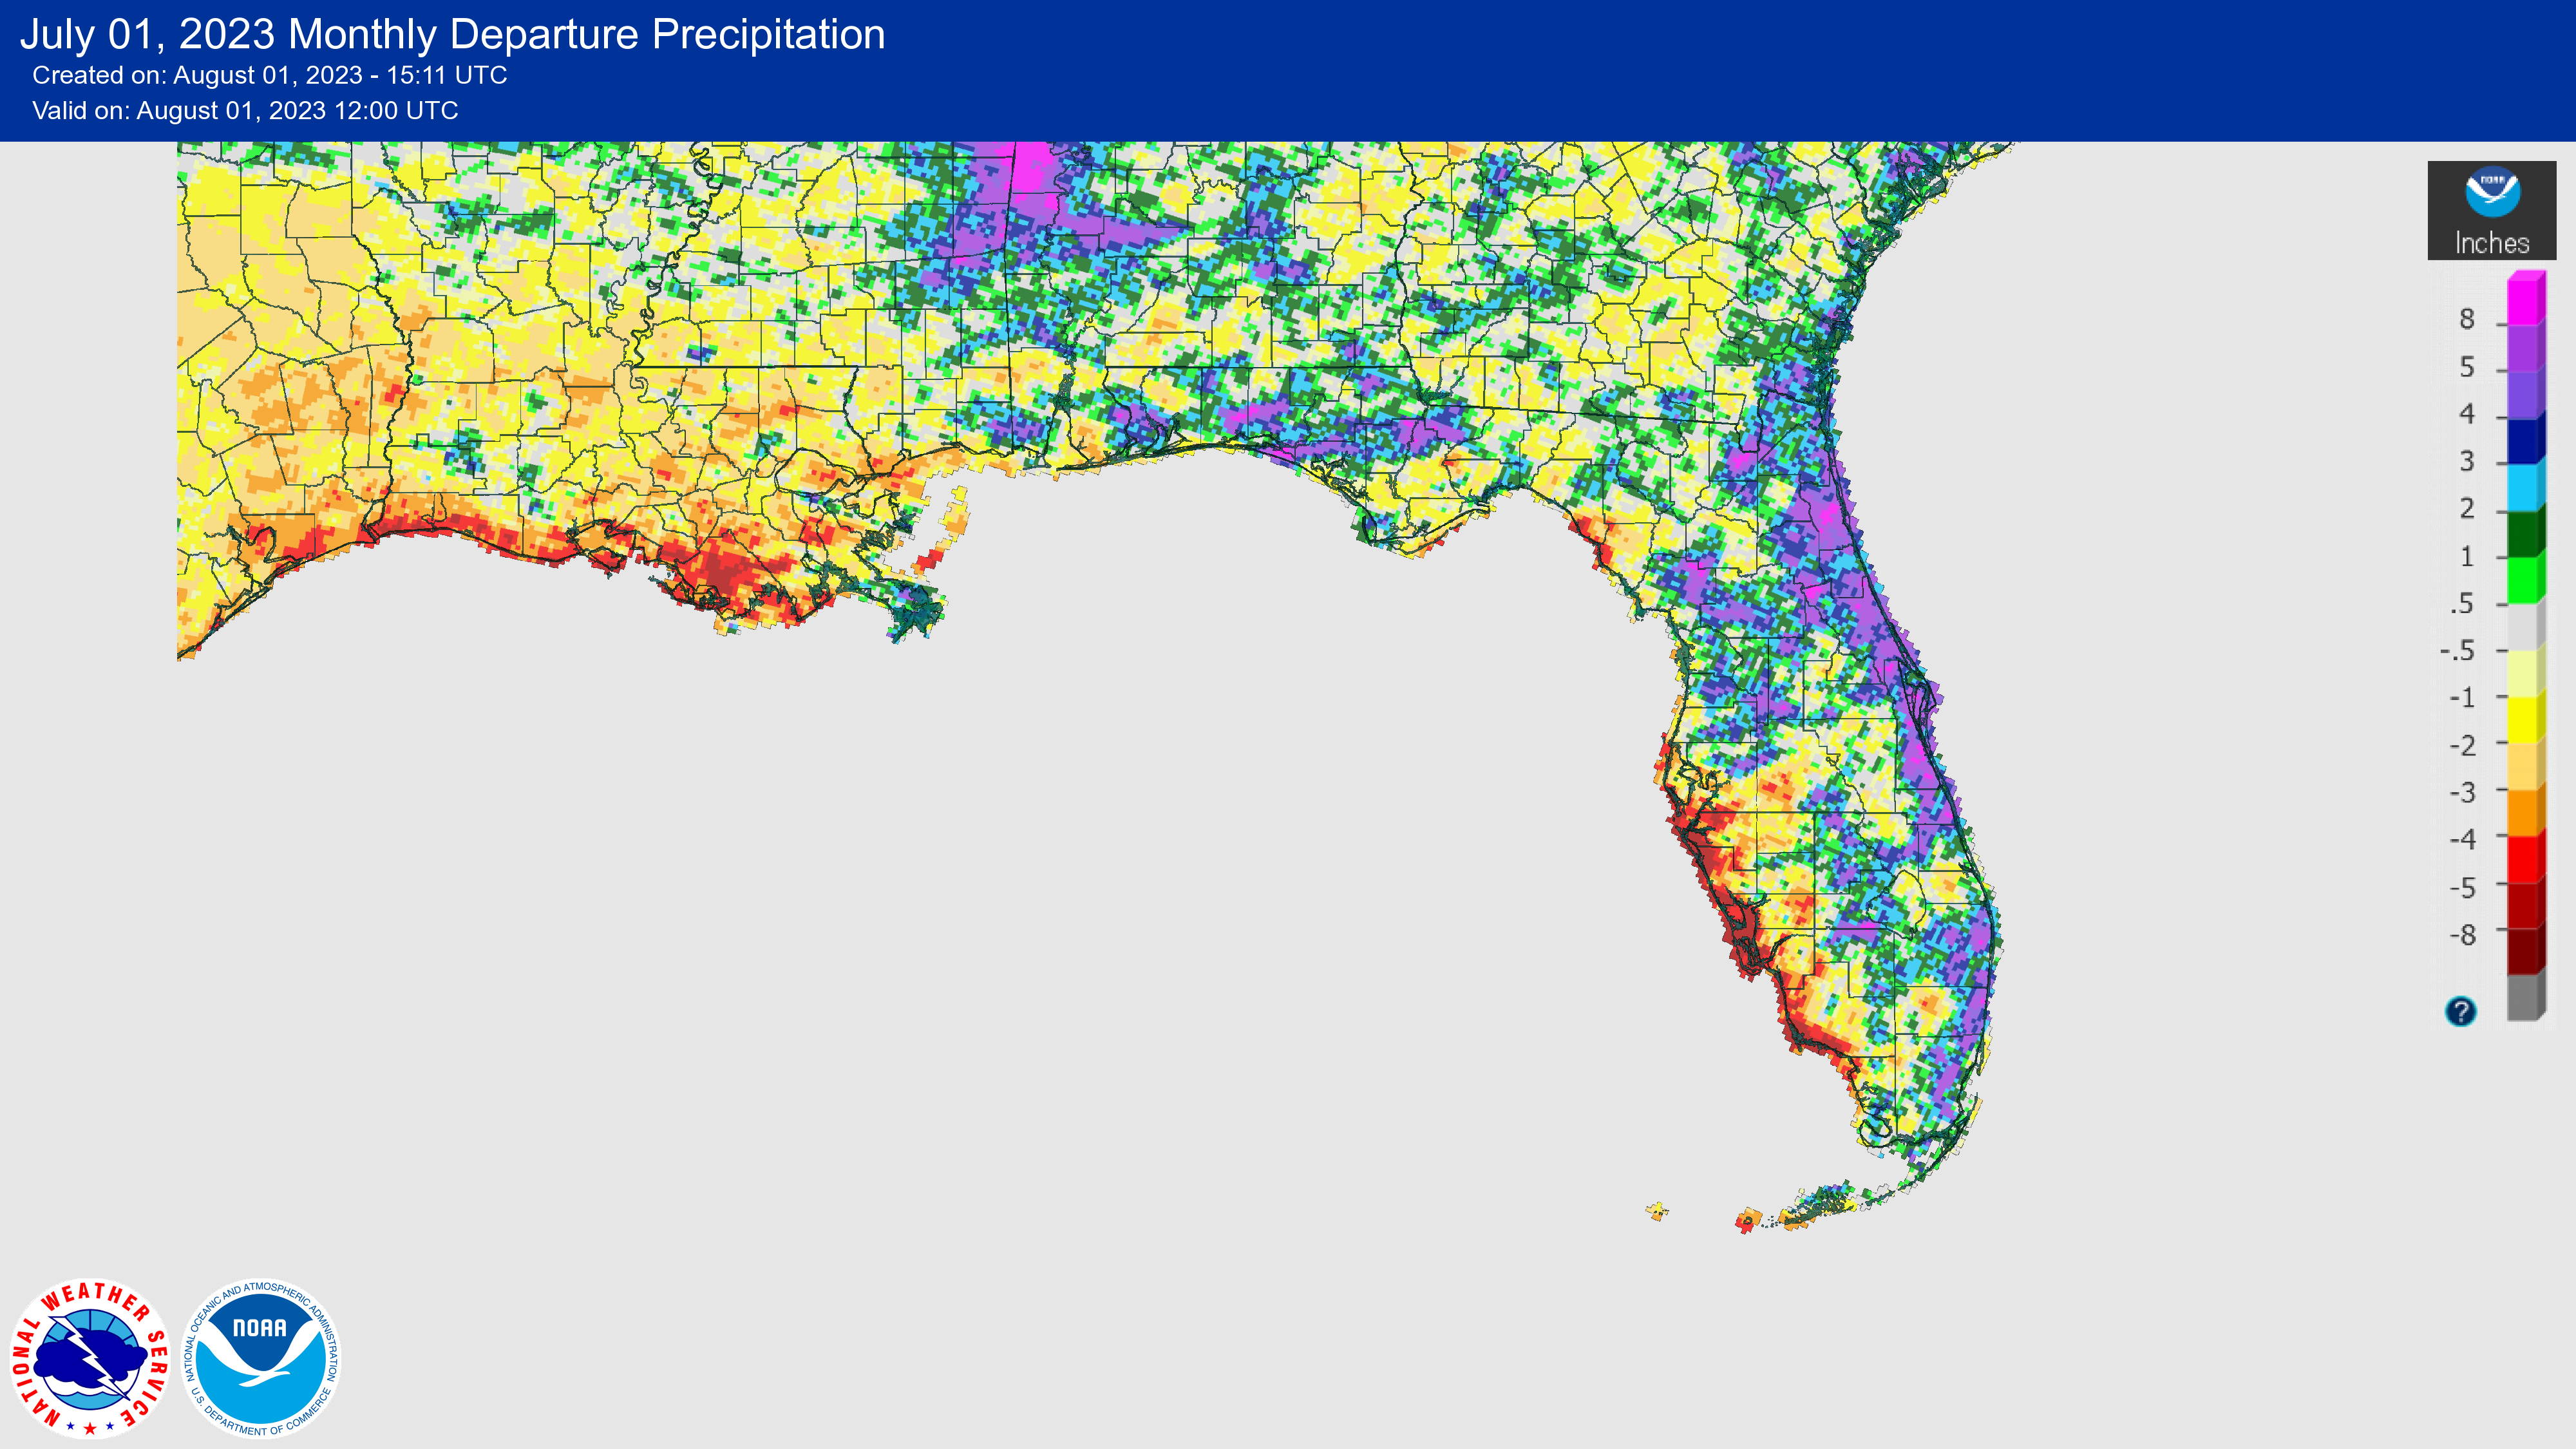
- Monthly precipitation totals for July were above normal across the eastern coast but well below normal along the west Florida coast.
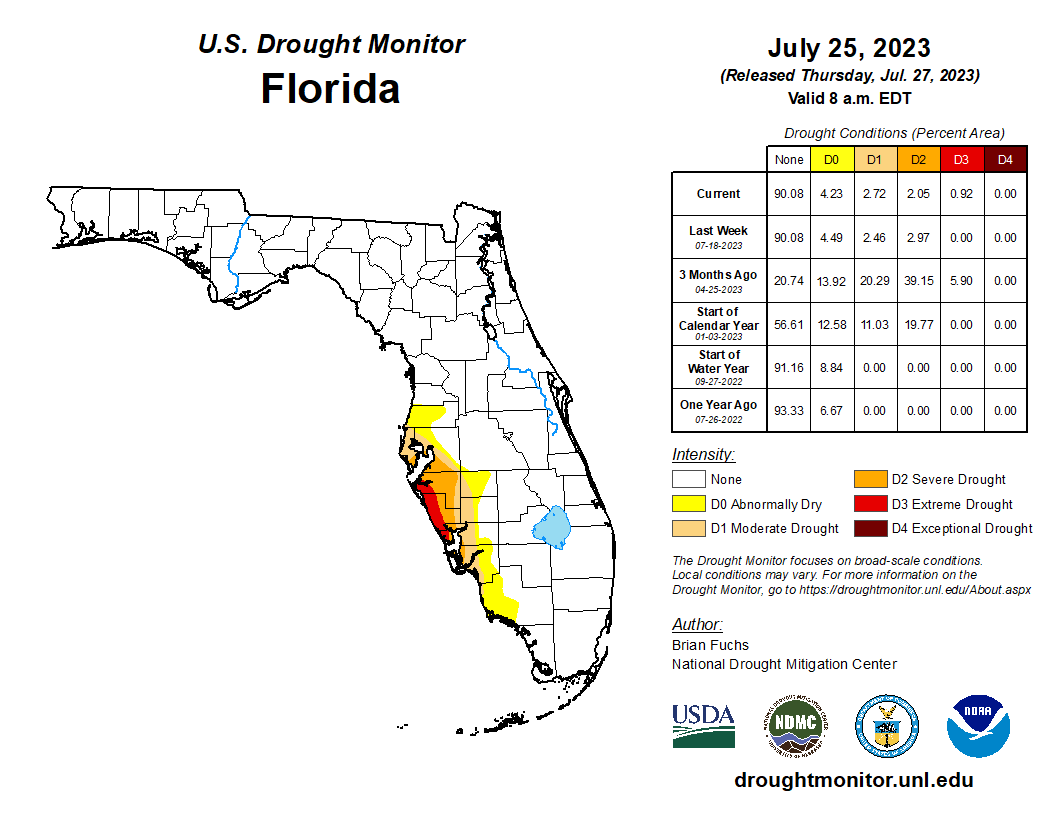
- Extreme drought was reintroduced to the Florida west coast by the end of the month, with continued below-normal rainfall.
- An El Niño Advisory continues and has a 90% chance of persisting through the Northern Hemisphere winter, peaking with moderate to strong intensity.
Average monthly temperatures in July were above normal across the state. Average temperature departures from normal ranged from +0.7 ̊F in Melbourne to +3.0 ̊F in Sarasota for the month (see Table 1 and Appendix 1 for select cities). High temperatures and oppressive humidity affected much of the state. Triple digit temperatures were reached in several locations, such as Tallahassee on the 1st and 21st (100 ̊F) and on the 30th (101 ̊F), and Clermont on the 4th (102 ̊F) and 5th (101 ̊F). Most places statewide saw one of their top 5 hottest Julys on record, and several locations observed their hottest July on record, based on monthly average temperatures, including Pensacola, Jacksonville, Tampa, Sarasota, Vero Beach, Fort Myers, Naples, Miami, and Key West. South Florida experienced record-breaking heat indices, with Miami reaching a heat index over 110 ̊F on both the 9th and 10th, as well as a record 46 consecutive days with a heat index above 100 ̊F. In addition, not only was July 2023 the hottest July on record for Miami, it was the hottest month ever recorded at the Miami International Airport station, since 1937. July 2023 also tied June 1998 as Florida's hottest month ever, based on statewide monthly average temperatures. Select daily high maximum temperature records tied or broken during the month are provided in Appendix 2.
Table 1. July average temperatures and departures from normal ( ̊F) for selected cities.
| Station | Mean Temperature | Departure from Normal |
| Pensacola | 85.5 | +2.0 |
| Tallahassee | 84.6 | +2.1 |
| Jacksonville | 84.7 | +2.2 |
| Orlando | 84.9 | +2.3 |
| Tampa | 86.5 | +2.7 |
| Miami | 86.5 | +2.4 |
| Key West | 87.7 | +2.3 |
Monthly rainfall totals in July were near to above normal in the Panhandle and eastern Florida, while the western coast was well below normal. The monthly precipitation departures from normal ranged from -6.29 inches in Sarasota to +5.91 inches in West Palm Beach (see Table 2 and Appendix 1 for select locations). July saw plentiful rainfall, but much of the rain was confined to the eastern coast and the Panhandle. Indeed, July became a tale of two Peninsulas – plentiful rainfall in the east and much below normal rainfall along the west coast. The Sarasota-Bradenton area had its 2nd-driest July on record, and Naples had its 3rd-driest July on record. Melbourne had its 2nd-wettest July on record, Vero Beach was 3rd-wettest, and Fort Lauderdale had its 5th-wettest July on record. Fort Lauderdale has had its wettest year on record to date, while the Sarasota-Bradenton area has had its driest year on record so far, where the year-to-date rainfall deficit stands at 20.68 inches.
Table 2. July precipitation totals and departures from normal (inches) for selected cities.
| Station | Total Rainfall | Departure from Normal |
| Pensacola | 6.99 | -0.90 |
| Tallahassee | 6.41 | -0.73 |
| Jacksonville | 7.93 | +1.16 |
| Orlando | 6.82 | -0.64 |
| Tampa | 2.84 | -4.91 |
| Miami | 7.42 | +0.06 |
| Key West | 1.46 | -2.17 |
Figure 1. A graphical depiction of the monthly rainfall departure from normal (inches) for July (courtesy of NOAA, NWS).
El Niño Advisory.
Weak El Niño conditions, the warm phase of the El Niño Southern Oscillation climate pattern, in the tropical equatorial Pacific Ocean continued in July. El Niño is still expected to persist through the Northern Hemisphere winter 2023-24 (90% chance). Forecasters favor continued growth of El Niño through the fall, peaking this winter with moderate-to-strong intensity (81% chance of November-January Niño-3.4 ≥ 1.0°C). However, a strong El Niño, with seasonally averaged Niño-3.4 values equal to or greater than 2.0°C (rivaling the winters of 1997-98 or 2015-16), has only a 20% chance of occurring.
Hazardous Weather Events in July.
According to the Local Storm Reports issued by the local National Weather Service offices serving Florida, there were 595 individual local reports of hazardous weather events recorded across the state during the month of July (see Table 4 for a breakdown by event type). July saw active weather with heavy rain, thunderstorm activity, and strong wind gusts. Three fatalities occurred during the month due to rip currents. No tornadoes were reported during the month.
Table 3. Breakdown of storm reports submitted in Florida during the month of July (compiled from Iowa State University/Iowa Environmental Mesonet).
| Report Type | Number of Reports |
| Heavy Rain | 37 |
| Flood | 10 |
| Flash Flood | 22 |
| Coastal Flood | 0 |
| Hail | 13 |
| Lightning | 4 |
| Non-Thunderstorm Wind Gust | 9 |
| Non-Thunderstorm Wind Damage | 0 |
| Tornado/Waterspout/Funnel Cloud | 0/17/2 |
| Thunderstorm Wind Damage | 120 |
| Thunderstorm Wind Gust | 351 |
| Rip Currents | 10 |
Daily Record Events in July.
Table 4. Summary of daily records broken or set in Florida in July (source: NCEI Daily Weather Records).
| Category | Number of Records |
| Highest daily max. temp. | 72 |
| Highest daily min. temp. | 89 |
| Lowest daily max. temp. | 6 |
| Lowest daily min. temp. | 2 |
| Highest daily precipitation | 39 |
| Total | 208 |
Weather/Climate Highlight of the Month: Extreme Heat
July 2023 was the hottest month ever recorded for many stations in Florida, based on monthly average temperatures, including Miami, Key West, Tampa, Fort Myers (dating back to 1892), and Bradenton (dating back to 1911). A marine heatwave has also affected areas around the Florida Keys, with water temperatures reaching the upper 90s, which is well above normal and has led to coral bleaching and die-off. A buoy in Manatee Bay recorded an extreme water temperature of 101 ̊F on July 24th, which received a lot of media attention. While this was not representative of ocean sea surface temperatures, coastal and open ocean temperatures in the Atlantic, Gulf of Mexico, and around the Florida Keys were much above normal in July, contributing to oppressive humidity and high heat indices in South Florida.
Globally, the past two months have been record-breaking. June 2023 was the warmest June on record globally, and July 2023 is set to be the hottest month ever recorded.
Drought-Related Impacts.
In mid-July, severe drought (D2) was introduced to the western coast of the Peninsula as year-to-date rainfall deficits continued to accumulate. About 3% of the state was in severe drought (D2), 3% was in moderate drought (D1), and 8% was abnormally dry, according to the U.S. Drought Monitor. As the month neared its end, continued below-normal rainfall led to the introduction of extreme drought confined to the west Florida coast. As of July 25, 1% of the state was in extreme drought (D3), 2% was in severe drought (D2), 3% was in moderate drought (D1), and 4% was abnormally dry (Figure 2 below).
As of July 31, the Lake Okeechobee water level was 15.13 ft. above sea level (Feet-NGVD29), which is above average for this time of year. At the first of the month, the water level was 14.65 ft. above sea level.
Figure 2. A graphical depiction of the latest drought conditions in Florida according to the U.S. Drought Monitor (courtesy of the National Drought Mitigation Center, University of Nebraska-Lincoln).
Agriculture-Related Impacts.
In mid-July, topsoil moisture conditions were adequate in 69% of the state, short in 8%, and very short in 3% of the state, while 20% of the state was experiencing surplus topsoil moisture conditions. By the end of July, topsoil moisture conditions were adequate in 73% of the state, short in 16%, and very short in 5% of the state; 6% of the state was in surplus. For more information, consult the Crop Progress and Conditions Report, which is published by the USDA’s National Agricultural Statistics Service.
Appendix 1
Additional July departures from normal data for select Florida locations (Source: NWS).
| Station | Average Temperature (˚F) | Departure from Normal (˚F) | Total Rainfall (in.) | Departure from Normal (in.) |
| Gainesville | 83.4 | +2.0 | 4.57 | -2.11 |
| Sarasota | 86.2 | +3.1 | 1.10 | -6.29 |
| Melbourne | 83.8 | +0.7 | 11.79 | +5.29 |
| Fort Myers | 86.1 | +2.9 | 4.24 | -5.14 |
| West Palm Beach | 84.5 | +1.4 | 11.54 | +5.91 |
Appendix 2
Select daily record high maximum temperatures (°F) broken or tied during July (compiled from NOAA).
| Location | Date | Record | Broken/Tied | Last |
| Homestead | 1 | 98 | Broken | 97 in 2007 |
| Tampa | 1 | 97 | Broken | 95 in 2014 |
| Tallahassee | 2 | 100 | Tied | 100 in 1998 |
| Plant City | 2 | 100 | Broken | 99 in 2019 |
| Clermont | 4 | 102 | Broken | 97 in 2019 |
| Plant City | 4 | 103 | Broken | 99 in 1997 |
| Orlando | 4 | 98 | Broken | 96 in 2016 |
| Tampa | 4 | 97 | Broken | 96 in 1998 |
| Canal Point | 5 | 99 | Broken | 97 in 1992 |
| Clermont | 5 | 101 | Broken | 98 in 2016 |
| Plant City | 5 | 104 | Broken | 98 in 2019 |
| Jacksonville | 5 | 98 | Tied | 98 in 1969 |
| Miami | 6 | 95 | Tied | 95 in 2009 |
| West Palm Beach | 6 | 97 | Broken | 95 in 2016 |
| Miami | 7 | 97 | Broken | 95 in 2020 |
| Lakeland | 7 | 99 | Broken | 98 in 1992 |
| Miami | 8 | 96 | Broken | 95 in 2020 |
| Vero Beach | 9 | 96 | Broken | 95 in 2020 |
| Homestead | 10 | 100 | Broken | 98 in 2020 |
| Miles City | 11 | 102 | Broken | 100 in 2008 |
| Miami | 11 | 96 | Broken | 95 in 2010 |
| Perrine | 12 | 95 | Broken | 94 in 2022 |
| Miami | 12 | 97 | Broken | 95 in 1981 |
| Bradenton | 14 | 97 | Tied | 97 in 2020 |
| Fort Myers | 19 | 97 | Tied | 97 in 1979 |
| Tampa | 19 | 96 | Tied | 96 in 2010 |
| Bradenton | 20 | 98 | Broken | 96 in 2014 |
| Canal Point | 20 | 97 | Broken | 96 in 2016 |
| Clermont | 21 | 99 | Broken | 98 in 2021 |
| Tampa | 21 | 96 | Broken | 95 in 2016 |
| Tallahassee | 21 | 100 | Tied | 100 in 1942 |
| Jacksonville | 21 | 100 | Broken | 99 in 1993 |
| Homestead | 23 | 98 | Broken | 97 in 2021 |
| Miami | 23 | 98 | Broken | 95 in 2005 |
| Fort Lauderdale | 24 | 98 | Broken | 97 in 2005 |
| Homestead | 24 | 99 | Broken | 96 in 2018 |
| Naples | 24 | 98 | Broken | 97 in 2009 |
| Key West | 25 | 97 | Broken | 96 in 2022 |
| Crestview | 27 | 100 | Broken | 99 in 1993 |
| Jacksonville Beach | 29 | 100 | Broken | 98 in 1968 |
| Miles City | 30 | 101 | Broken | 100 in 2016 |
Prepared by Florida Climate Center
The Florida State University
Tallahassee, FL
Key Points:
- Average monthly temperatures in August were above normal across Florida and many new records were set.
- Monthly precipitation totals in August were near or below normal across the state.
- Extreme drought continued to affect coastal west central Florida throughout the month, and drought degradation occurred in the Panhandle due to a combination of below-normal rainfall and extreme heat.
- An El Niño Advisory continues and there is increased confidence that it will persist into the winter (greater than 95% chance). There is also increasing confidence in the probability of a strong El Niño event.
- Hurricane Idalia made landfall near Keaton Beach, Florida as a Category 3 hurricane on August 30 with maximum wind speeds of 125 mph, becoming the strongest hurricane to make landfall in the Big Bend since the Cedar Key hurricane of 1896.
Average monthly temperatures in August were above normal across the state. Average temperature departures from normal ranged from +1.9 ̊F in Key West to +5.3 ̊F in Pensacola for the month (see Table 1 and Appendix 1 for select cities). High temperatures and oppressive humidity affected much of the state again this month. Pensacola reached a maximum temperature of 105 ̊F on the 26th, which was the hottest temperature recorded in Florida during the month. New all-time record high minimum temperatures were set as well, including 88 ̊F in Key West on the 9th and 86 ̊F in Naples on the 30th. Most stations statewide recorded their hottest August on record, based on monthly average temperatures, including Pensacola, Tallahassee, Gainesville, Tampa, Daytona Beach, Sarasota, Orlando, Fort Myers, Naples, Miami, and Key West.
In addition, August 2023 was the hottest month ever recorded for several locations based on monthly average temperatures, including Tallahassee (old record was 85.5 ̊F set in July 1932), Pensacola (old record was 85.7 ̊F set in August 1951), Tampa (old record was 86.5 ̊F set in July 2023), Miami (old record was 86.5 ̊F set in July 2023), Naples at 85.3 ̊F (old record was 85.0 set in July 1942), Vero Beach at 84.3 ̊F (old record was 83.8 ̊F set in August 2020), Daytona Beach at 85.0 ̊F (old record was 84.5 ̊F set in June 1998), Orlando (old record was 85.2 ̊F set in July 2016), and Gainesville which tied its old record of 84.0 ̊F set in June 1998 and August 2011. Many stations across the state are on pace to see their warmest year on record, based on year-to-date average temperatures January – August. Select daily high maximum and minimum temperature records tied or broken during the month are provided in Appendices 2 and 3.
Table 1. August average temperatures and departures from normal ( ̊F) for selected cities.
| Station | Mean Temperature | Departure from Normal |
| Pensacola | 88.3* | +5.3 |
| Tallahassee | 86.4* | +4.0 |
| Jacksonville | 84.5 | +2.4 |
| Orlando | 85.9* | +3.3 |
| Tampa | 86.9* | +2.9 |
| Miami | 86.6* | +2.4 |
| Key West | 87.4 | +1.9 |
*Indicates a new record for hottest month ever recorded at station.
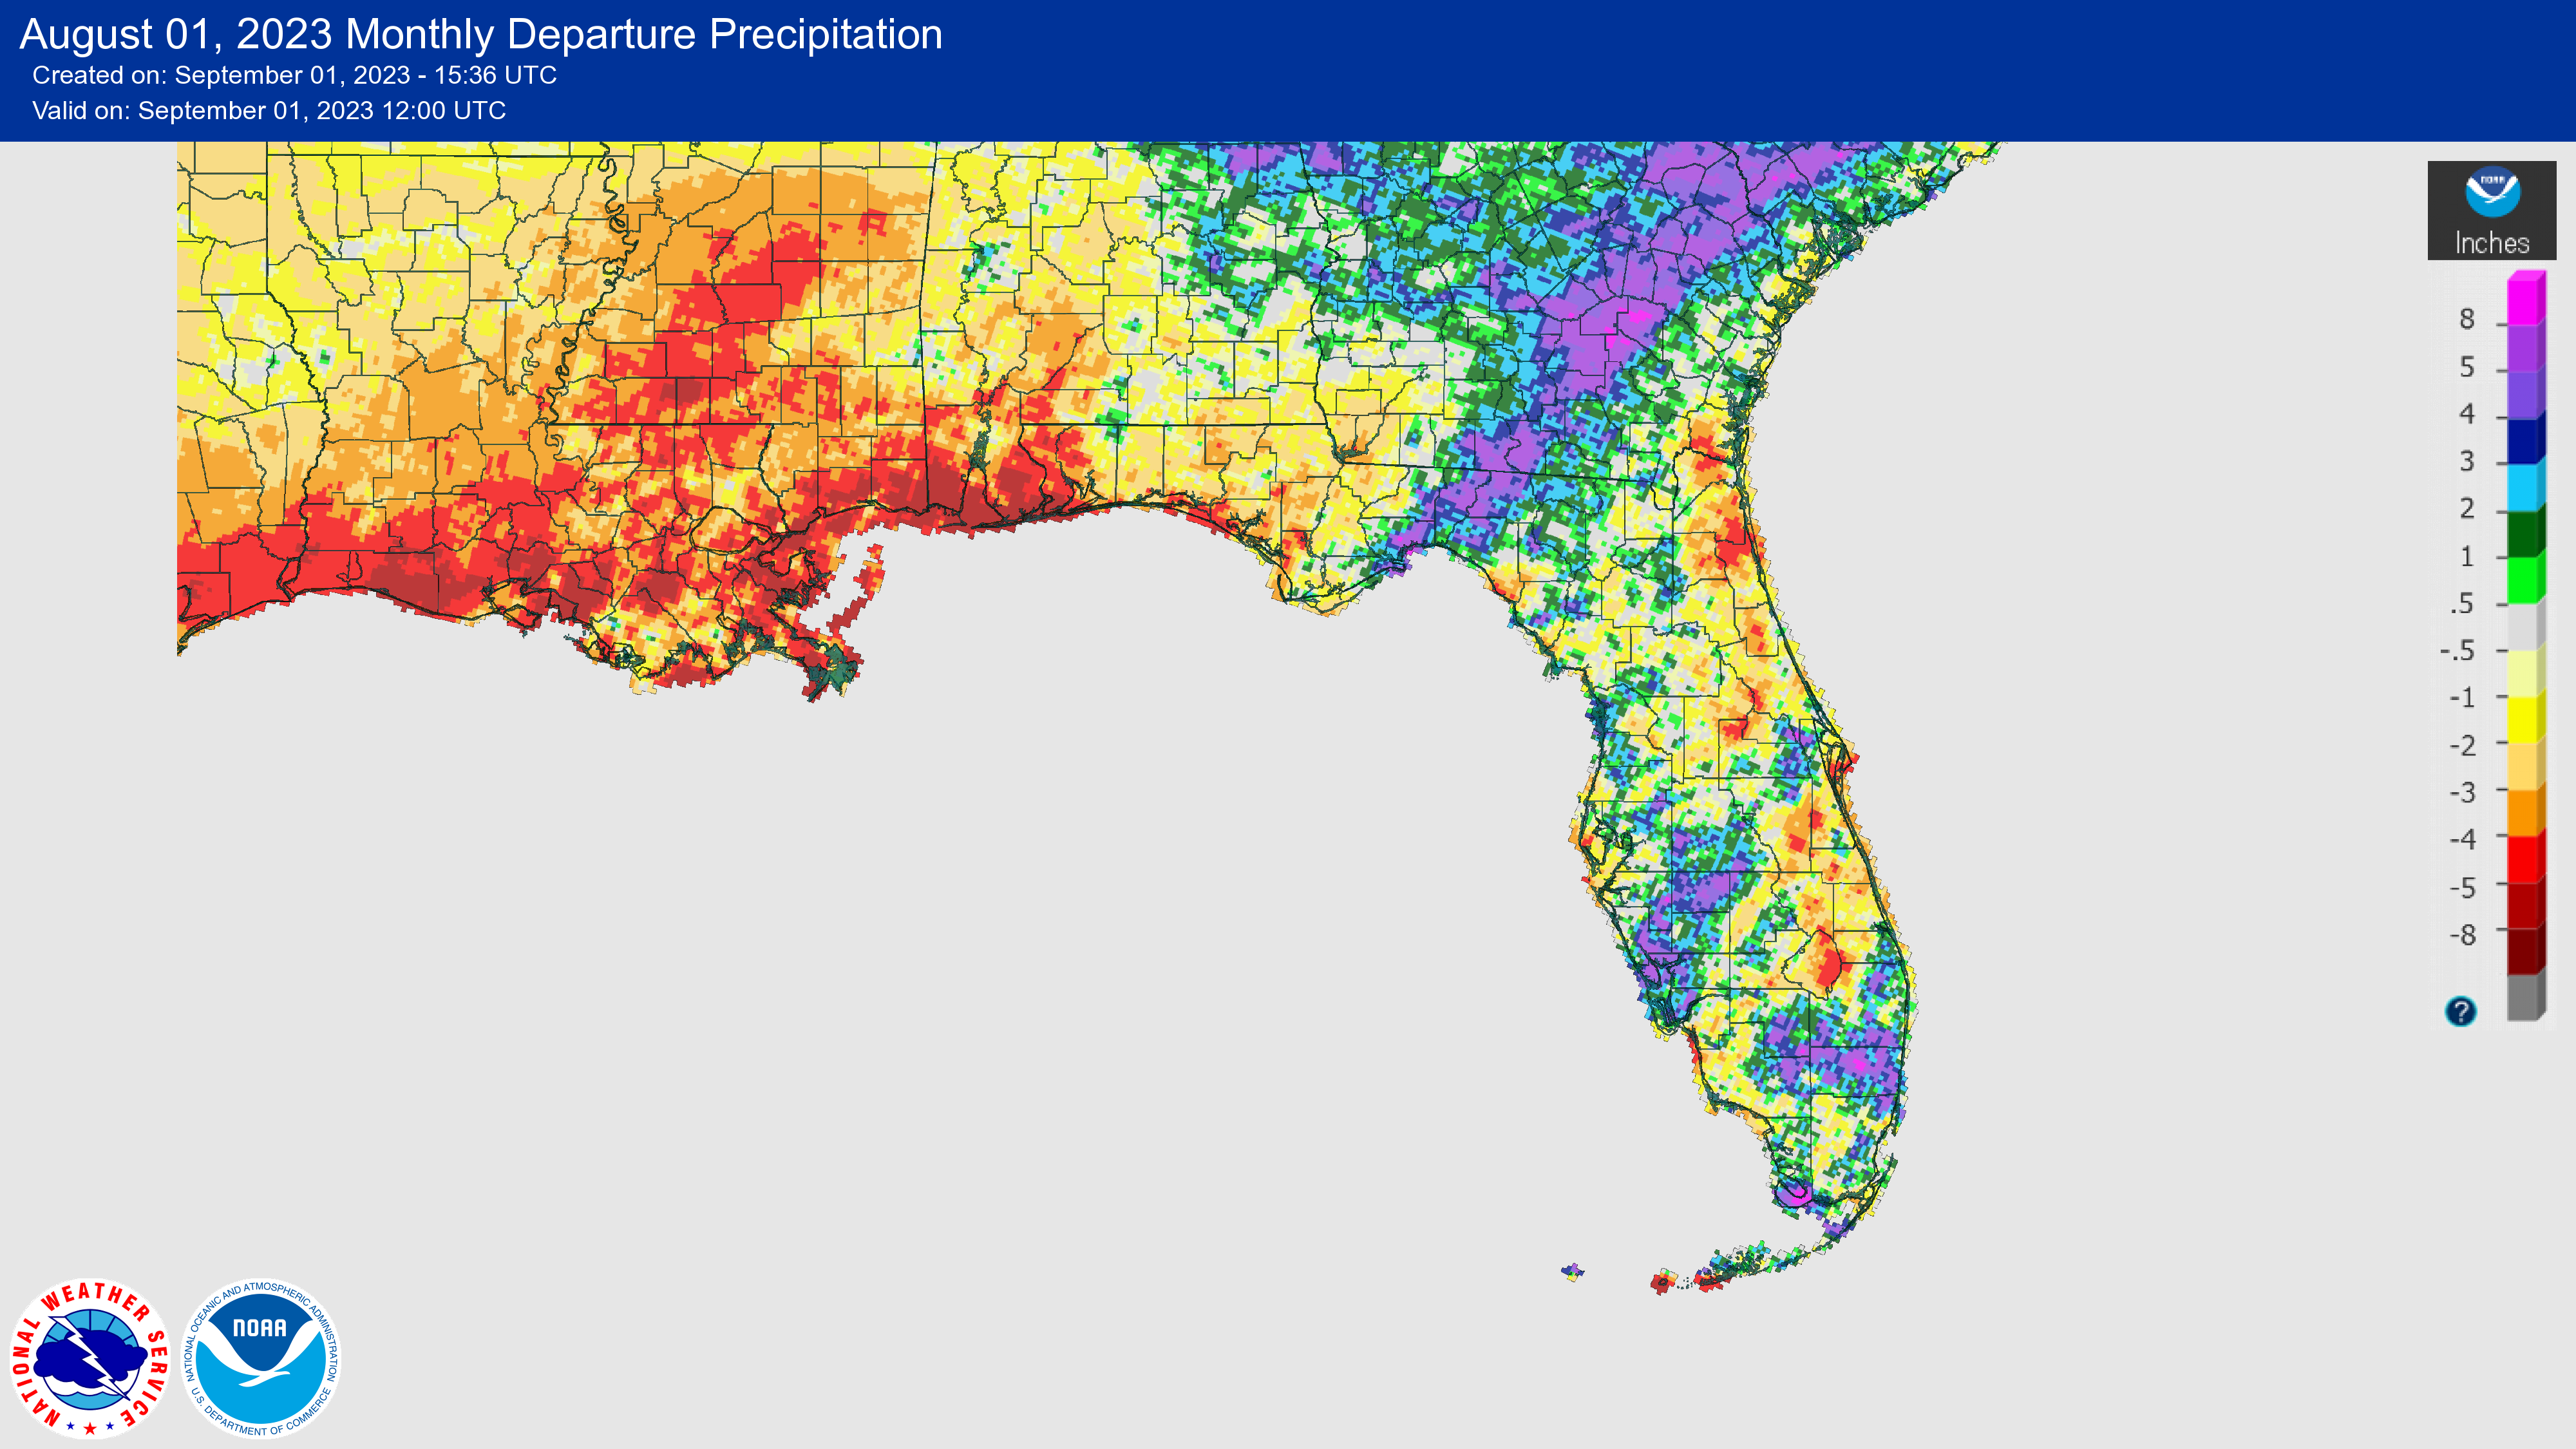
Monthly rainfall totals in August were generally near to below normal. The monthly precipitation departures from normal ranged from -4.98 inches in Pensacola to +2.71 inches in Cross City (see Table 2 and Appendix 1 for select locations). Monthly rainfall totals in the Panhandle were generally well below normal, and the monthly deficit at Pensacola of -4.98 inches ranked as their 6th-driest August on record. The Peninsula had some winners and losers with spotty rainfall throughout the month. Naples collected a mere 4.05 inches, which ranked as the 3rd-driest August on record and did little to alleviate their year-to-date rainfall deficit which now stands at -19.17 inches through August. Fort Lauderdale saw 11.49 inches of rain during the month, which ranked as their 4th-wettest August on record. West Florida and Big Bend regions recorded several inches of rain from Hurricane Idalia, with storm totals generally between 2 and 4 inches and over 6 inches in some locations.
Table 2. August precipitation totals and departures from normal (inches) for selected cities.
| Station | Total Rainfall | Departure from Normal |
| Pensacola | 2.52 | -4.98 |
| Tallahassee | 5.20 | -2.40 |
| Jacksonville | 4.98 | -1.90 |
| Orlando | 8.15 | +0.46 |
| Tampa | 9.97 | +0.94 |
| Miami | 10.25 | +0.67 |
| Key West | 6.31 | +0.94 |
Figure 1. A graphical depiction of the monthly rainfall departure from normal (inches) for August (courtesy of NOAA, NWS).
El Niño Advisory.
El Niño conditions, the warm phase of the El Niño Southern Oscillation climate pattern, in the tropical equatorial Pacific Ocean continued in August. There is strong confidence that El Niño will persist through the Northern Hemisphere winter 2023-24, with greater than 95% chance through December 2023 – February 2024. Forecasters are more confident in the probability of a strong El Niño event, with a more than 60% chance of Niño-3.4 ≥ 1.5°C for the November-January seasonal average. However, a strong El Niño event does not necessarily mean stronger impacts locally.
Hazardous Weather Events in August.
According to the Local Storm Reports issued by the local National Weather Service offices serving Florida, there were 799 individual local reports of hazardous weather events recorded across the state during the month of August (see Table 4 for a breakdown by event type). There were many reports of extreme heat during the month, with heat indices in the 110s°F and peaking above 120°F in parts of the Panhandle (Wakulla and Bay Counties). Lightning strikes resulted in 2 injuries and 1 fatality. Another fatality occurred due to rip currents. Hurricane Idalia, a category 3 hurricane at the time of landfall, caused damaging storm surge across much of the western coast and Big Bend regions of Florida, from Naples to St. George Island. Idalia caused very few injuries and no fatalities; one person was injured when a tree fell on a home in Hamilton County on the 30th. More information about the storm is below.
Table 3. Breakdown of storm reports submitted in Florida during the month of August (compiled from Iowa State University/Iowa Environmental Mesonet).
| Report Type | Number of Reports |
| Heavy Rain | 39 |
| Flood | 12 |
| Flash Flood | 6 |
| Coastal Flood | 1 |
| Hail | 3 |
| Lightning | 6 |
| Non-Thunderstorm Wind Gust | 6 |
| Non-Thunderstorm Wind Damage | 0 |
| Tornado/Waterspout/Funnel Cloud/Landspout | 2/17/7/1 |
| Thunderstorm Wind Damage | 46 |
| Thunderstorm Wind Gust | 240 |
| Extreme Heat | 78 |
| Tropical Cyclone | 325 |
| Storm Surge | 7 |
| Rip Currents | 3 |
Daily Record Events in August.
Table 4. Summary of daily records broken or set in Florida in August (source: NCEI Daily Weather Records).
| Category | Number of Records |
| Highest daily max. temp. | 156 |
| Highest daily min. temp. | 196 |
| Lowest daily max. temp. | 7 |
| Lowest daily min. temp. | 2 |
| Highest daily precipitation | 26 |
| Total | 387 |
Weather/Climate Highlight of the Month: Hurricane Idalia
Hurricane Idalia made landfall in the Big Bend region at Keaton Beach, Florida on the morning of August 30 as a major Category 3 hurricane with maximum winds of 125 mph. Idalia underwent rapid intensification in the Gulf of Mexico as it approached land, with an increase in wind speeds of 55 mph in less than 24 hours, briefly reaching Category 4 strength. Just before landfall, the storm weakened slightly but still made landfall as a major Cat-3 hurricane.
Idalia became the second major hurricane of the 2023 Atlantic hurricane season and the 10th named storm of the season, a few weeks ahead of climatology. Idalia is the strongest hurricane to make landfall in the Big Bend since the Cedar Key hurricane of 1896, which also had maximum winds of 125 mph. Idalia became the first hurricane since Hurricane Gladys in 1968 (which made landfall as a category 2 storm near Homosassa Springs) to make direct landfall in the Big Bend region. The last major hurricane to hit the Big Bend was in 1950 when Hurricane Easy brushed the coast near Cedar Key and moved south to make a second landfall in western Florida near Hernando Beach.
Idalia caused widespread impacts to Florida’s west coast and devastated coastal Big Bend communities with high winds and storm surge, including areas at and near Keaton Beach, Steinhatchee, and Cedar Key, as well as causing flooding further south near Hernando Beach, Punta Gorda, and Tarpon Springs. Inland areas like Perry and Mayo were badly hit as the storm maintained hurricane strength into southeastern Georgia before impacting the Carolinas. Reported rainfall totals in Florida associated with Idalia include 6.67 inches in Madison County (Mesonet station), 6.11 inches in Jefferson County (CoCoRaHS), and 7.66 inches in Charlotte County (CoCoRaHS). Peak wind gusts included 85 mph in Perry, 83 mph in Keaton Beach, and 85.3 mph in Mayo. Many customers in north Florida were without power after the storm and continued to be through the Labor Day weekend.
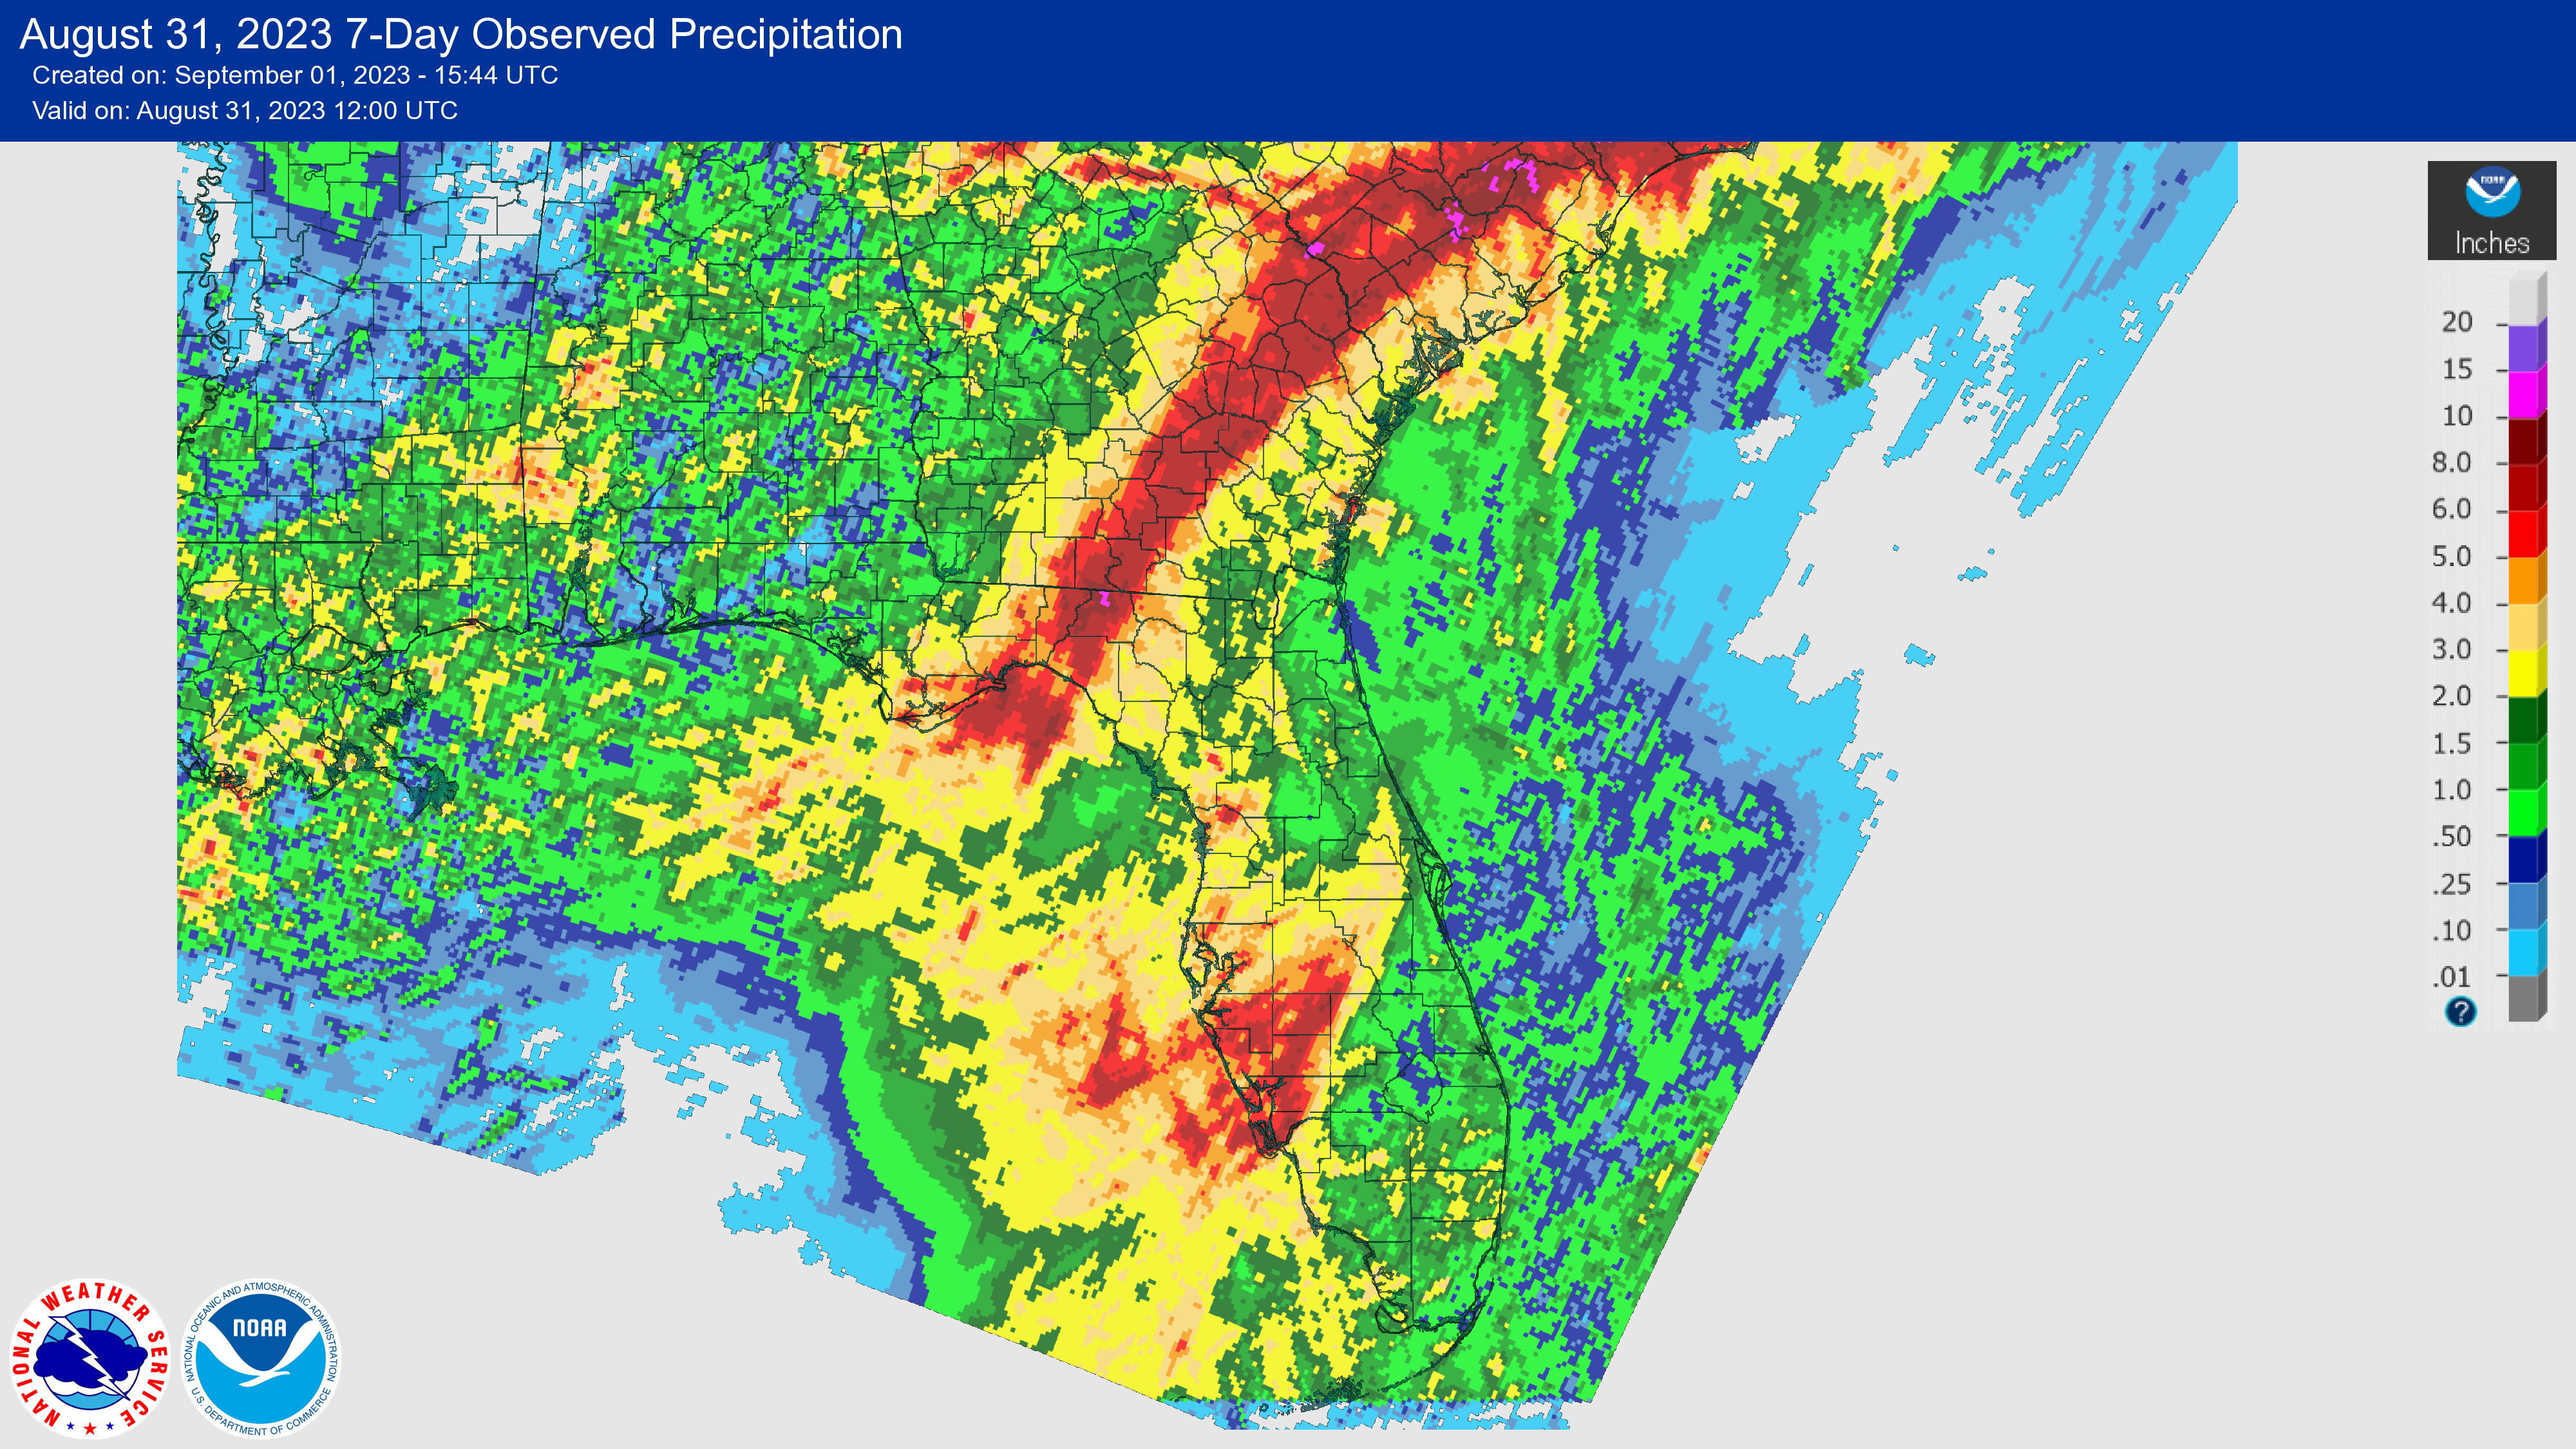
Hurricane Idalia rainfall clearly seen over Florida and the Southeast U.S. in weekly rainfall map (Source: National Weather Service).
Drought-Related Impacts.
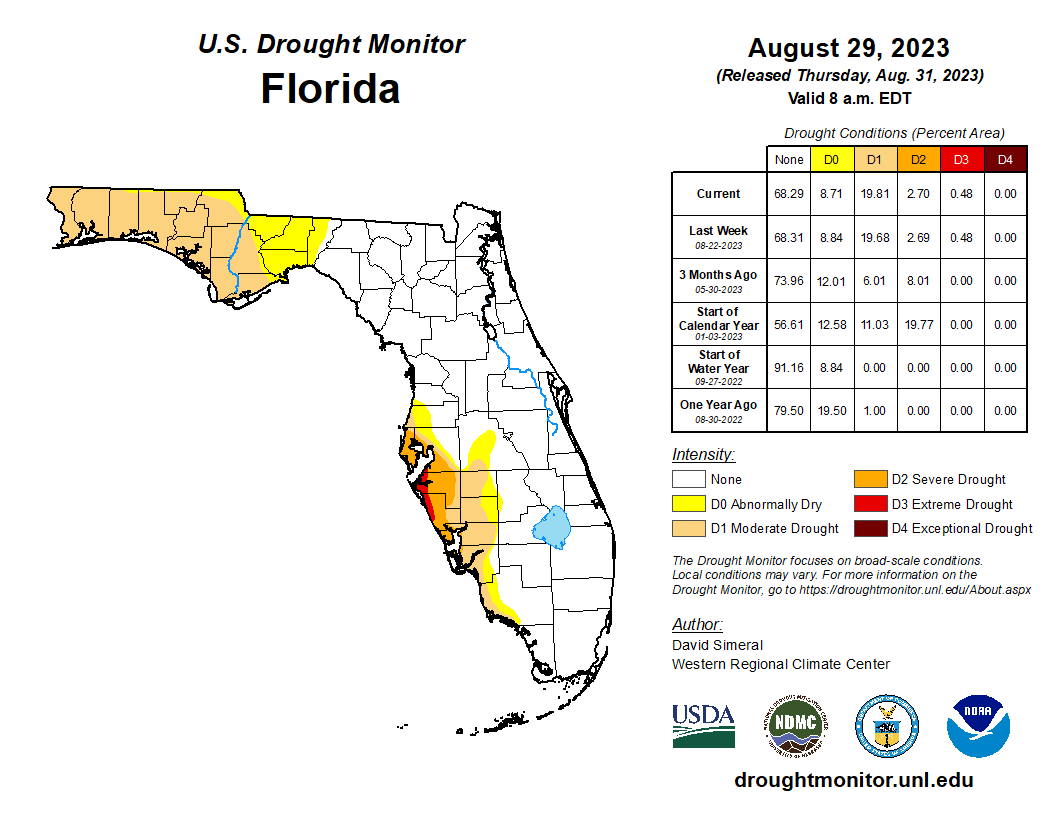
In mid-August, a lack of rainfall combined with extreme heat led to the development of abnormally dry conditions in the Panhandle. By the 15th, roughly 1% of the state was in extreme drought (D3), 3% was in severe drought (D2), 4% was in moderate drought (D1), and 23% was abnormally dry (D0), according to the U.S. Drought Monitor. By the end of the month, continued dryness and extreme heat led to the development of drought in the Panhandle while rainfall from Hurricane Idalia led to slight improvement in drought along the west central coast. As of August 29th, 0.5% of the state was in extreme drought (D3), 2.7% was in severe drought (D2), 20% was in moderate drought (D1), and about 9% was abnormally dry (D0) (see Figure 2 below).
As of August 31, the Lake Okeechobee water level was 15.36 ft. above sea level (Feet-NGVD29), which is above average for this time of year. At the first of the month, the water level was 15.18 ft. above sea level.
Figure 2. A graphical depiction of the latest drought conditions in Florida according to the U.S. Drought Monitor (courtesy of the National Drought Mitigation Center, University of Nebraska-Lincoln).
Agriculture-Related Impacts.
In mid-August, topsoil moisture conditions were adequate in 69% of the state, short in 17%, and very short in 6% of the state, while 8% of the state was experiencing surplus topsoil moisture conditions. Toward the end of August, topsoil moisture conditions were adequate in 62% of the state, short in 17%, and very short in 16% of the state; just 5% of the state was in surplus. For more information, consult the Crop Progress and Conditions Report, which is published by the USDA’s National Agricultural Statistics Service.
Appendix 1
Additional August departures from normal data for select Florida locations (Source: NWS).
| Station | Average Temperature (˚F) | Departure from Normal (˚F) | Total Rainfall (in.) | Departure from Normal (in.) |
| Gainesville | 84.0 | +2.7 | 6.14 | -0.26 |
| Sarasota | 85.9 | +2.5 | 9.12 | +0.01 |
| Naples | 87.0 | +3.7 | 4.05 | -4.84 |
| Fort Myers | 85.9 | +2.5 | 9.69 | -0.74 |
| West Palm Beach | 85.3 | +2.1 | 5.68 | -3.00 |
| Cross City | 84.3 | +3.1 | 10.81 | +2.71 |
Appendix 2
Select daily record high maximum temperatures (°F) broken or tied during August (compiled from NOAA).
| Location | Date | Record | Broken/Tied | Last |
| Homestead | 1 | 96 | Broken | 95 in 2010 |
| Key West | 1 | 94 | Broken | 93 in 1991 |
| Key West | 2 | 95 | Broken | 93 in 2007 |
| Crestview | 2 | 101 | Broken | 100 in 1990 |
| Crestview | 3 | 100 | Broken | 99 in 2015 |
| Key West | 4 | 94 | Broken | 93 in 2007 |
| Jacksonville Beach | 5 | 97 | Broken | 95 in 1954 |
| Niceville | 5 | 100 | Broken | 99 in 1989 |
| Key West | 5 | 94 | Broken | 93 in 2007 |
| Pensacola | 5 | 102 | Broken | 98 in 1989 |
| Bradenton | 6 | 98 | Broken | 95 in 2017 |
| Homestead | 7 | 99 | Broken | 95 in 2016 |
| Plant City | 7 | 103 | Broken | 98 in 2022 |
| Key West | 7 | 96 | Broken | 95 in 2022 |
| Tallahassee | 7 | 99 | Broken | 98 in 1956 |
| Bradenton | 8 | 100 | Broken | 96 in 1993 |
| Clermont | 8 | 99 | Broken | 98 in 2007 |
| Titusville | 8 | 99 | Broken | 98 in 2011 |
| Daytona Beach | 8 | 98 | Broken | 97 in 1989 |
| Bradenton | 9 | 101 | Broken | 96 in 1993 |
| Clermont | 9 | 100 | Broken | 97 in 2020 |
| Tampa | 9 | 97 | Broken | 96 in 2020 |
| Vero Beach | 9 | 97 | Broken | 95 in 1989 |
| Bradenton | 10 | 99 | Broken | 97 in 1993 |
| Homestead | 10 | 98 | Broken | 96 in 2019 |
| Mayport | 10 | 101 | Broken | 97 in 2007 |
| Daytona Beach | 10 | 99 | Broken | 96 in 1984 |
| Vero Beach | 10 | 98 | Broken | 97 in 1955 |
| Homestead | 11 | 100 | Broken | 97 in 2018 |
| Jacksonville | 11 | 102 | Broken | 99 in 2006 |
| Bradenton | 12 | 100 | Broken | 96 in 1984 |
| Ocala | 12 | 100 | Broken | 98 in 2011 |
| Orlando | 12 | 100 | Broken | 97 in 2011 |
| Pensacola | 12 | 100 | Broken | 99 in 1954 |
| Tallahassee | 12 | 100 | Tied | 100 in 2011 |
| Clermont | 13 | 101 | Broken | 97 in 2021 |
| Tampa | 13 | 100 | Broken | 96 in 1999 |
| Gainesville | 13 | 99 | Broken | 97 in 1999 |
| Usher Tower | 14 | 100 | Broken | 96 in 2007 |
| Tallahassee | 14 | 100 | Broken | 99 in 2007 |
| Kissimmee | 16 | 98 | Broken | 96 in 1998 |
| Crestview | 23 | 102 | Broken | 100 in 2011 |
| Tallahassee | 25 | 102 | Broken | 99 in 1989 |
| Pensacola | 26 | 105 | Broken | 100 in 2011 |
| Chipley | 27 | 102 | Broken | 100 in 2011 |
| Crestview | 27 | 103 | Broken | 99 in 2011 |
| Pensacola | 27 | 101 | Broken | 98 in 2011 |
| Miami | 31 | 96 | Broken | 95 in 1998 |
Appendix 3
Select daily record high minimum temperatures (°F) broken during August (compiled from NOAA).
| Location | Date | Record | Last |
| Jacksonville Beach | 1 | 84 | 81 in 1999 |
| Key West | 1 | 86 | 85 in 2015 |
| Bradenton | 2 | 79 | 78 in 2022 |
| Daytona Beach | 3 | 81 | 79 in 2014 |
| Orlando | 3 | 78 | 77 in 2020 |
| Pensacola | 4 | 82 | 81 in 2008 |
| Bradenton | 7 | 82 | 79 in 2015 |
| Key West | 7 | 87 | 85 in 2016 |
| Miami | 7 | 83 | 82 in 2017 |
| West Palm Beach | 7 | 83 | 82 in 2017 |
| Pensacola | 7 | 84 | 82 in 1972 |
| Bradenton | 8 | 81 | 79 in 2012 |
| Fort Myers | 8 | 82 | 80 in 2008 |
| Key West | 8 | 87 | 85 in 2009 |
| Orlando | 8 | 82 | 79 in 2017 |
| Tampa | 8 | 83 | 80 in 2021 |
| Vero Beach | 8 | 81 | 80 in 2017 |
| Lakeland | 8 | 81 | 77 in 2013 |
| Clermont | 9 | 80 | 78 in 2019 |
| Orlando | 9 | 81 | 79 in 1987 |
| Fort Myers | 9 | 82 | 79 in 2019 |
| Key West | 9 | 88 | 85 in 2007 |
| Bradenton | 10 | 83 | 79 in 2018 |
| Kissimmee | 10 | 80 | 78 in 2017 |
| Venice | 10 | 81 | 80 in 2019 |
| Pensacola | 10 | 84 | 79 in 2015 |
| Orlando | 10 | 82 | 79 in 2022 |
| Lisbon | 11 | 78 | 76 in 2007 |
| Pensacola | 11 | 84 | 80 in 1987 |
| Deland | 12 | 81 | 77 in 1955 |
| Lisbon | 11 | 78 | 76 in 2007 |
| Sanford | 12 | 80 | 77 in 2020 |
| Tampa | 12 | 79 | 77 in 2019 |
| Tampa | 13 | 80 | 77 in 2019 |
| Vero Beach | 13 | 80 | 77 in 2020 |
| Tallahassee | 13 | 79 | 76 in 2019 |
| Miami | 14 | 83 | 82 in 2020 |
| Naples | 15 | 81 | 79 in 1949 |
| Orlando | 20 | 78 | 77 in 2007 |
| Jacksonville Beach | 21 | 82 | 80 in 2019 |
| Pensacola | 23 | 81 | 79 in 2021 |
| Tallahassee | 23 | 79 | 77 in 2021 |
| Key West | 28 | 85 | 84 in 2020 |
| Naples | 30 | 86 | 81 in 2005 |
| Fort Lauderdale | 31 | 82 | 81 in 2014 |
Prepared by Florida Climate Center
The Florida State University
Tallahassee, FL
Key Points:
- Average monthly temperatures in September were above normal but more tempered compared to the last few months.
- Monthly precipitation totals in September were above normal in the Peninsula and below normal across western Florida and the Panhandle.
- Extreme drought remained confined to coastal west-central Florida throughout the month, and severe drought emerged in the western Panhandle by month’s end.
- An El Niño Advisory continues and there is increased confidence that it will persist into the winter (greater than 95% chance) and become a strong event (greater than 70% chance).
Average monthly temperatures in September were above average but more tempered compared to the summer months. Average temperature departures from normal ranged from -0.5 ̊F in Jacksonville to +2.3 ̊F in Naples for the month (see Table 1 and Appendix 1 for select cities). West coastal and southern locations experienced one of their top 5 warmest Septembers on record, including Fort Myers (2nd-warmest), Tampa (3rd-warmest), Lakeland (3rd-warmest), Miami (3rd-warmest), Key West (3rd-warmest), and Sarasota (4th-warmest). Pensacola had its 10th-warmest September on record. The record-breaking hot summer ended with Key West, Miami, Pensacola, and Sarasota all recording their hottest summer on record. Select daily high maximum temperature records tied or broken during the month of September are provided in Appendix 2.
Table 1. September average temperatures and departures from normal ( ̊F) for selected cities.
| Station | Mean Temperature | Departure from Normal |
| Pensacola | 81.2 | +1.2 |
| Tallahassee | 79.7 | +0.6 |
| Jacksonville | 78.3 | -0.5 |
| Orlando | 82.3 | +1.3 |
| Tampa | 83.8 | +1.1 |
| Miami | 84.7 | +1.7 |
| Key West | 85.4 | +1.3 |
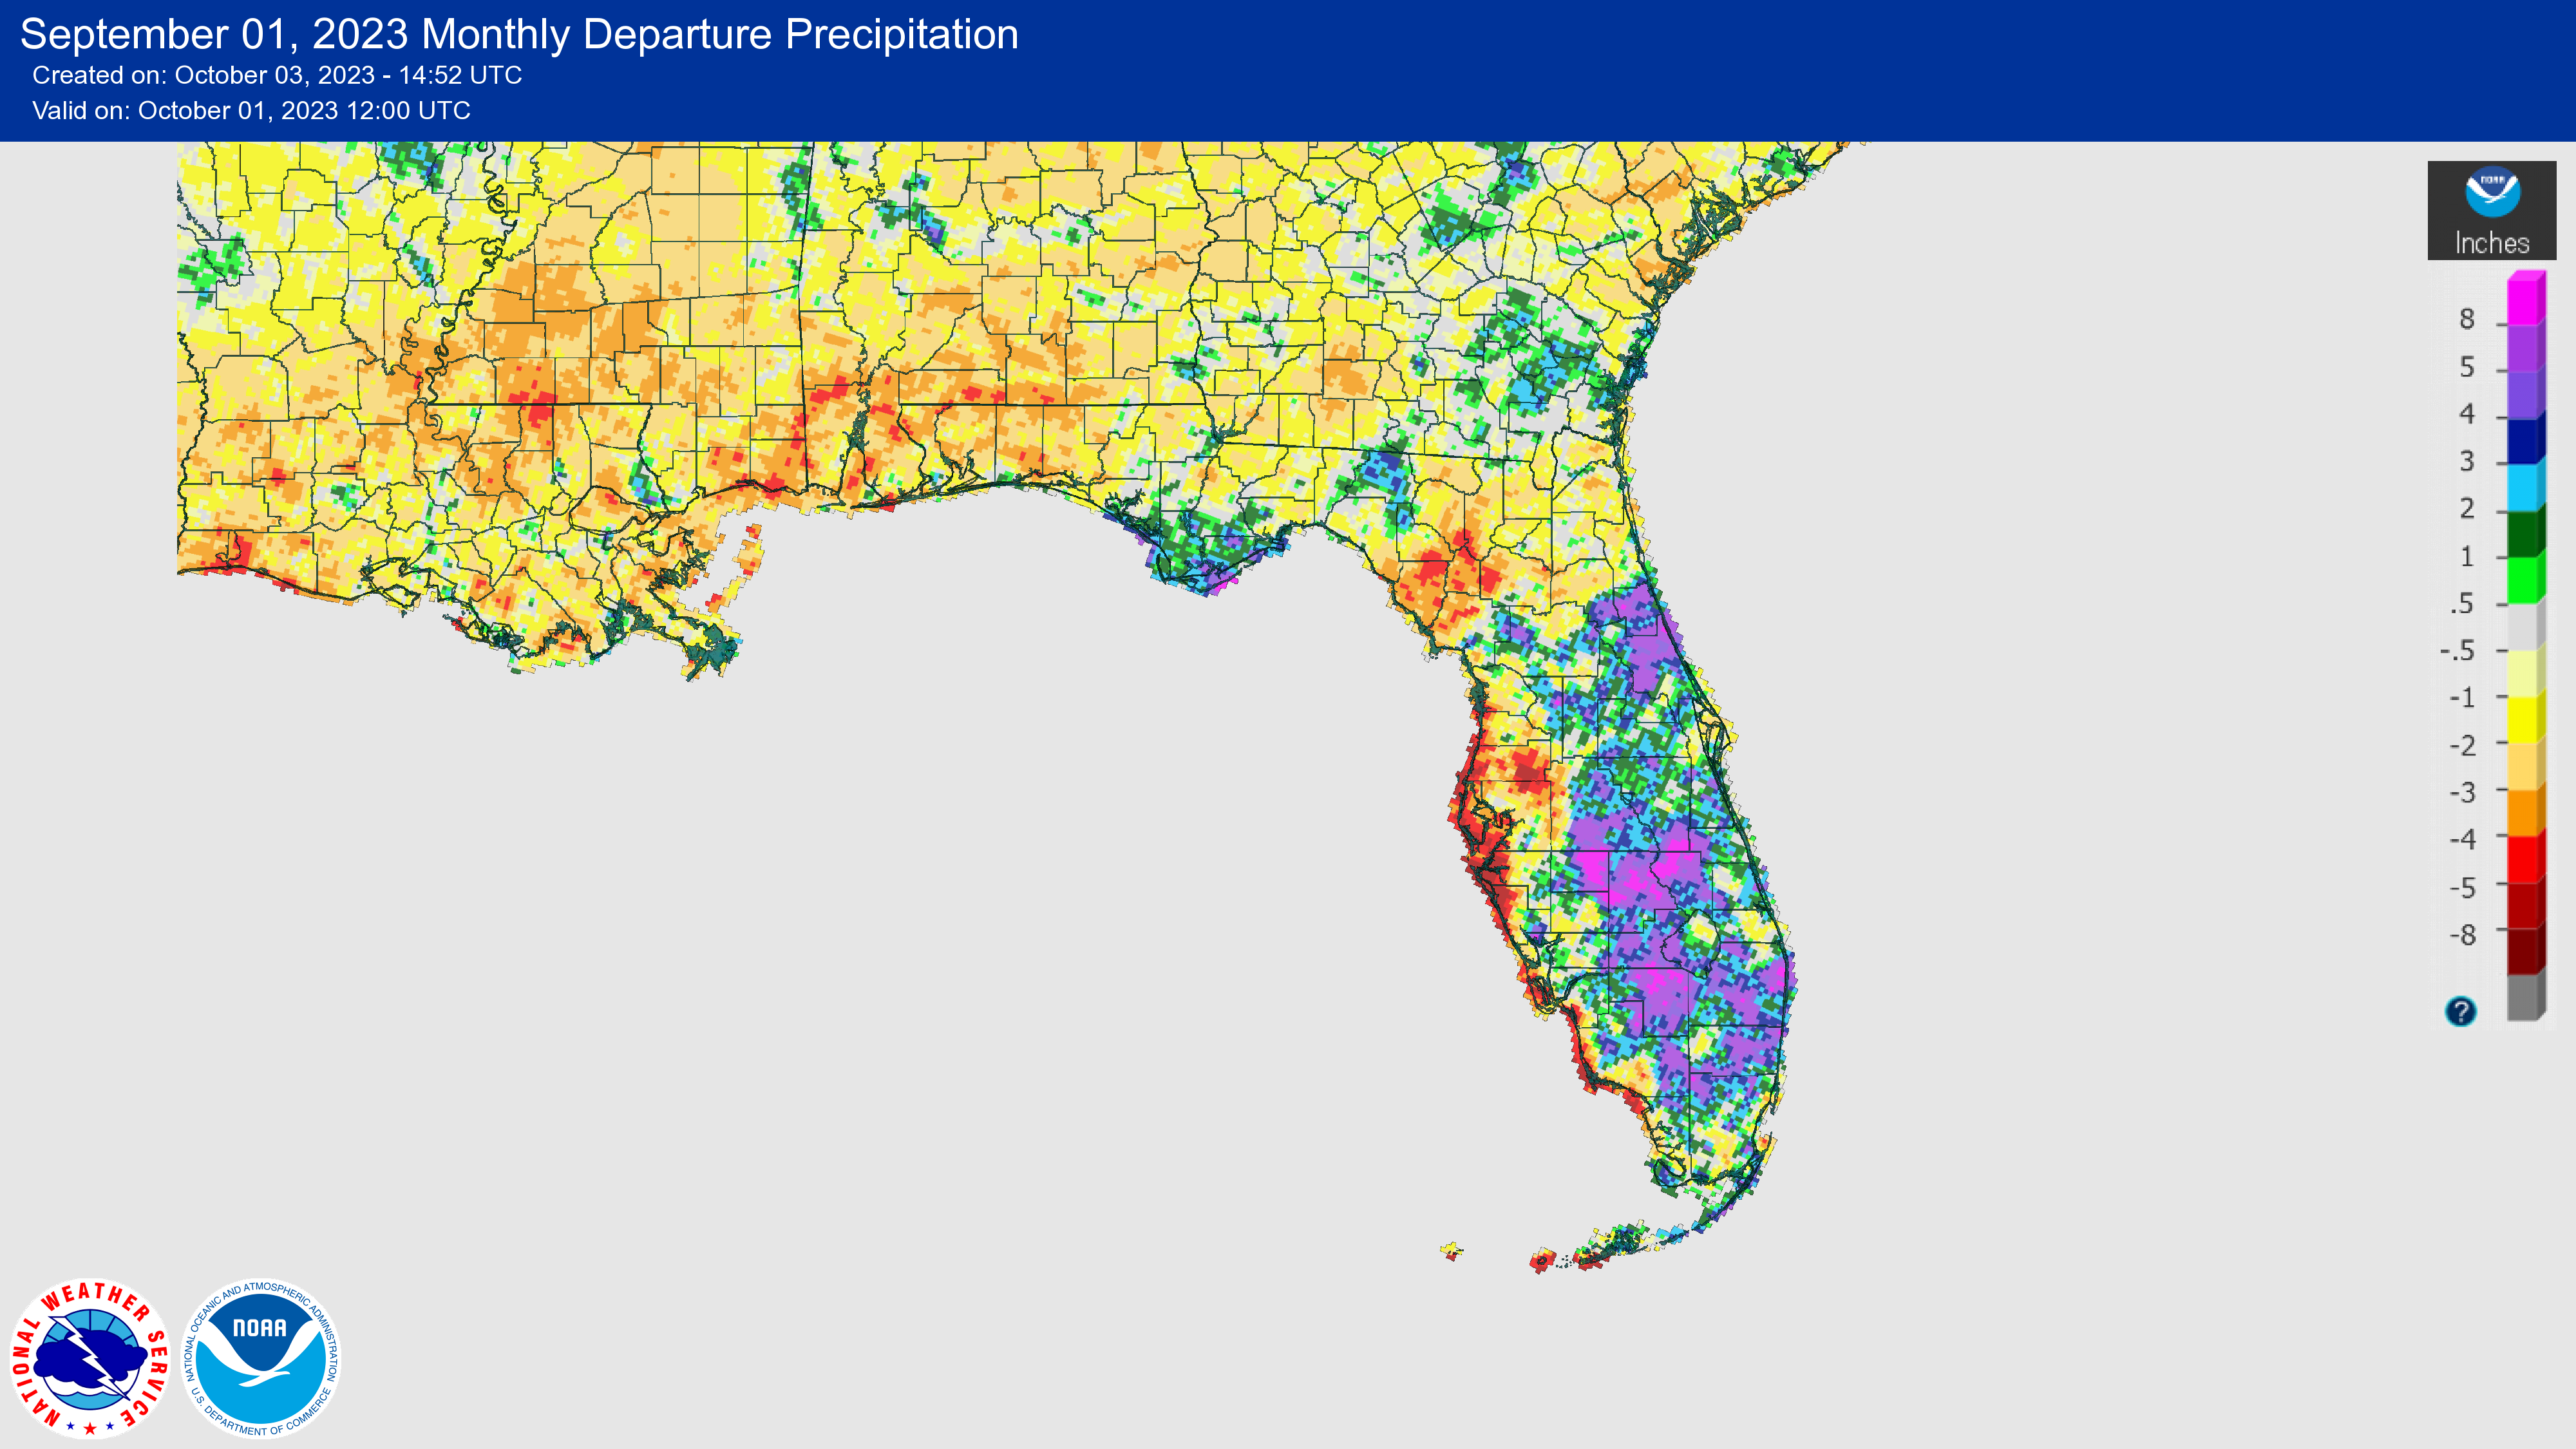
Monthly rainfall totals in September were above normal in the Peninsula and below normal across western Florida and the Panhandle. The monthly precipitation departures from normal ranged from -5.62 inches in Naples to +5.18 inches in West Palm Beach (see Table 2 and Appendix 1 for select locations). Most of the rainfall during the month occurred in the central and eastern Peninsula. While Idalia’s rainfall led to a contraction of drought in southwest Florida, monthly precipitation totals along the west Florida coast were below normal and not enough to bring coastal areas out of drought. Venice, Sarasota, and Tarpon Springs continue to experience their driest year on record, to date.
Table 2. September precipitation totals and departures from normal (inches) for selected cities.
| Station | Total Rainfall | Departure from Normal |
| Pensacola | 3.53 | -3.08 |
| Tallahassee | 5.29 | +0.38 |
| Jacksonville | 9.00 | +1.44 |
| Orlando | 7.28 | +0.91 |
| Tampa | 5.97 | -0.12 |
| Miami | 12.76 | +2.54 |
| Key West | 8.77 | +1.53 |
Figure 1. A graphical depiction of the monthly rainfall departure from normal (inches) for September (courtesy of NOAA, NWS).
El Niño Advisory.
El Niño, the warm phase of the El Niño Southern Oscillation climate pattern in the tropical equatorial Pacific Ocean, continued in August. There is strong confidence that El Niño will persist through the Northern Hemisphere winter 2023-24, with greater than 95% chance through January – March 2024. Forecasters are more confident in the probability of a strong El Niño event (≥1.5°C for the November-January seasonal average in Niño-3.4), above a 70% chance. While El Niño events favor wetter and cooler than normal winters in Florida, the odds of a cooler-than-normal winter is increasingly less likely with the warming temperature trends seen over the last decade in the state.
Hazardous Weather Events in September.
According to the Local Storm Reports issued by the local National Weather Service offices serving Florida, there were 339 individual local reports of hazardous weather events recorded across the state during the month of September (see Table 4 for a breakdown by event type). Two fatalities occurred during the month, one from a lightning strike and another due to rip currents. Several injuries were also reported from rip currents. Severe thunderstorms caused extensive damages and many downed trees throughout the month. Straight-line wind gusts were estimated at 85-90 mph in Wakulla County on the 8th.
Table 3. Breakdown of storm reports submitted in Florida during the month of September (compiled from Iowa State University/Iowa Environmental Mesonet).
| Report Type | Number of Reports |
| Heavy Rain | 49 |
| Flood | 14 |
| Flash Flood | 4 |
| Coastal Flood | 15 |
| Hail | 29 |
| Lightning | 2 |
| Non-Thunderstorm Wind Gust | 4 |
| Non-Thunderstorm Wind Damage | 0 |
| Tornado/Waterspout/Funnel Cloud | 3/24/11 |
| Thunderstorm Wind Damage | 64 |
| Thunderstorm Wind Gust | 117 |
| Rip Currents | 3 |
Daily Record Events in September.
Table 4. Summary of daily records broken or set in Florida in September (source: NCEI Daily Weather Records).
| Category | Number of Records |
| Highest daily max. temp. | 34 |
| Highest daily min. temp. | 20 |
| Lowest daily max. temp. | 1 |
| Lowest daily min. temp. | 9 |
| Highest daily precipitation | 22 |
| Total | 86 |
Weather/Climate Highlight of the Month: Idalia contributes to a record-breaking disaster year.
Hurricane Idalia’s estimated damages are in the $2-$5 billion range, contributing to a record-breaking disaster year. 2023 has had 23 billion-dollar disasters to date, which already sets a record for the highest annual number of billion-dollar disasters dating back to 1980. While total loss and damage assessments are still underway, Hurricane Idalia’s total agricultural losses in Florida alone are estimated at $80-$370 million. Idalia caused extensive damage to agricultural infrastructure and crops, with pecans, vegetables, harvestable fruit, and cotton especially hard hit in impacted areas of Florida and Georgia.
Drought-Related Impacts.
Drought continued to impact the state throughout the month. Extreme drought along the west-central coast persisted with monthly rainfall totals below normal, while moderate drought persisted in the western Panhandle. Abnormally dry conditions emerged in northeast Florida by mid-month. By the 12th, roughly 1% of the state was in extreme drought (D3), 1% was in severe drought (D2), 10% was experiencing moderate drought (D1), and 14% was abnormally dry (D0), according to the U.S. Drought Monitor. By the end of the month, about 1% of the state was in extreme drought (D3), 8% was in severe drought (D2), 9% was in moderate drought (D1), and 13% was abnormally dry (D0) (see Figure 2 below).
As of September 30, the Lake Okeechobee water level was 15.73 ft. above sea level (Feet-NGVD29), which is above average for this time of year. At the first of the month, the water level was 15.36 ft. above sea level.
Figure 2. A graphical depiction of the latest drought conditions in Florida according to the U.S. Drought Monitor (courtesy of the National Drought Mitigation Center, University of Nebraska-Lincoln).
Agriculture-Related Impacts.
In mid-September, topsoil moisture conditions were adequate in 68% of the state, short in 25%, and very short in 2% of the state, while 5% of the state was experiencing surplus topsoil moisture conditions. By September 24, topsoil moisture conditions were adequate in 60% of the state, short in 30%, and very short in 1% of the state; 9% of the state was in surplus. For more information, consult the Crop Progress and Conditions Report, which is published by the USDA’s National Agricultural Statistics Service.
Appendix 1
Additional September departures from normal data for select Florida locations (Source: NWS).
| Station | Average Temperature (˚F) | Departure from Normal (˚F) | Total Rainfall (in.) | Departure from Normal (in.) |
| Gainesville | 79.0 | +0.2 | 3.80 | -1.25 |
| Sarasota | 82.8 | +0.6 | 1.88 | -4.12 |
| Naples | 84.7 | +2.3 | 2.08 | -5.62 |
| Fort Myers | 83.7 | +1.5 | 7.15 | -1.85 |
| West Palm Beach | 82.8 | +0.9 | 13.14 | +5.18 |
Appendix 2
Select daily record high maximum temperatures (°F) broken or tied during September (compiled from NOAA).
| Location | Date | Record | Broken/Tied | Last |
| Fort Lauderdale | 1 | 95 | Broken | 94 in 1998 |
| Vero Beach | 1 | 93 | Tied | 93 in 2007 |
| Ochopee | 1 | 96 | Tied | 96 in 2009 |
| Key West | 1 | 95 | Tied | 95 in 2022 |
| Homestead | 2 | 98 | Broken | 97 in 2021 |
| Tarpon Springs | 4 | 98 | Tied | 98 in 1912 |
| Crestview | 6 | 96 | Broken | 95 in 1999 |
| Tallahassee | 6 | 96 | Tied | 96 in 2010 |
| Daytona Beach | 7 | 94 | Tied | 94 in 1949 |
| Crestview | 7 | 97 | Tied | 97 in 2019 |
| Clermont | 11 | 96 | Broken | 95 in 2019 |
| Plant City | 11 | 100 | Broken | 98 in 1915 |
| Fort Myers | 11 | 96 | Tied | 96 in 1990 |
| Clermont | 12 | 98 | Broken | 96 in 2015 |
| Tampa | 12 | 96 | Broken | 95 in 2021 |
| Fort Myers | 12 | 96 | Broken | 94 in 2021 |
| Key West | 12 | 94 | Broken | 92 in 1948 |
| Miami | 12 | 94 | Broken | 93 in 2022 |
| Clermont | 13 | 95 | Tied | 95 in 2015 |
| Plant City | 13 | 100 | Broken | 97 in 2018 |
| Key West | 13 | 94 | Broken | 92 in 2011 |
| Miami | 13 | 96 | Broken | 93 in 2022 |
| Key West | 14 | 95 | Broken | 93 in 2015 |
| Homestead | 15 | 95 | Broken | 94 in 2022 |
| Key West | 15 | 94 | Broken | 93 in 2007 |
| Tampa | 16 | 95 | Broken | 94 in 1987 |
| Key West | 16 | 93 | Broken | 92 in 2011 |
| Bradenton | 17 | 95 | Tied | 95 in 1990 |
| Melbourne | 18 | 93 | Tied | 93 in 2004 |
| Key West | 18 | 93 | Broken | 92 in 1990 |
| Fort Pierce | 19 | 95 | Broken | 94 in 2020 |
| Clermont | 26 | 96 | Broken | 95 in 2020 |
| Ochopee | 29 | 96 | Broken | 95 in 2011 |
| Miami | 29 | 93 | Tied | 93 in 1980 |
Prepared by Florida Climate Center
The Florida State University
Tallahassee, FL
Summary:
- Average monthly temperatures in December were generally near to above normal.
- 2023 became the hottest year on record for many stations across the state.
- Monthly precipitation totals in December were above normal, except in the extreme western Panhandle and in central Florida where precipitation was near normal.
- Fort Lauderdale had its wettest year on record in 2023, with 113.61 inches of rainfall which was +52.66 inches above normal; Sarasota had its driest year on record in 2023, with 27.13 inches of rainfall which was -29.15 inches below normal.
- El Niño is expected to persist through the Northern Hemisphere winter, with a 54% chance of a “historically strong” event for the November-January season. A transition to ENSO-neutral conditions is favored during April-June 2024 (60% chance).
Average monthly temperatures in December were generally near to above normal. Average temperature departures from normal ranged from -1.0 ̊F in Key West to +2.2 ̊F in Gainesville for the month (see Table 1 and Appendix 1 for select cities). More moderate temperatures during December meant that no monthly temperature records were set. However, 2023 ended up being the hottest year on record for many stations in the state. See below for more details about where 2023 set an annual record. Select daily high maximum temperature records tied or broken during the month are also provided in Appendix 2.
Table 1. December average temperatures and departures from normal ( ̊F) for selected cities.
| Station | Mean Temperature | Departure from Normal |
| Pensacola | 56.5 | +1.0 |
| Tallahassee | 56.2 | +1.8 |
| Jacksonville | 57.3 | +0.6 |
| Orlando | 65.1 | +1.8 |
| Tampa | 64.9 | 0.0 |
| Miami | 71.2 | 0.0 |
| Key West | 72.0 | -1.0 |
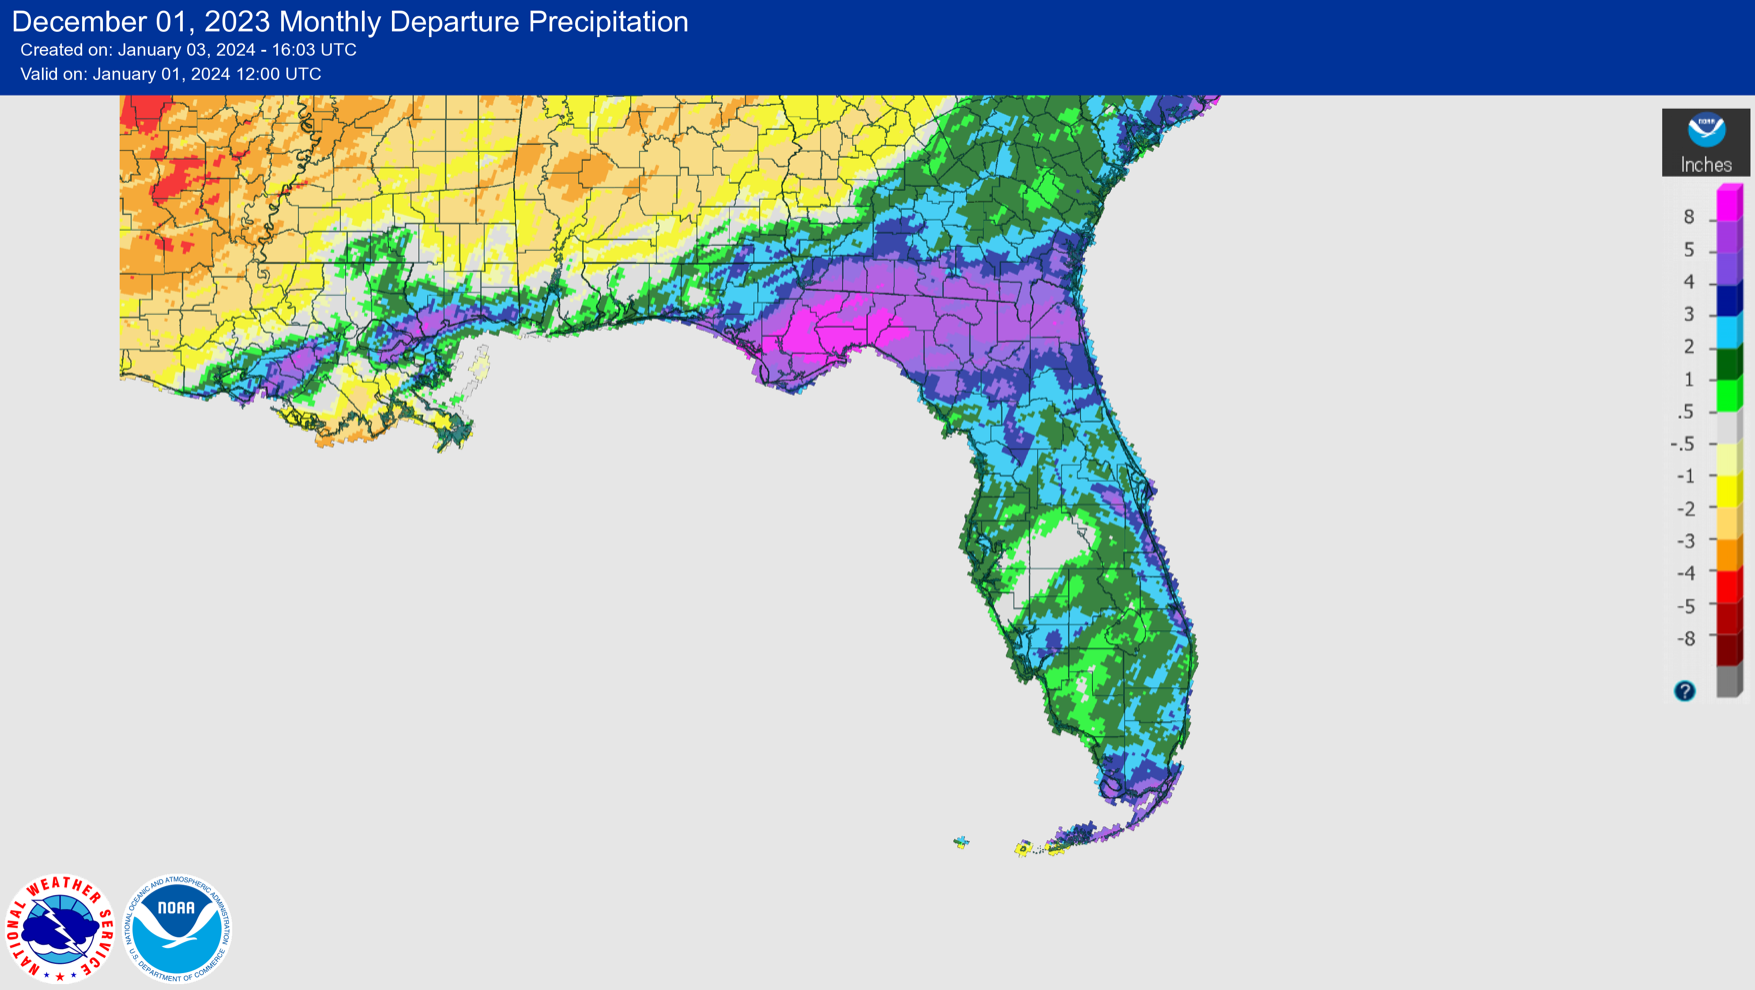
Monthly rainfall totals in December were above normal, except in the extreme western Panhandle and central Florida where it was near normal. The monthly precipitation departures from normal ranged from -0.67 inches in Pensacola to +6.66 inches in Tallahassee (see Table 2 and Appendix 1 for select locations). December was wet and many stations saw one of their top 10-wettest Decembers on record. The wettest area of the state overall was North Florida and the eastern Panhandle, where monthly rainfall totals were over 300% of normal for the month. Southwest Florida also received some much-needed rainfall, which helped to improve drought conditions along southern coastal areas. However, December monthly rainfall totals were not enough to pull the area out of substantial rainfall deficits for the year, and 2023 became a record dry year for southwestern coastal areas.
Table 2. December precipitation totals and departures from normal (inches) for selected cities.
| Station | Total Rainfall | Departure from Normal |
| Pensacola | 4.73 | -0.67 |
| Tallahassee | 10.90 | +6.66 |
| Jacksonville | 6.81 | +4.03 |
| Orlando | 3.67 | +1.19 |
| Tampa | 4.59 | +2.03 |
| Miami | 3.85 | +1.41 |
| Key West | 5.88 | +3.72 |
Figure 1. A graphical depiction of the monthly rainfall departure from normal (inches) for December (courtesy of NOAA, NWS).
El Niño Advisory.
El Niño conditions, the warm phase of the El Niño Southern Oscillation climate pattern in the tropical equatorial Pacific Ocean, is expected to persist through the Northern Hemisphere winter. A transition to ENSO-neutral conditions is favored during April-June 2024, with a 60% chance. The coupled ocean-atmosphere system reflected a strong El Niño during the past month, and there is now a 54% chance of a “historically strong” El Niño (≥ 2.0°C in Niño-3.4) during the November-January season.
Hazardous Weather Events in December.
According to the Local Storm Reports issued by the local National Weather Service offices serving Florida, there were 336 individual local reports of hazardous weather events recorded across the state during the month of December (see Table 4 for a breakdown by event type). Heavy rainfall affected the Panhandle early in the month, with widespread heavy rainfall on the 2nd. Some of the heaviest rainfall reports were in Bay County, with 12.84 inches in Cedar Grove, 8.44 inches in Parker (CoCoRaHS station), and over 7 inches in Panama City. Heavy rainfall was also reported in Gadsden County, including 8.53 inches in Quincy (CoCoRaHS), Leon County with 7.12 inches in Tallahassee (CoCoRaHS), and in Wakulla County, with 8.05 inches in Crawfordville (CoCoRaHS). Mid-month, a Gulf low pressure system crossed over the state bringing another round of locally heavy rainfall, and strong wind gusts of 40-50+ mph were reported.
Table 3. Breakdown of storm reports submitted in Florida during the month of December (compiled from Iowa State University/Iowa Environmental Mesonet).
| Report Type | Number of Reports |
| Heavy Rain | 91 |
| Flood | 27 |
| Flash Flood | 4 |
| Coastal Flood | 9 |
| Non-Thunderstorm Wind Gust | 151 |
| Non-Thunderstorm Wind Damage | 13 |
| Tornado/Waterspout/Funnel Cloud | 3/2/1 |
| Thunderstorm Wind Damage | 7 |
| Thunderstorm Wind Gust | 28 |
Daily Record Events in December.
Table 4. Summary of daily records broken or set in Florida in December (source: NCEI Daily Weather Records).
| Category | Number of Records |
| Highest daily max. temp. | 6 |
| Highest daily min. temp. | 15 |
| Lowest daily max. temp. | 1 |
| Lowest daily min. temp. | 0 |
| Highest daily precipitation | 63 |
| Total | 85 |
Weather/Climate Highlight of the Month: 2023 ends record warm, and record dry for some on west coast.
2023 was the hottest year globally in the observational record dating back to 1850. In Florida, 2023 was the hottest year on record for many locations, based on annual average mean temperatures. This includes Pensacola, Daytona Beach, Orlando, Tampa, Lakeland, Venice, Fort Myers, Miami, and Key West, all with a 60-year instrumental record or longer. Many other locations had one of their top 5 hottest years on record. Western coastal stations ended up with a record dry year in 2023, while the Southeast was among the wettest. The maps below show the station-specific rankings based on annual average mean temperatures (top) and total annual precipitation (bottom), courtesy of the Southeast Regional Climate Center’s Climate Perspectives Tool.
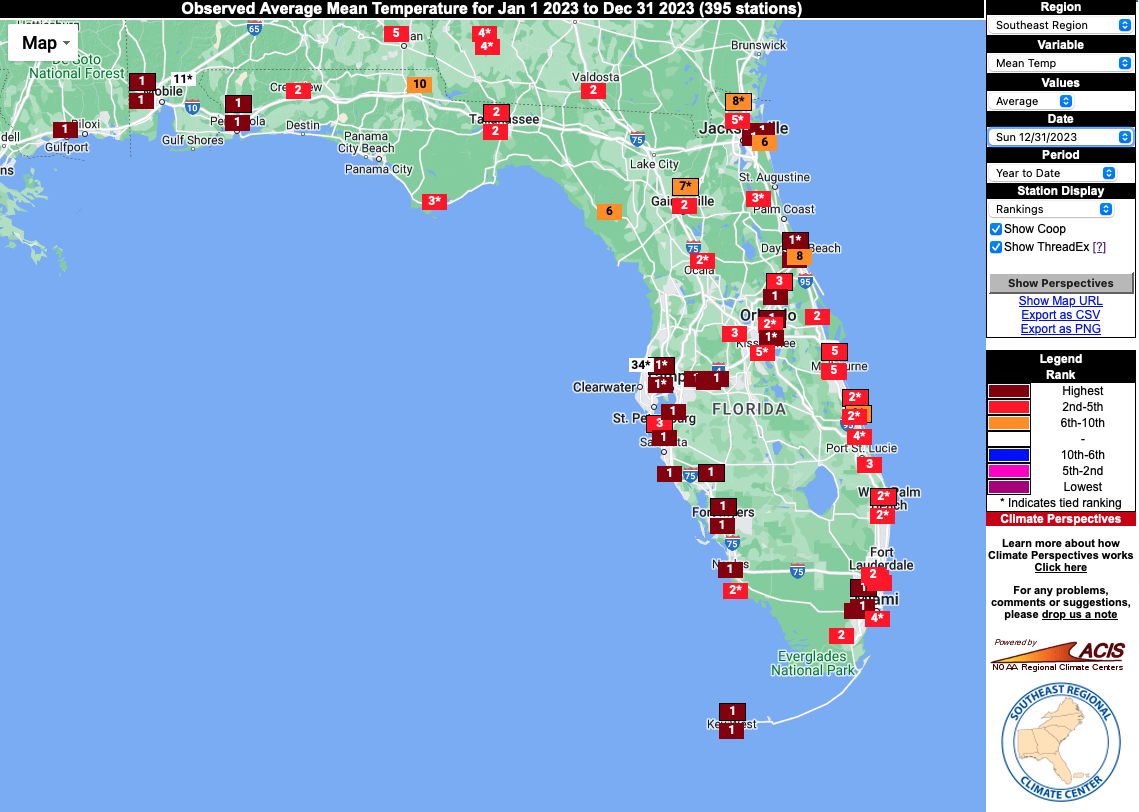
2023 annual average temperature station rankings (Source: Southeast Regional Climate Center's Climate Perspectives Tool).
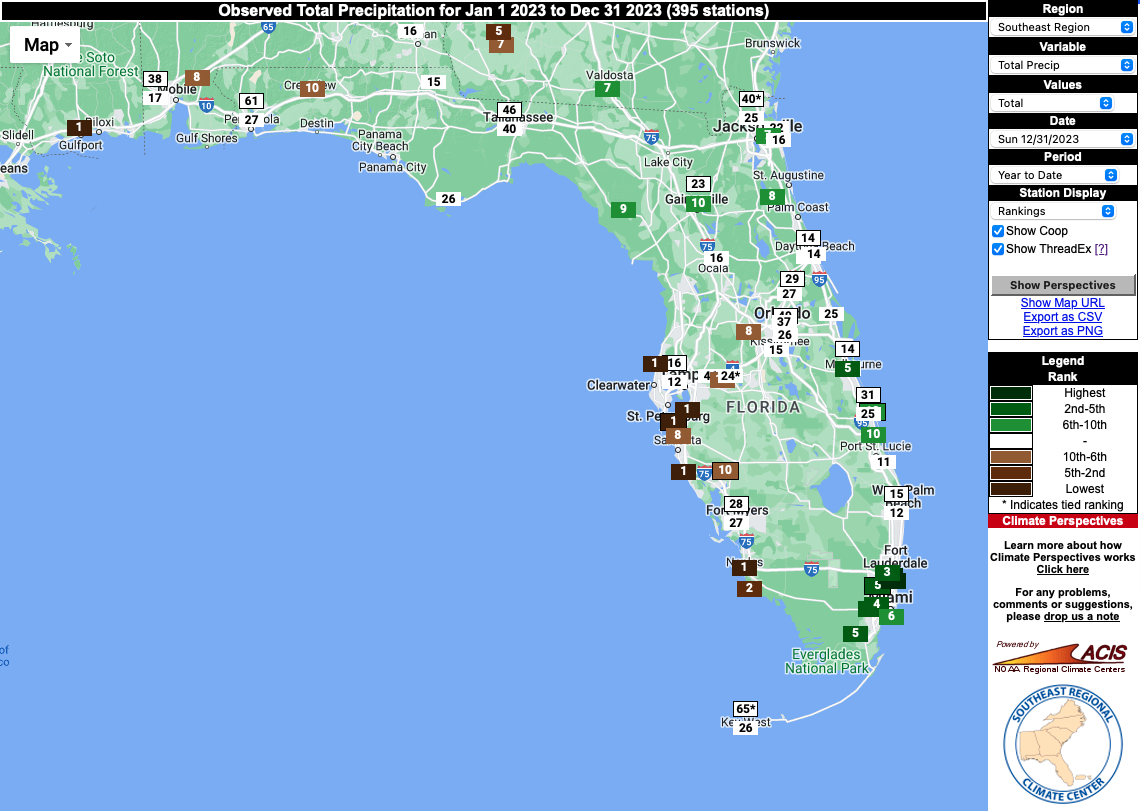
2023 annual total precipitation station rankings (Source: Southeast Regional Climate Center's Climate Perspectives Tool).
Drought-Related Impacts.
Drought conditions improved across the western Panhandle throughout the month as multiple systems generated ample rainfall. Conditions along western coastal areas also improved during the month; however, extreme drought hung on for west-central Florida where many have seen their driest year on record.
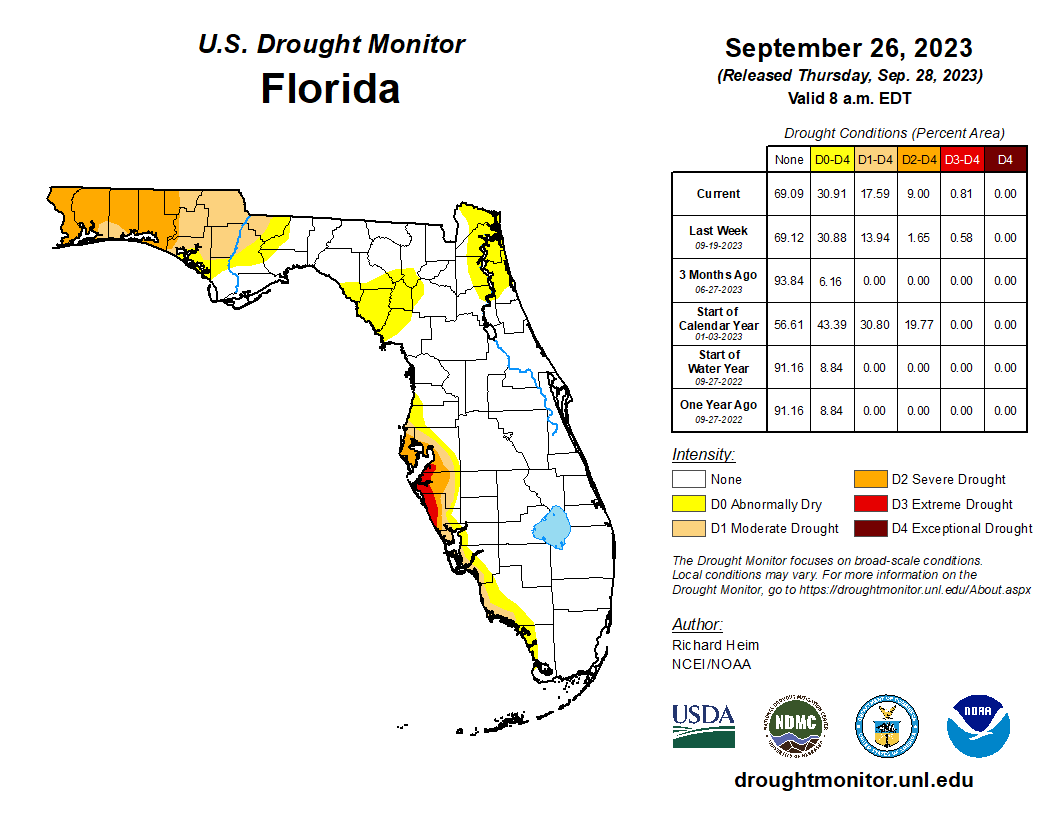
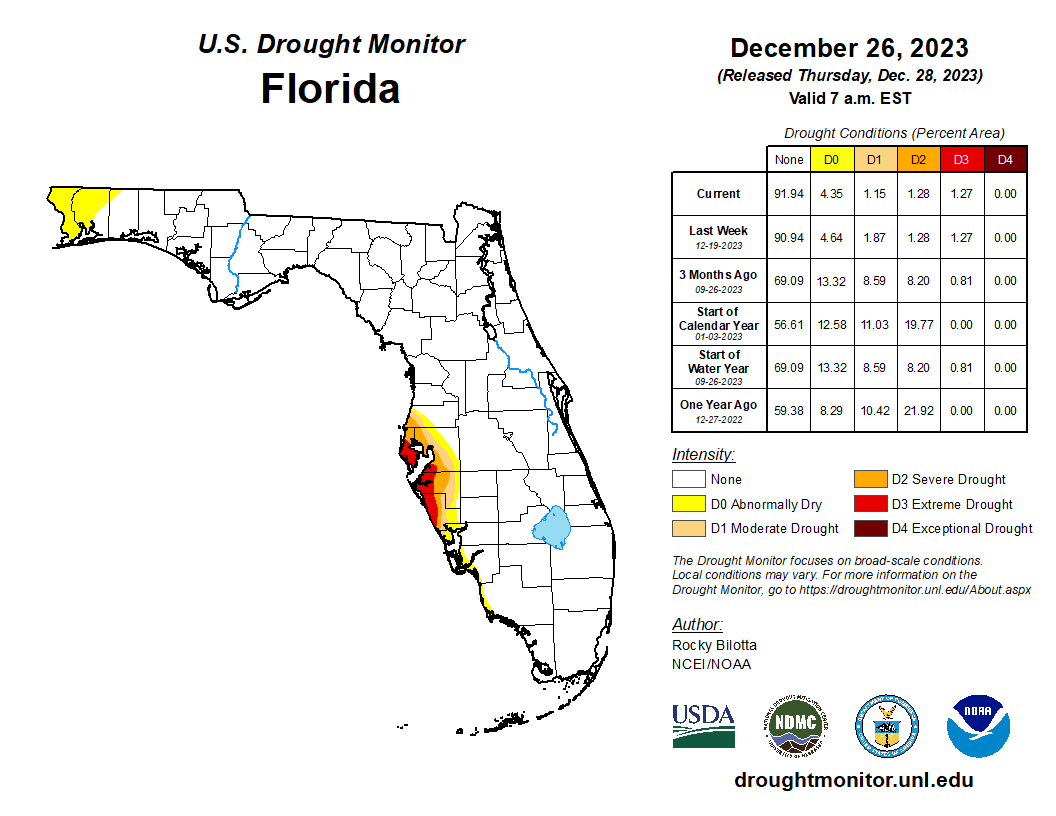
By December 12th, roughly 1.3% of the state was in extreme drought (D3), 1.3% was in severe drought (D2), 2% was in moderate drought (D1), and 8% was abnormally dry (D0), according to the U.S. Drought Monitor. By the end of the month, 1.3% of the state continued to be in extreme drought (D3) and in severe drought (D2), while only 1% was in moderate drought (D1) and 4% was abnormally dry (D0) (see Figure 2 below). Drought removal along Florida’s west-central coast is likely in January.
As of December 31, the Lake Okeechobee water level was 15.98 ft. above sea level (Feet-NGVD29), which is above average for this time of year. The water level did not change much from the start of the month.
Figure 2. A graphical depiction of the latest drought conditions in Florida according to the U.S. Drought Monitor (courtesy of the National Drought Mitigation Center, University of Nebraska-Lincoln).
Agriculture-Related Impacts.
In December, moderate amounts of rainfall improved overall drought conditions in the state. Pasture conditions were fair to good with much-needed rainfall. Sugarcane planting and harvest progressed well during the month. Among the crops that were planted and harvested include sugarcane, green beans, yellow squash, sweet corn, peppers, avocado, and tropical fruits. For more information, consult the Crop Progress State Stories, which is published by the USDA’s National Agricultural Statistics Service December through March.
Appendix 1
Additional December departures from normal data for select Florida locations (Source: NWS).
| Station | Average Temperature (˚F) | Departure from Normal (˚F) | Total Rainfall (in.) | Departure from Normal (in.) |
| Gainesville | 59.5 | +2.2 | 5.90 | +3.02 |
| Sarasota | 66.4 | +1.2 | 3.62 | +1.29 |
| Naples | 67.8 | -0.4 | 2.89 | +1.57 |
| Fort Myers | 67.4 | +0.1 | 4.18 | +2.28 |
| West Palm Beach | 69.2 | +0.2 | 3.98 | +0.50 |
Appendix 2
Select daily record high maximum temperatures (°F) broken or tied during December (compiled from NOAA).
| Location | Date | Record | Broken/Tied | Last |
| Miami | 1 | 85 | Tied | 85 in 2019 |
| Canal Point | 2 | 88 | Broken | 87 in 1991 |
| Homestead | 2 | 87 | Tied | 87 in 2010 |
| Miami | 2 | 86 | Tied | 86 in 2018 |
| Archbold Bio Stn | 3 | 89 | Tied | 89 in 2018 |
| Fort Lauderdale | 3 | 86 | Tied | 86 in 2018 |
| Miami | 3 | 89 | Broken | 88 in 2009 |
| Lakeland | 3 | 87 | Tied | 87 in 2018 |
| Vero Beach | 4 | 86 | Broken | 84 in 1994 |
| Miami | 4 | 86 | Broken | 85 in 2018 |
| Orlando | 4 | 82 | Tied | 82 in 2016 |
| Homestead | 5 | 89 | Tied | 89 in 2018 |
| Fort Lauderdale | 6 | 86 | Broken | 84 in 2020 |
| Pensacola | 25 | 77 | Broken | 75 in 2008 |
| Homestead | 27 | 85 | Tied | 85 in 2015 |
Building A, Suite 292
Tallahassee, FL 32306-2741
Phone: (850) 644-3417 | (850) 644-0719
climate@coaps.fsu.edu