


The Florida Climate Center serves as the primary resource for climate data, information, and services in the state of Florida.

The Florida Climate Center achieves its mission by providing climate monitoring, research, and expertise to be applied by the people, institutions, and businesses of Florida and the surrounding region.
We provide direct service by fulfilling requests for climate and weather data and information in a variety of formats.
We perform research that advances the understanding of the climate variability and changes of Florida and the surrounding region.
We provide outreach in presentations and at events aimed at a variety of groups, interests, and ages.
Prepared by Florida Climate Center
The Florida State University
Tallahassee, FL

Key Points:
- Monthly average temperature departures in November were above normal across the state.
- Monthly precipitation was variable, with surplus rainfall in central and northeast Florida due to Hurricane Nicole and below normal rainfall in the Panhandle.
- Drought conditions persisted across the Panhandle throughout the month, with about 30% of the state in either severe drought (D2) or moderate drought (D1) at the end of the month.
- We are entering the third winter in a row with a La Niña Advisory, with a 57% chance for a transition to ENSO-neutral during February-April 2023.
Average monthly temperatures in November were above normal across the state. Average temperature departures from normal ranged from +2.7 ̊F in Key West to +5.1 ̊F in Fort Myers for the month (see Table 1 and Appendix 1 for select cities). Many locations had one of their top five warmest Novembers on record, including Miami (2nd-warmest), Naples (2nd-warmest), Fort Myers (3rd-warmest), Orlando (4th-warmest), Vero Beach (4th-warmest), and Key West (5th-warmest). The month started out warmer than normal, about 2-5 degrees above average through the 11th. The last week of the month was also warmer than average, with places in south Florida experiencing record warm temperatures. Select daily high maximum temperature records tied or broken during the month are provided in Appendix 2.
Table 1. November average temperatures and departures from normal ( ̊F) for selected cities.
| Station | Mean Temperature | Departure from Normal |
| Pensacola | 64.6 | +3.2 |
| Tallahassee | 64.3 | +4.1 |
| Jacksonville | 65.8 | +3.5 |
| Orlando | 72.8 | +4.6 |
| Tampa | 72.6 | +2.8 |
| Miami | 78.9 | +4.1 |
| Key West | 79.3 | +2.7 |
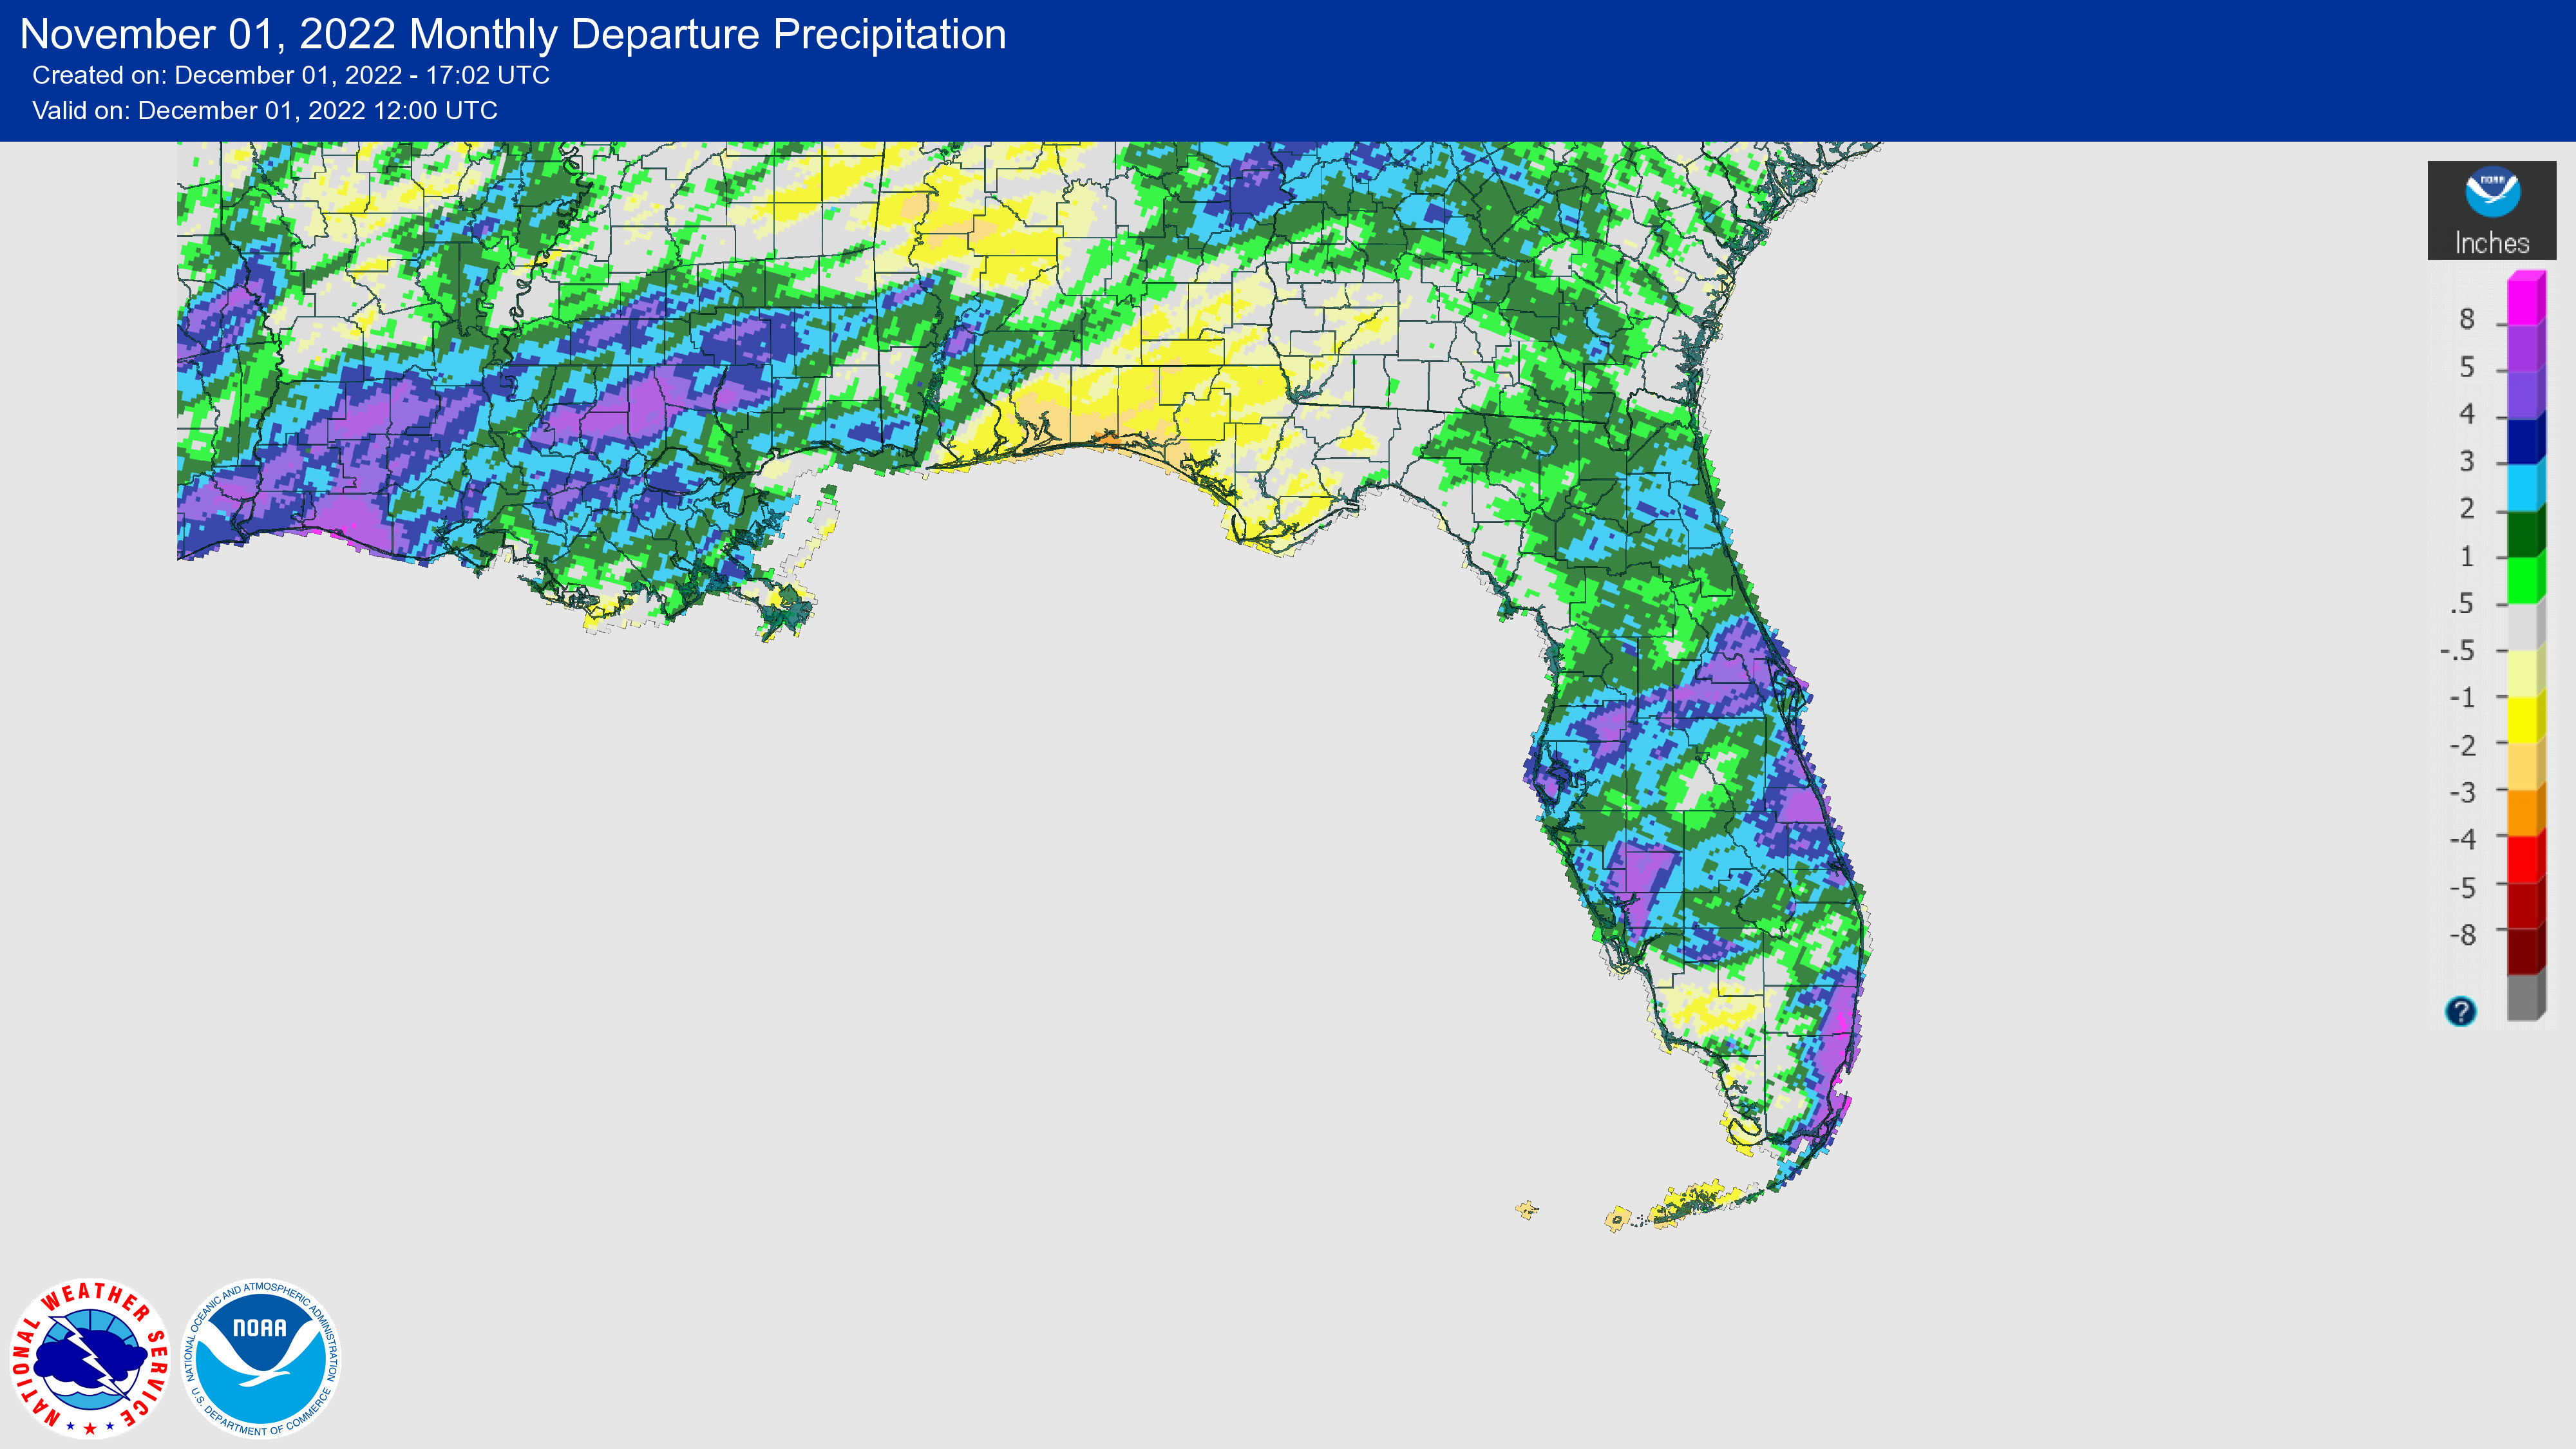
Monthly rainfall totals in November were below normal in the Panhandle and above normal in much of the rest of the state. The monthly precipitation departures from normal ranged from -1.71 inches in Pensacola to +4.96 inches in Miami (see Table 2 and Appendix 1 for additional locations). Hurricane Nicole brought over 5 inches of rain in areas of east-central, central, and west-central Florida on the 10th. The heaviest rain from Nicole occurred in the Tampa to Daytona Beach corridor with some stations receiving as much as 8 inches of rain. The storm made a second landfall just northwest of Cedar Key but did not produce significant rain in the Panhandle. Continued dryness in the Panhandle led to deteriorating conditions and the expansion of moderate drought during the month (see drought section below). Annual precipitation surpluses in Pensacola and Tallahassee continue to shrink due to below-normal rainfall over the past few months, now at just +0.6 and +1.7 inches above normal for the year, respectively.
Table 2. November precipitation totals and departures from normal (inches) for selected cities.
| Station | Total Rainfall | Departure from Normal |
| Pensacola | 2.71 | -1.71 |
| Tallahassee | 2.47 | -0.63 |
| Jacksonville | 3.02 | +1.02 |
| Orlando | 4.27 | +2.48 |
| Tampa | 5.18 | +3.78 |
| Miami | 8.49 | +4.96 |
| Key West | 1.40 | -0.65 |
Figure 1. A graphical depiction of the monthly rainfall departure from normal (inches) for November (courtesy of NOAA, NWS).
La Niña Advisory.
La Niña is expected to continue through the Northern Hemisphere winter, with a 76% chance it will persist for the third year in a row (from December-February). There is a 57% chance for a transition to ENSO-neutral conditions during February-April 2023 (up from 53% since the last ENSO update). Below average sea surface temperatures have stayed consistent in the eastern equatorial Pacific Ocean since late July, and overall the coupled ocean-atmosphere system continues to reflect La Niña. The next ENSO update is scheduled for December 8, 2022.
Hazardous Weather Events in November.
According to the Local Storm Reports issued by the local National Weather Service offices serving Florida, there were 443 individual local reports of hazardous weather events recorded across the state during the month of November, which includes reports and rainfall totals from Hurricane Nicole (see Table 4 for a breakdown by event type). Nicole made landfall as a category 1 hurricane on November 10 near Vero Beach with maximum sustained winds of 75 mph. It then moved through central Florida, briefly emerged in the Gulf of Mexico, and made a second landfall later that day just northwest of Cedar Key in the Big Bend region. Nicole brought high winds, high surf, tidal and storm surge flooding, heavy rainfall, and significant beach erosion particularly in areas previously impacted by Hurricane Ian. The storm caused power outages, significant infrastructure damage, and some severe weather. Coastal erosion undermined homes and other structures in Velano Beach, New Smyrna Beach, and Daytona Beach. Overwash from storm surge led to the closure of A1A in parts of St. Johns and Broward Counties. Downed power lines led to two fatalities in Orange County. Several water rescues occurred due to storm surge flooding.
Table 4. Breakdown of storm reports submitted in Florida during the month of November (compiled from Iowa State University/Iowa Environmental Mesonet).
| Report Type | Number of Reports |
| Heavy Rain | 23 |
| Flood | 4 |
| Coastal Flood | 2 |
| Hail | 1 |
| Marine Thunderstorm Wind | 1 |
| Non-Thunderstorm Wind Gust | 0 |
| Non-Thunderstorm Wind Damage | 0 |
| Tornado/Waterspout/Funnel Cloud | 4/6/1 |
| Thunderstorm Wind Damage | 1 |
| Thunderstorm Wind Gust | 10 |
| Tropical Storm | 249 |
| Hurricane | 8 |
| High Surf | 1 |
| Storm Surge | 68 |
Daily Record Events in November.
Table 5.Summary of daily records broken or set in Florida in November (source: NCEI Daily Weather Records).
| Category | Number of Records |
| Highest daily max. temp. | 65 |
| Highest daily min. temp. | 51 |
| Lowest daily max. temp. | 6 |
| Lowest daily min. temp. | 0 |
| Highest daily precipitation | 38 |
| Total | 160 |
Weather/Climate Highlight of the Month: Hurricane Nicole
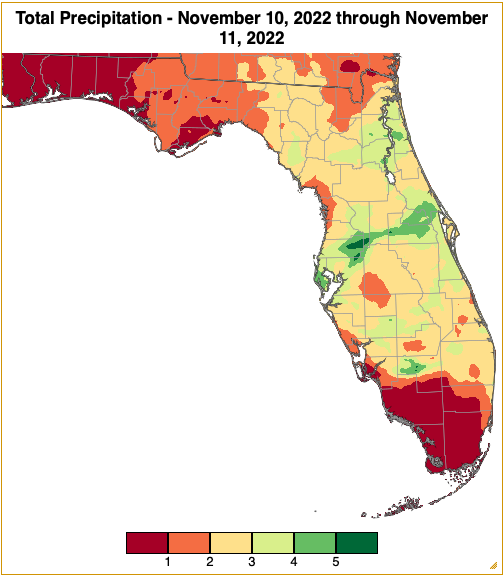
Nicole was a category 1 hurricane when it made landfall along Florida’s Atlantic coast near Vero Beach, and it was a tropical storm when it made a second landfall along the Gulf Coast just west of Cedar Key. Nicole became the 3rd hurricane on record to make landfall in Florida in November. It was the first hurricane to strike Florida in the month of November in 37 years (since Hurricane Kate in 1985). The storm coincided with the time of high tide, exacerbating coastal flooding in some areas and contributing to severe coastal erosion in places previously impacted by Hurricane Ian. Rainfall totals from the storm varied from a couple of inches to over 6 inches in central Florida, according to CoCoRaHS and gridded precipitation data (see Appendix 3). Nicole has delayed drainage of the St. Johns River and now many areas are expected to remain in flood stage through December, prolonging recovery. At least five fatalities have been linked to Nicole and preliminary damage estimates are in excess of $500 million.
Drought-Related Impacts.
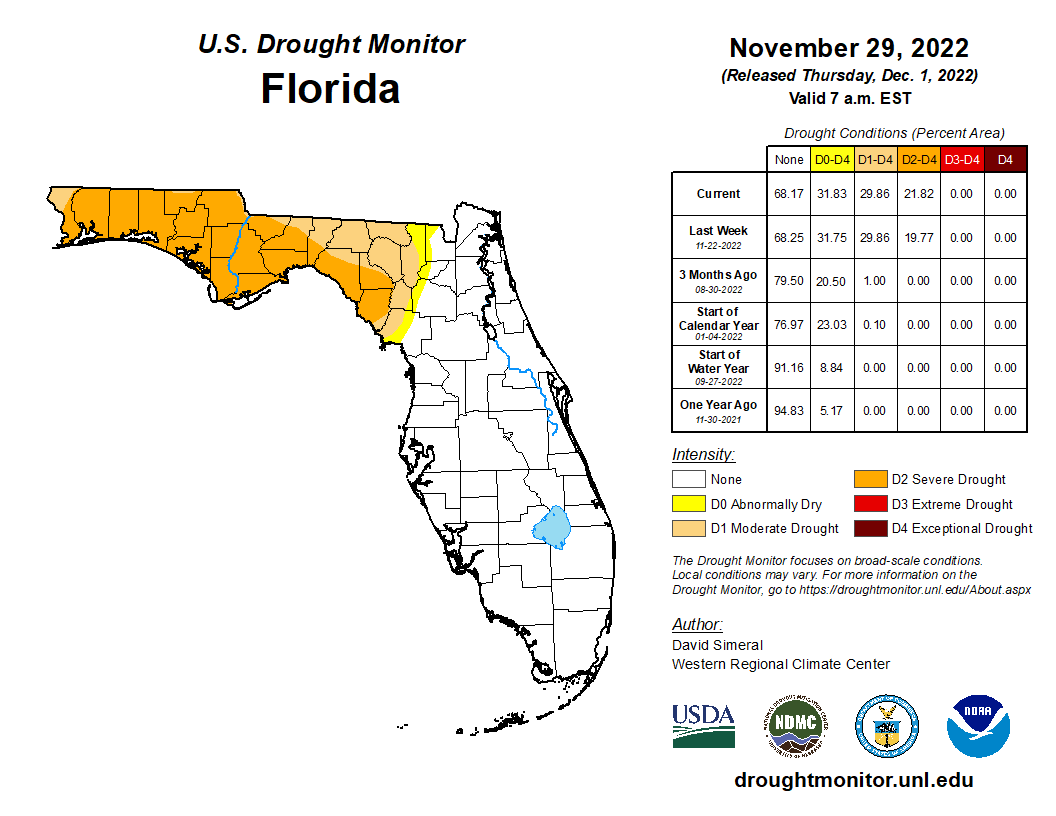
By the middle of November, drought had expanded across the Panhandle and extended east to parts of Levy, Gilchrist, and Columbia counties. About 20% of the area was in severe drought (D2) and 10% was in moderate drought (D1), according to the U.S. Drought Monitor. By the end of the month, 22% of the state was in severe drought (D2), 8% was in moderate drought (D1), and 2% was abnormally dry (D0) (Figure 2 below).
As of November 30, the Lake Okeechobee water level was 16.51 ft. above sea level (Feet-NGVD29), which is above average for this time of the year. The water level continued to rise during the month and has rebounded remarkably by nearly 4 feet since early September. At the first of the month, the water level was 15.87 ft. above sea level.
Figure 2. A graphical depiction of the current drought conditions in Florida according to the U.S. Drought Monitor (courtesy of the National Drought Mitigation Center, University of Nebraska-Lincoln).
Agriculture-Related Impacts.
In mid-November, topsoil moisture conditions were adequate in 66% of the state, short in 13%, and very short in 1% of the state, while 20% of the state was in surplus. At the end of November, topsoil moisture levels were adequate in 74% of the state, short in 17% of the state, and 9% of the state was in surplus. For more information, consult the Crop Progress and Conditions report, which is published by the USDA's National Agricultural Statistics Service.
Appendix 1
Additional November departures from normal data for select Florida locations (Source: NWS).
| Station | Average Temperature (˚F) | Departure from Normal (˚F) | Total Rainfall (in.) | Departure from Normal (in.) |
| Gainesville | 67.0 | +4.3 | 3.95 | +2.16 |
| Sarasota | 73.1 | +3.0 | 2.63 | +0.82 |
| Melbourne | 73.7 | +3.0 | 6.03 | +3.48 |
| Fort Myers | 76.6 | +5.1 | 1.98 | +0.20 |
| West Palm Beach | 77.5 | +4.5 | 6.10 | +2.48 |
Appendix 2
Select daily record high maximum temperatures (°F) broken or tied during November (compiled from NOAA).
| Location | Date | Record | Broken/Tied | Last |
| Miles City | 1 | 94 | Tied | 94 in 2020 |
| Orlando | 1 | 90 | Broken | 89 in 2013 |
| Fort Myers | 1 | 92 | Broken | 91 in 2019 |
| Lakeland | 1 | 90 | Broken | 89 in 1986 |
| Clermont | 2 | 91 | Tied | 91 in 2015 |
| Plant City | 2 | 92 | Broken | 90 in 1971 |
| Venice | 2 | 90 | Broken | 89 in 1995 |
| Cross City | 2 | 89 | Broken | 88 in 2015 |
| Fort Myers | 2 | 92 | Broken | 91 in 2019 |
| Miami | 2 | 90 | Broken | 89 in 2019 |
| Tampa | 2 | 90 | Broken | 89 in 1972 |
| Key West | 2 | 93 | Broken | 88 in 2019 |
| Plant City | 3 | 93 | Broken | 90 in 1972 |
| Fort Myers | 3 | 91 | Broken | 90 in 2015 |
| Key West | 3 | 93 | Broken | 88 in 1994 |
| Crestview | 6 | 89 | Broken | 87 in 2003 |
| Cross City | 7 | 88 | Broken | 87 in 2003 |
| Lake City | 7 | 87 | Broken | 86 in 2000 |
| Marianna | 7 | 87 | Broken | 85 in 2017 |
| Crestview | 7 | 90 | Broken | 84 in 2016 |
| Pensacola | 7 | 85 | Broken | 83 in 2005 |
| Tallahassee | 7 | 88 | Broken | 86 in 2015 |
| Naples | 8 | 90 | Tied | 90 in 2015 |
| Niceville | 8 | 86 | Broken | 81 in 2018 |
| Marianna | 8 | 88 | Broken | 86 in 2000 |
| Crestview | 8 | 90 | Broken | 84 in 2005 |
| Pensacola | 8 | 89 | Broken | 85 in 2020 |
| Niceville | 9 | 86 | Broken | 82 in 2020 |
| Key West | 11 | 92 | Broken | 88 in 2020 |
| Vero Beach | 17 | 86 | Broken | 85 in 1993 |
| Key West | 24 | 92 | Broken | 89 in 2020 |
| Miami | 25 | 88 | Broken | 85 in 2014 |
| Vero Beach | 25 | 87 | Broken | 85 in 1992 |
| Orlando | 25 | 85 | Broken | 84 in 2016 |
| Perrine | 26 | 88 | Broken | 87 in 2014 |
| Ochopee | 26 | 89 | Broken | 87 in 2000 |
| Orlando | 27 | 86 | Broken | 85 in 1988 |
| Miami | 27 | 89 | Broken | 86 in 1948 |
| Fort Lauderdale | 28 | 88 | Tied | 88 in 1958 |
| Perrine | 29 | 86 | Broken | 85 in 2019 |
| Miles City | 30 | 89 | Broken | 88 in 2010 |
| Key West | 30 | 92 | Broken | 89 in 2020 |
Appendix 3
Hurricane Nicole rainfall totals from November 10-11, 2022, based on NRCC hi-resolution data (radar or model guided 5 km gridded data).
Prepared by Florida Climate Center
The Florida State University
Tallahassee, FL
Key Points:
- Monthly average temperatures in May were generally near or above normal.
- Monthly precipitation totals for May were generally above normal for much of the state.
- With increasing rainfall, drought conditions improved across the state during the month, and 74% of the state was drought free by the end of the month. Drought removal is likely over the coming weeks as the rainy season becomes fully underway.
- A transition to El Niño is likely this summer with fairly high forecast confidence.
- A surface low formed in the Gulf at the end of the month and developed into a tropical depression on June 1, kicking off the 2023 Atlantic hurricane season.
Average monthly temperatures in May were generally near to above normal across the state. Average temperature departures from normal ranged from -1.1 ̊F in Melbourne to +2.0 ̊F in Fort Myers for the month (see Table 1 and Appendix 1 for select cities). While the middle of the month was generally warmer than normal for much of the state, the month began and ended with below normal average temperatures in most places. Thus, monthly departures from normal were not as warm as in previous months for most places. However, these first five months of the year, January-May, have been the warmest start to the year on record for many locations across the state, including Miami, Fort Myers, Key West, Sarasota, Tampa, Melbourne, Orlando, Daytona Beach, Ocala, Tallahassee, and Pensacola. Select daily high maximum temperature records tied or broken during the month are provided in Appendix 2.
Table 1. May average temperatures and departures from normal ( ̊F) for selected cities.
| Station | Mean Temperature | Departure from Normal |
| Pensacola | 76.5 | +0.5 |
| Tallahassee | 75.9 | +0.7 |
| Jacksonville | 74.2 | -0.7 |
| Orlando | 78.2 | +0.9 |
| Tampa | 79.6 | +0.1 |
| Miami | 81.2 | +1.1 |
| Key West | 82.0 | +0.9 |
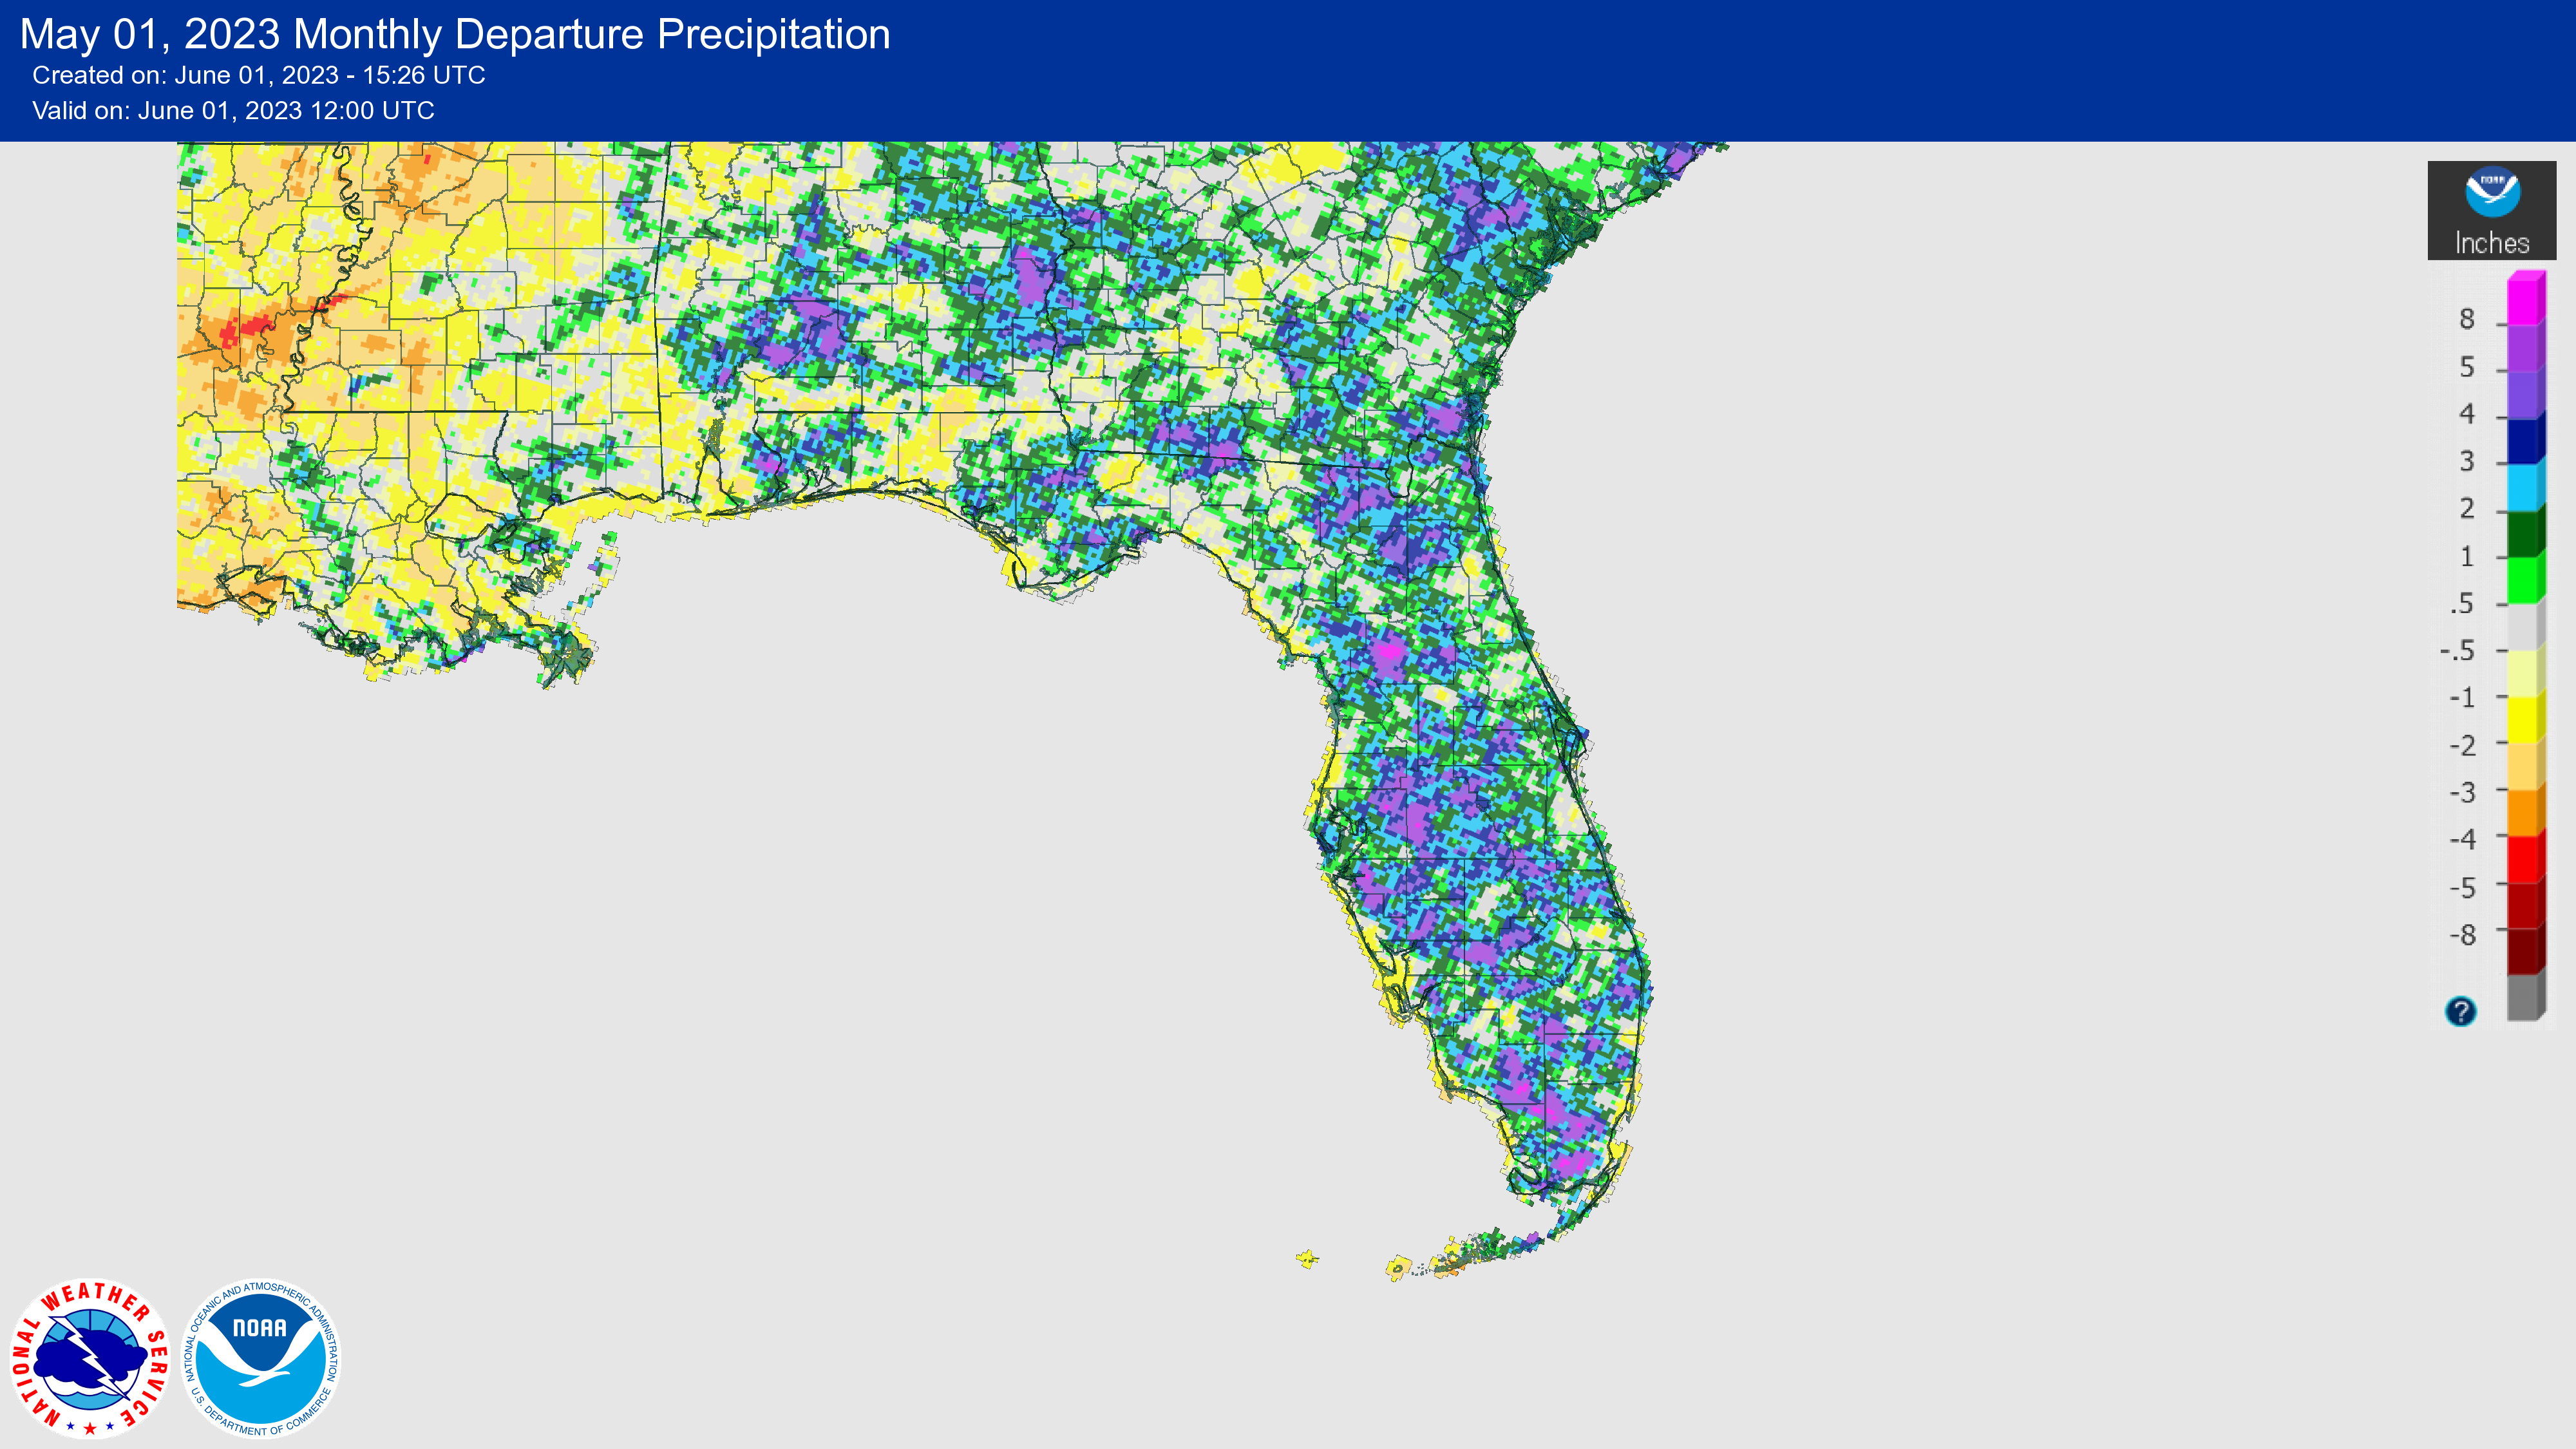
Monthly rainfall totals were generally above normal across the state in May. The monthly precipitation departures from normal ranged from -1.82 inches in Venice to +6.18 inches in Ocala (see Table 2 and Appendix 1 for select locations). Naples had its 4th-driest May on record, and some places are experiencing one of their driest starts to the year on record, January-May, including Naples with 3.08 inches this year (1st-driest), Tarpon Springs with 3.32 inches (2nd driest), and Venice with 5.00 inches this year (4th-driest). On the other hand, several locations experienced one of their wettest Mays on record including Fort Lauderdale (5th-wettest), Lakeland (5th-wettest), Bradenton (6th-wettest), Orlando (8th-wettest), Ocala (9th-wettest), and Jacksonville (9th-wettest). As such, drought conditions improved across the state by the end of the month (see drought information below).
Table 2. May precipitation totals and departures from normal (inches) for selected cities.
| Station | Total Rainfall | Departure from Normal |
| Pensacola | 5.19 | +1.29 |
| Tallahassee | 2.84 | -0.52 |
| Jacksonville | 5.68 | +2.26 |
| Orlando | 6.37 | +2.35 |
| Tampa | 4.11 | +1.51 |
| Miami | 5.92 | -0.40 |
| Key West | 3.97 | +0.85 |
Figure 1. A graphical depiction of the monthly rainfall departure from normal (inches) for May (courtesy of NOAA, NWS).
El Niño Watch.
A transition from ENSO-neutral to El Niño, the warm phase of the El Niño Southern Oscillation, is expected in the next couple of months. There is a greater than 90% chance of El Niño persisting into the Northern Hemisphere winter. Above-average sea surface temperatures (SSTs) expanded westward to the east-central equatorial Pacific Ocean during April and there are now widespread positive temperature anomalies below the surface of the equatorial Pacific Ocean. At the end of the year (November-January), the range of possibilities includes an 80% chance of at least a moderate El Niño (Niño-3.4 ≥ 1.0°C), about a 55% chance of a strong El Niño (Niño-3.4 ≥ 1.5°C), and a 5-10% chance that El Niño fails to materialize, according to the Climate Prediction Center at NOAA.
Hazardous Weather Events in May.
According to the Local Storm Reports issued by the local National Weather Service offices serving Florida, there were 267 individual local reports of hazardous weather events recorded across the state during the month of May (see Table 4 for a breakdown by event type). As the rainy season begins, reports of heavy rainfall and thunderstorm activity have begun to ramp up. One lightning fatality occurred when a man was struck while on a roof on the 22nd in Volusia County. An injury was reported on the 25th when a short-lived EF0 tornado knocked a semi-tractor on its side, injuring the driver. Several reports of pea to golf ball sized hail were made throughout the month.
Table 3. Breakdown of storm reports submitted in Florida during the month of May (compiled from Iowa State University/Iowa Environmental Mesonet).
| Report Type | Number of Reports |
| Heavy Rain | 36 |
| Flood | 8 |
| Flash Flood | 2 |
| Coastal Flood | 1 |
| Hail | 61 |
| Lightning | 2 |
| Marine Thunderstorm Wind | 16 |
| Non-Thunderstorm Wind Gust | 29 |
| Non-Thunderstorm Wind Damage | 0 |
| Tornado/Waterspout/Funnel Cloud | 1/22/5 |
| Thunderstorm Wind Damage | 36 |
| Thunderstorm Wind Gust | 40 |
| Rip Currents | 1 |
| Wildfire | 7 |
Daily Record Events in May.
Table 4. Summary of daily records broken or set in Florida in May (source: NCEI Daily Weather Records).
| Category | Number of Records |
| Highest daily max. temp. | 15 |
| Highest daily min. temp. | 8 |
| Lowest daily max. temp. | 5 |
| Lowest daily min. temp. | 9 |
| Highest daily precipitation | 20 |
| Total | 57 |
Drought-Related Impacts.
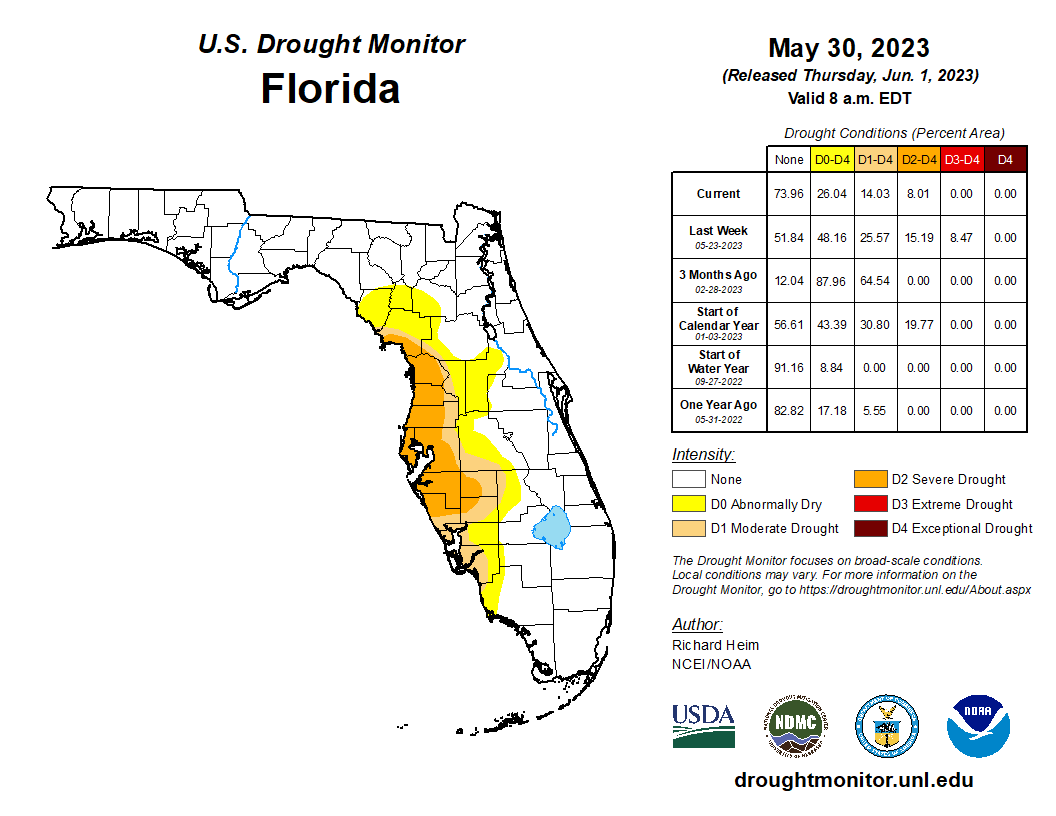
By the middle of May, extreme drought (D3) had expanded across the west-central Florida Peninsula and severe drought (D2) affected much of the Peninsula. About 9% of the state was in extreme drought (D3), 5% was in severe drought (D2), 30% was in moderate drought (D1), and 14% was abnormally dry (D0), according to the U.S. Drought Monitor. By the end of the month, improvement occurred across the state with ample rainfall and extreme drought (D3) was removed along the west coast. As of May 30, 8% of the state was in severe drought (D2), 6% was in moderate drought (D1), and 12% of the state was abnormally dry (D0) (Figure 2).
As of May 31, the Lake Okeechobee water level was 13.85 ft. above sea level (Feet-NGVD29), which is above average for this time of year. At the first of the month, the water level was 14.30 ft. above sea level.
Figure 2. A graphical depiction of the latest drought conditions in Florida according to the U.S. Drought Monitor (courtesy of the National Drought Mitigation Center, University of Nebraska-Lincoln).
Agriculture-Related Impacts.
Much of the Peninsula was in drought during the month, which resulted in increased irrigation throughout the month. Soil moisture remained mixed due to the scattered nature of thunderstorms. In mid-May, topsoil moisture conditions were adequate in 50% of the state, short in 44%, and very short in 5% of the state, while only 1% of the state was experiencing surplus topsoil moisture conditions. By the end of May, topsoil moisture conditions had begun to improve with levels adequate in 69% of the state, short in 20%, and very short in 3% of the state; 8% of the state was in surplus. For more information, consult the Crop Progress and Conditions Report, which is published by the USDA’s National Agricultural Statistics Service.
Appendix 1
Additional May departures from normal data for select Florida locations (Source: NWS).
| Station | Average Temperature (˚F) | Departure from Normal (˚F) | Total Rainfall (in.) | Departure from Normal (in.) |
| Gainesville | 74.6 | -0.4 | 4.11 | +1.03 |
| Sarasota | 78.3 | +0.5 | 2.27 | -0.31 |
| Melbourne | 77.0 | -1.1 | 4.80 | +1.27 |
| Fort Myers | 81.3 | +2.0 | 5.36 | +1.90 |
| West Palm Beach | 79.5 | +0.8 | 5.63 | +0.72 |
Appendix 2
Select daily record high maximum temperatures (°F) broken or tied during May (compiled from NOAA).
| Location | Date | Record | Broken/Tied | Last |
| Miami | 3 | 91 | Broken | 90 in 2016 |
| Bradenton | 6 | 91 | Tied | 91 in 2021 |
| Cross City | 10 | 93 | Tied | 93 in 2017 |
| Lakeland | 10 | 95 | Tied | 95 in 2017 |
| Tallahassee | 10 | 96 | Broken | 95 in 2015 |
| Tampa | 11 | 95 | Broken | 93 in 2018 |
| Fort Myers | 11 | 95 | Tied | 95 in 2012 |
| Tampa | 11 | 94 | Tied | 94 in 2002 |
| Bradenton | 12 | 93 | Broken | 92 in 2015 |
| Pensacola | 14 | 92 | Broken | 91 in 2018 |
| Naples | 15 | 92 | Tied | 92 in 2003 |
| Fort Myers | 15 | 96 | Tied | 96 in 1990 |
| Pensacola | 15 | 94 | Tied | 94 in 1998 |
| Vero Beach | 17 | 95 | Tied | 95 in 1945 |
| Fort Lauderdale | 18 | 90 | Broken | 89 in 2016 |
| Vero Beach | 18 | 93 | Broken | 92 in 2008 |
| Miles City | 19 | 98 | Broken | 97 in 2003 |
| Ochopee | 19 | 94 | Broken | 93 in 2022 |
| Key West | 19 | 91 | Broken | 89 in 2008 |
| Key West | 21 | 91 | Broken | 90 in 1995 |
| Key West | 22 | 92 | Broken | 90 in 1990 |
| Key West | 23 | 90 | Broken | 89 in 2008 |
Prepared by Florida Climate Center
The Florida State University
Tallahassee, FL
Key Points:
- Monthly average temperatures were above normal in March for the third month in a row this year.
- Monthly precipitation totals were generally below normal, with exceptions in parts of northern Florida; the Big Bend region saw a surplus of rainfall during the month.
- Severe drought expanded across the Peninsula, and a pocket of extreme drought developed in Southwest Florida later in the month.
- A final La Niña Advisory was issued and ENSO-neutral conditions currently exist.
Average monthly temperatures in March were above normal across the state. Average temperature departures from normal ranged from +3.0 ̊F in Jacksonville to +5.0 ̊F in Tallahassee and Ft. Myers for the month (see Table 1 and Appendix 1 for select cities). Temperatures in March 2023 began much above normal, with most stations recording their top warmest or 2nd-warmest first week of March on record. Cooler, more seasonable weather returned by mid-month, and a late-season frost with minimum temperatures reaching as low as 30 ̊F -35 ̊F affected much of the Panhandle and northern Florida on March 20-21. Above-normal temperatures returned at the end of the month, with 90+ ̊F maximum temperatures observed across southern Florida during the last week of March. Many stations recorded one of the top 5-warmest months of March on record, such as Tallahassee, Pensacola, Orlando, Fort Myers, Melbourne, Lakeland, Miami, West Palm Beach, Naples, and Key West. Select daily high maximum temperature records tied or broken during the month are provided in Appendix 2.
Table 1. March average temperatures and departures from normal ( ̊F) for selected cities.
| Station | Mean Temperature | Departure from Normal |
| Pensacola | 66.5 | +4.2 |
| Tallahassee | 66.4 | +5.0 |
| Jacksonville | 65.4 | +3.0 |
| Orlando | 71.9 | +4.6 |
| Tampa | 72.3 | +3.7 |
| Miami | 76.9 | +3.8 |
| Key West | 77.5 | +3.1 |
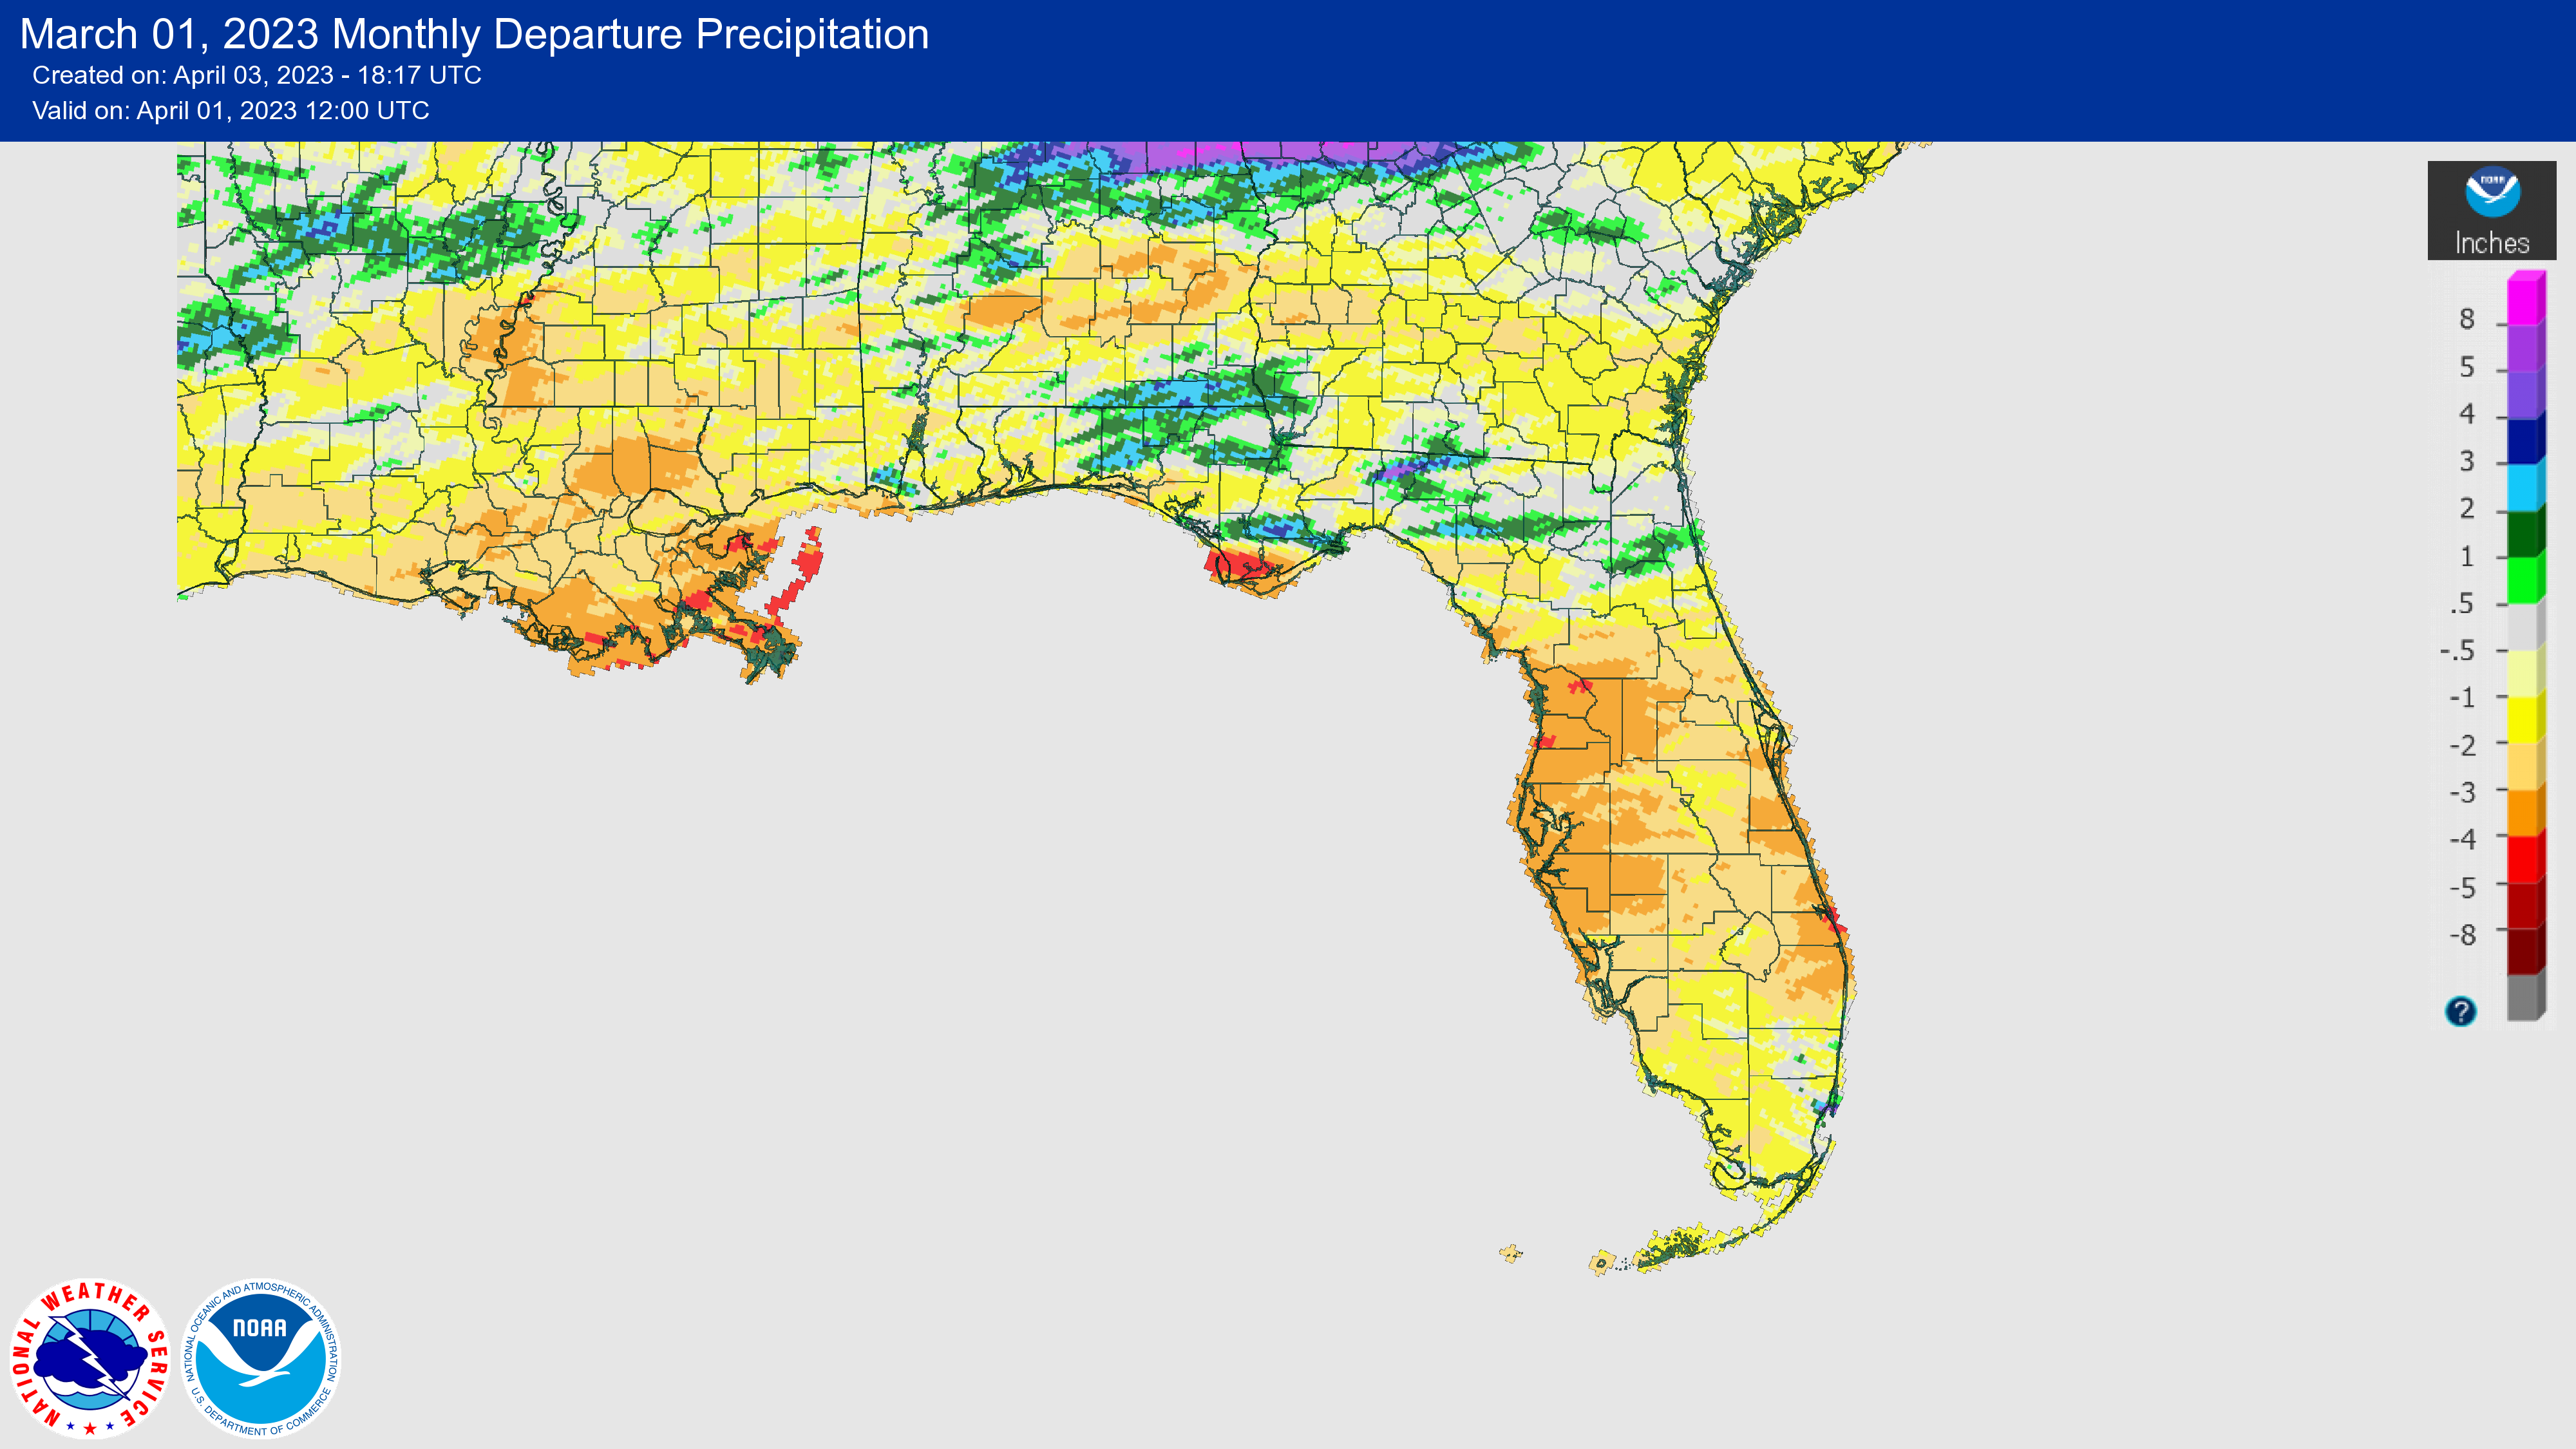
March was dry across the Peninsula and wet in some northern areas, including in the Big Bend region. The monthly precipitation departures from normal ranged from -3.19 inches in West Palm Beach to +2.04 inches in Miami (see Table 2 and Appendix 1 for additional locations). Much of the Peninsula received less than one-quarter of expected precipitation during the month of March, and West Palm Beach had its driest March on record. Venice had its 2nd-driest March on record, Bradenton had its 3rd-driest, and Orlando had its 4th-driest on record. With rainfall well below average, drought conditions expanded and intensified across the Peninsula during the month (see drought section below).
Table 2. March precipitation totals and departures from normal (inches) for selected cities.
| Station | Total Rainfall | Departure from Normal |
| Pensacola | 3.15 | -2.10 |
| Tallahassee | 3.46 | -1.78 |
| Jacksonville | 3.33 | +0.04 |
| Orlando | 0.33 | -2.70 |
| Tampa | 0.35 | -2.17 |
| Miami | 4.50 | +2.04 |
| Key West | 0.25 | -1.28 |
Figure 1. A graphical depiction of the monthly rainfall departure from normal (inches) for March (courtesy of NOAA, NWS).
Final La Niña Advisory Issued.
La Niña transitioned to ENSO-neutral conditions in February and NOAA issued the final La Niña advisory on March 9th. During the month of February, below-average sea surface temperatures continued to weaken and persisted only in the central Pacific Ocean by early March. The latest weekly Niño-3.4 index value was -0.2 ̊C; whereas, sea surface temperatures in the eastern Pacific Ocean were slightly above average. ENSO-neutral conditions currently exist and are expected to continue through the Northern Hemisphere spring and early summer. Models suggest a transition to El Niño conditions during summer, but large uncertainty remains beyond spring.
Hazardous Weather Events in March.
According to the Local Storm Reports issued by the local National Weather Service offices serving Florida, there were 107 individual local reports of hazardous weather events recorded across the state during the month of March (see Table 3 for a breakdown by event type). Dry, warm weather in March increased the threat of wildfires and wildfires were reported in Collier County early in the month, which destroyed several homes and outbuildings. Wildfires were also reported in Broward, Martin, and Volusia counties later in the month. Two fatalities occurred as a result of drowning from rip currents, both in Brevard County, and another fatality occurred when a tree fell on a car during a heavy thunderstorm in Leon County on the 10th.
Table 3. Breakdown of storm reports submitted in Florida during the month of March (compiled from Iowa State University/Iowa Environmental Mesonet).
| Report Type | Number of Reports |
| Heavy Rain | 0 |
| Flood | 2 |
| Dense Fog | 1 |
| Hail | 8 |
| Marine Thunderstorm Wind | 10 |
| Non-Thunderstorm Wind Gust | 35 |
| Non-Thunderstorm Wind Damage | 2 |
| Tornado/Waterspout/Funnel Cloud | 3/7/0 |
| Thunderstorm Wind Damage | 17 |
| Thunderstorm Wind Gust | 13 |
| Rip Currents | 2 |
| Wildfire | 7 |
Daily Record Events in March.
Table 4. Summary of daily records broken or set in Florida in March (source: NCEI Daily Weather Records).
| Category | Number of Records |
| Highest daily max. temp. | 98 |
| Highest daily min. temp. | 77 |
| Lowest daily max. temp. | 7 |
| Lowest daily min. temp. | 8 |
| Highest daily precipitation | 13 |
| Total | 203 |
Weather/Climate Highlight of the Month:
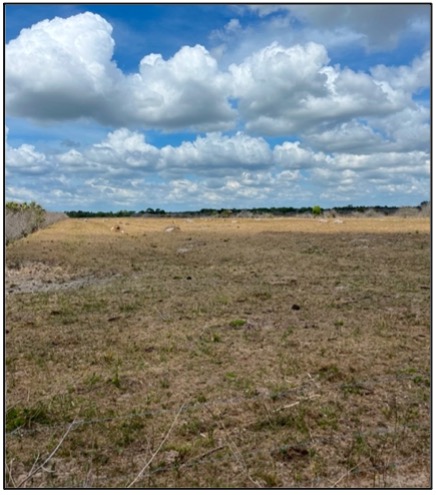
Extreme drought (D3) emerged in Florida this month for the first time since it briefly affected the state in October 2019. People began submitting drought condition monitoring reports as the month progressed. Reports have stated that excessively dry conditions are impacting pastures, resulting in poor crop yields, and requiring increased irrigation and supplemental feeding to maintain livestock. This photo was taken in Okeechobee County and submitted on April 3, 2023 by 5 L Cattle.
Drought-Related Impacts.
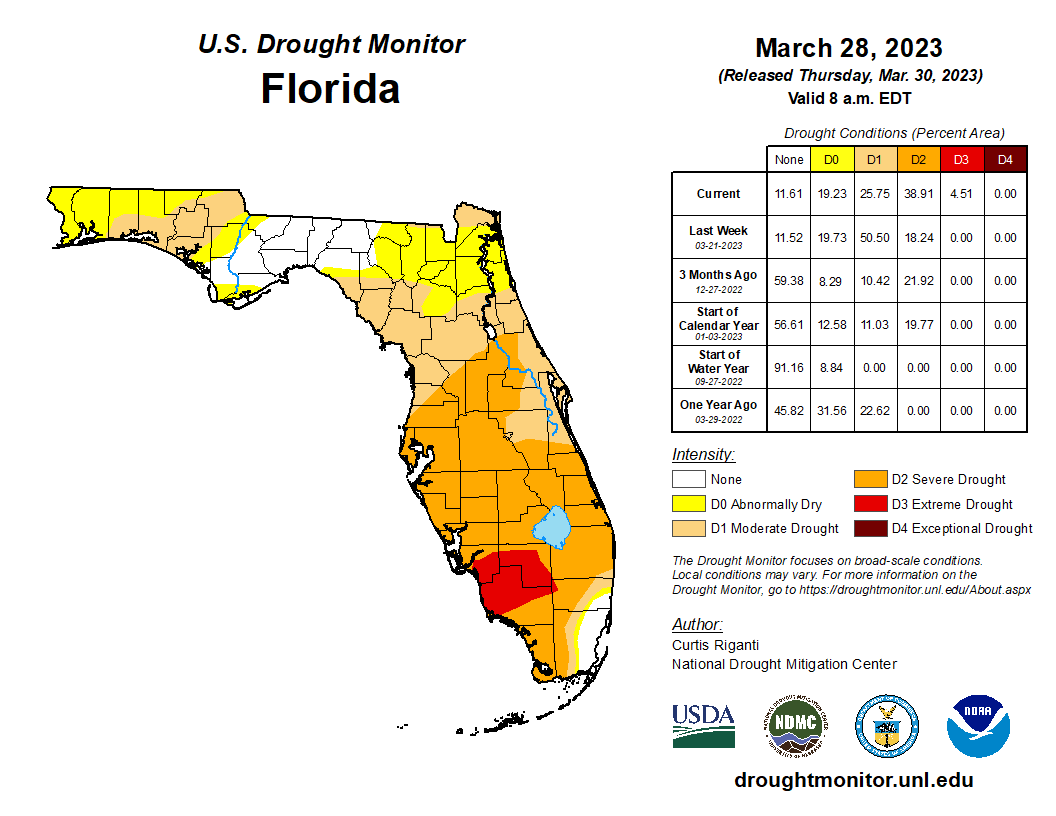
By the middle of March, moderate drought (D1) spread across the Florida Peninsula and severe drought (D2) emerged in southwest Florida. About 10% of the state was in severe drought (D2), 60% was in moderate drought (D1), and 21% was abnormally dry, according to the U.S. Drought Monitor. By the end of the month, degradation occurred across the Peninsula with the emergence of a pocket of extreme drought (D3) in southwest Florida. As of March 28, 4.5% of the state was in extreme drought (D3), 39% was in severe drought (D2), 26% of the state was in moderate drought (D1), and 19% was abnormally dry (Figure 3).
As of March 31, the Lake Okeechobee water level was 14.55 ft. above sea level (Feet-NGVD29), which is close to average for this time of year. At the first of the month, the water level was 15.50 ft. above sea level.
Figure 2. A graphical depiction of the latest drought conditions in Florida according to the U.S. Drought Monitor (courtesy of the National Drought Mitigation Center, University of Nebraska-Lincoln).
Agriculture-Related Impacts.
During March, the lack of precipitation in most of the state and above-normal temperatures worsened drought conditions across the Peninsula. Drought conditions adversely affected pastures and pasture conditions were reported as mostly poor to fair. Cattle were reported to be in mostly good to fair condition. Preparations for spring planting of row crops progressed well. Citrus grove activities included general maintenance and removal of dead trees. Drought has resulted in widespread irrigation. With unseasonably warm temperatures during February and March, a mid-month freeze event, which followed on a long period without freezing temperatures, resulted in fruit damage particularly in areas further north in central and southern Georgia. Chill hours for northern Florida and nearby areas are below last year’s accumulation and below historical averages. North Florida experienced only 1-3 days with temperatures at or below 32 ̊ F during March. Fruits and vegetables that were planted and harvested during the month included green beans, yellow squash, strawberries, watermelon, zucchini, sweet corn, pepper, and avocadoes. For more information, consult the Crop Progress - State Stories reports, which are produced monthly December through March by the USDA’s National Agricultural Statistics Service.
Appendix 1
Additional March departures from normal data for select Florida locations (Source: NWS).
| Station | Average Temperature (˚F) | Departure from Normal (˚F) | Total Rainfall (in.) | Departure from Normal (in.) |
| Gainesville | 66.4 | +3.7 | 4.68 | +1.19 |
| Sarasota | 71.6 | +3.5 | 0.18 | -2.67 |
| Melbourne | 72.6 | +4.0 | 1.16 | -1.53 |
| Fort Myers | 75.3 | +5.0 | 0.10 | -1.97 |
| West Palm Beach | 75.8 | +4.7 | 0.12 | -3.19 |
Appendix 2
Select daily record high maximum temperatures (°F) broken or tied during March (compiled from NOAA).
| Location | Date | Record | Broken/Tied | Last |
| Pensacola | 1 | 79 | Broken | 77 in 2012 |
| Key West | 1 | 90 | Broken | 85 in 2019 |
| Plant City | 2 | 90 | Broken | 89 in 2021 |
| Mayport | 2 | 86 | Broken | 85 in 1971 |
| Lakeland | 2 | 88 | Broken | 87 in 2019 |
| Clermont | 3 | 89 | Broken | 88 in 2019 |
| Pensacola | 3 | 80 | Broken | 76 in 1997 |
| Orlando | 3 | 90 | Tied | 90 in 2012 |
| Vero Beach | 3 | 91 | Broken | 89 in 2012 |
| Bradenton | 4 | 89 | Broken | 86 in 2020 |
| Clermont | 4 | 91 | Broken | 89 in 1961 |
| Jacksonville Beach | 4 | 88 | Broken | 87 in 1953 |
| Lisbon | 4 | 88 | Broken | 86 in 2001 |
| Daytona Beach | 4 | 90 | Broken | 88 in 1953 |
| Orlando | 4 | 91 | Broken | 89 in 2020 |
| Vero Beach | 4 | 91 | Broken | 90 in 2020 |
| Key West | 4 | 91 | Broken | 86 in 2020 |
| Pensacola | 4 | 81 | Broken | 80 in 1997 |
| Tallahassee | 4 | 87 | Broken | 86 in 1945 |
| Apalachicola | 5 | 79 | Broken | 77 in 2004 |
| Melbourne | 5 | 89 | Broken | 88 in 1982 |
| Miles City | 5 | 94 | Broken | 92 in 2003 |
| Key West | 5 | 92 | Broken | 87 in 2022 |
| Pensacola | 5 | 81 | Broken | 80 in 1974 |
| Tallahassee | 5 | 86 | Broken | 85 in 1955 |
| Kissimmee | 6 | 90 | Broken | 87 in 2015 |
| Panama City | 6 | 83 | Broken | 81 in 2022 |
| Quincy | 6 | 84 | Broken | 83 in 1976 |
| Orlando | 6 | 90 | Broken | 89 in 2003 |
| Fort Myers | 6 | 92 | Tied | 92 in 1944 |
| Miami | 6 | 91 | Broken | 88 in 2003 |
| Key West | 6 | 91 | Broken | 87 in 2022 |
| Tallahassee | 6 | 88 | Broken | 85 in 2003 |
| Apalachicola | 7 | 84 | Broken | 81 in 1945 |
| Clermont | 7 | 90 | Tied | 90 in 1961 |
| Fort Lauderdale | 7 | 91 | Broken | 89 in 1967 |
| Jacksonville Beach | 7 | 90 | Broken | 87 in 2022 |
| Gainesville | 7 | 88 | Broken | 87 in 2022 |
| Miami | 7 | 91 | Broken | 89 in 2003 |
| Jacksonville | 7 | 89 | Broken | 87 in 2022 |
| Pensacola | 7 | 86 | Broken | 83 in 1992 |
| Tallahassee | 7 | 88 | Broken | 84 in 1992 |
| Crestview | 7 | 87 | Broken | 86 in 1992 |
| Fort Lauderdale | 8 | 91 | Broken | 90 in 2003 |
| Niceville | 8 | 84 | Broken | 81 in 1951 |
| Miami | 8 | 90 | Broken | 88 in 2003 |
| Key West | 9 | 92 | Broken | 88 in 2022 |
| West Palm Beach | 13 | 94 | Broken | 93 in 2001 |
| Fort Myers | 23 | 90 | Tied | 90 in 2017 |
| Orlando | 25 | 92 | Broken | 91 in 2021 |
| Daytona Beach | 25 | 90 | Broken | 88 in 2021 |
| Jacksonville Beach | 26 | 88 | Broken | 86 in 2021 |
| Orlando | 26 | 92 | Broken | 89 in 2021 |
| Lisbon | 28 | 90 | Broken | 89 in 2021 |
| West Palm Beach | 28 | 91 | Broken | 88 in 2021 |
| Fort Lauderdale | 30 | 88 | Broken | 85 in 2021 |
| Venice | 31 | 90 | Broken | 88 in 2002 |
Prepared by Florida Climate Center
The Florida State University
Tallahassee, FL
Key Points:
- Monthly average temperatures were well above normal in February, and it was among the warmest months of February on record for many locations.
- Monthly precipitation totals were generally below normal for the month, with exceptions along the southeastern coast and Big Bend regions.
- Severe drought improved in north-central Florida by mid-month, but moderate drought expanded across the Peninsula during the month
- La Niña conditions in the equatorial Pacific Ocean weakened, and a transition to ENSO-neutral is expected during the spring to early summer timeframe.
Average monthly temperatures in February were well above normal across the state. Average temperature departures from normal ranged from +4.3 ̊F in Key West to +8.2 ̊F in Tallahassee for the month (see Table 1 and Appendix 1 for select cities). Many stations recorded one of their warmest months of February on record. Fort Lauderdale had its warmest February on record this year, based on the monthly mean average temperature. Pensacola, Tallahassee, Jacksonville, Daytona Beach, Miami, and Fort Myers all had their 2nd-warmest February on record, based on monthly mean average temperatures. In addition, many stations across the state had one of their top three warmest months of February on record based on monthly average maximum temperatures. Select daily high maximum temperature records tied or broken during the month are provided in Appendix 2.
Table 1. February average temperatures and departures from normal ( ̊F) for selected cities.
| Station | Mean Temperature | Departure from Normal |
| Pensacola | 64.6 | +7.8 |
| Tallahassee | 63.8 | +8.2 |
| Jacksonville | 65.5 | +8.0 |
| Orlando | 70.0 | +6.4 |
| Tampa | 70.3 | +5.6 |
| Miami | 75.9 | +5.2 |
| Key West | 76.6 | +4.3 |
February was dry overall across the state, with monthly rainfall totals below normal except along the southeast coast and a portion of the Big Bend region. The monthly precipitation departures from normal ranged from -2.44 inches in Pensacola to +3.57 inches in Miami (see Table 2 and Appendix 1 for additional locations). While we are in the dry season, the southwest coast was especially dry during the month. Naples recorded no precipitation during February, and Key West received less than a tenth of rainfall during the month, making it the driest February on record in both locations. Only portions of the Big Bend and southeast Florida received above-average monthly rainfall totals, and Miami and Ft. Lauderdale both observed their 4th-wettest February on record. As a result of drier than normal conditions and above-average temperatures, moderate drought expanded across the Peninsula during the month (see below).
Table 2. February precipitation totals and departures from normal (inches) for selected cities.
| Station | Total Rainfall | Departure from Normal |
| Pensacola | 2.33 | -2.44 |
| Tallahassee | 3.89 | -0.39 |
| Jacksonville | 1.42 | -1.44 |
| Orlando | 0.55 | -1.49 |
| Tampa | 0.46 | -2.16 |
| Miami | 5.72 | +3.57 |
| Key West | 0.01 | -1.53 |
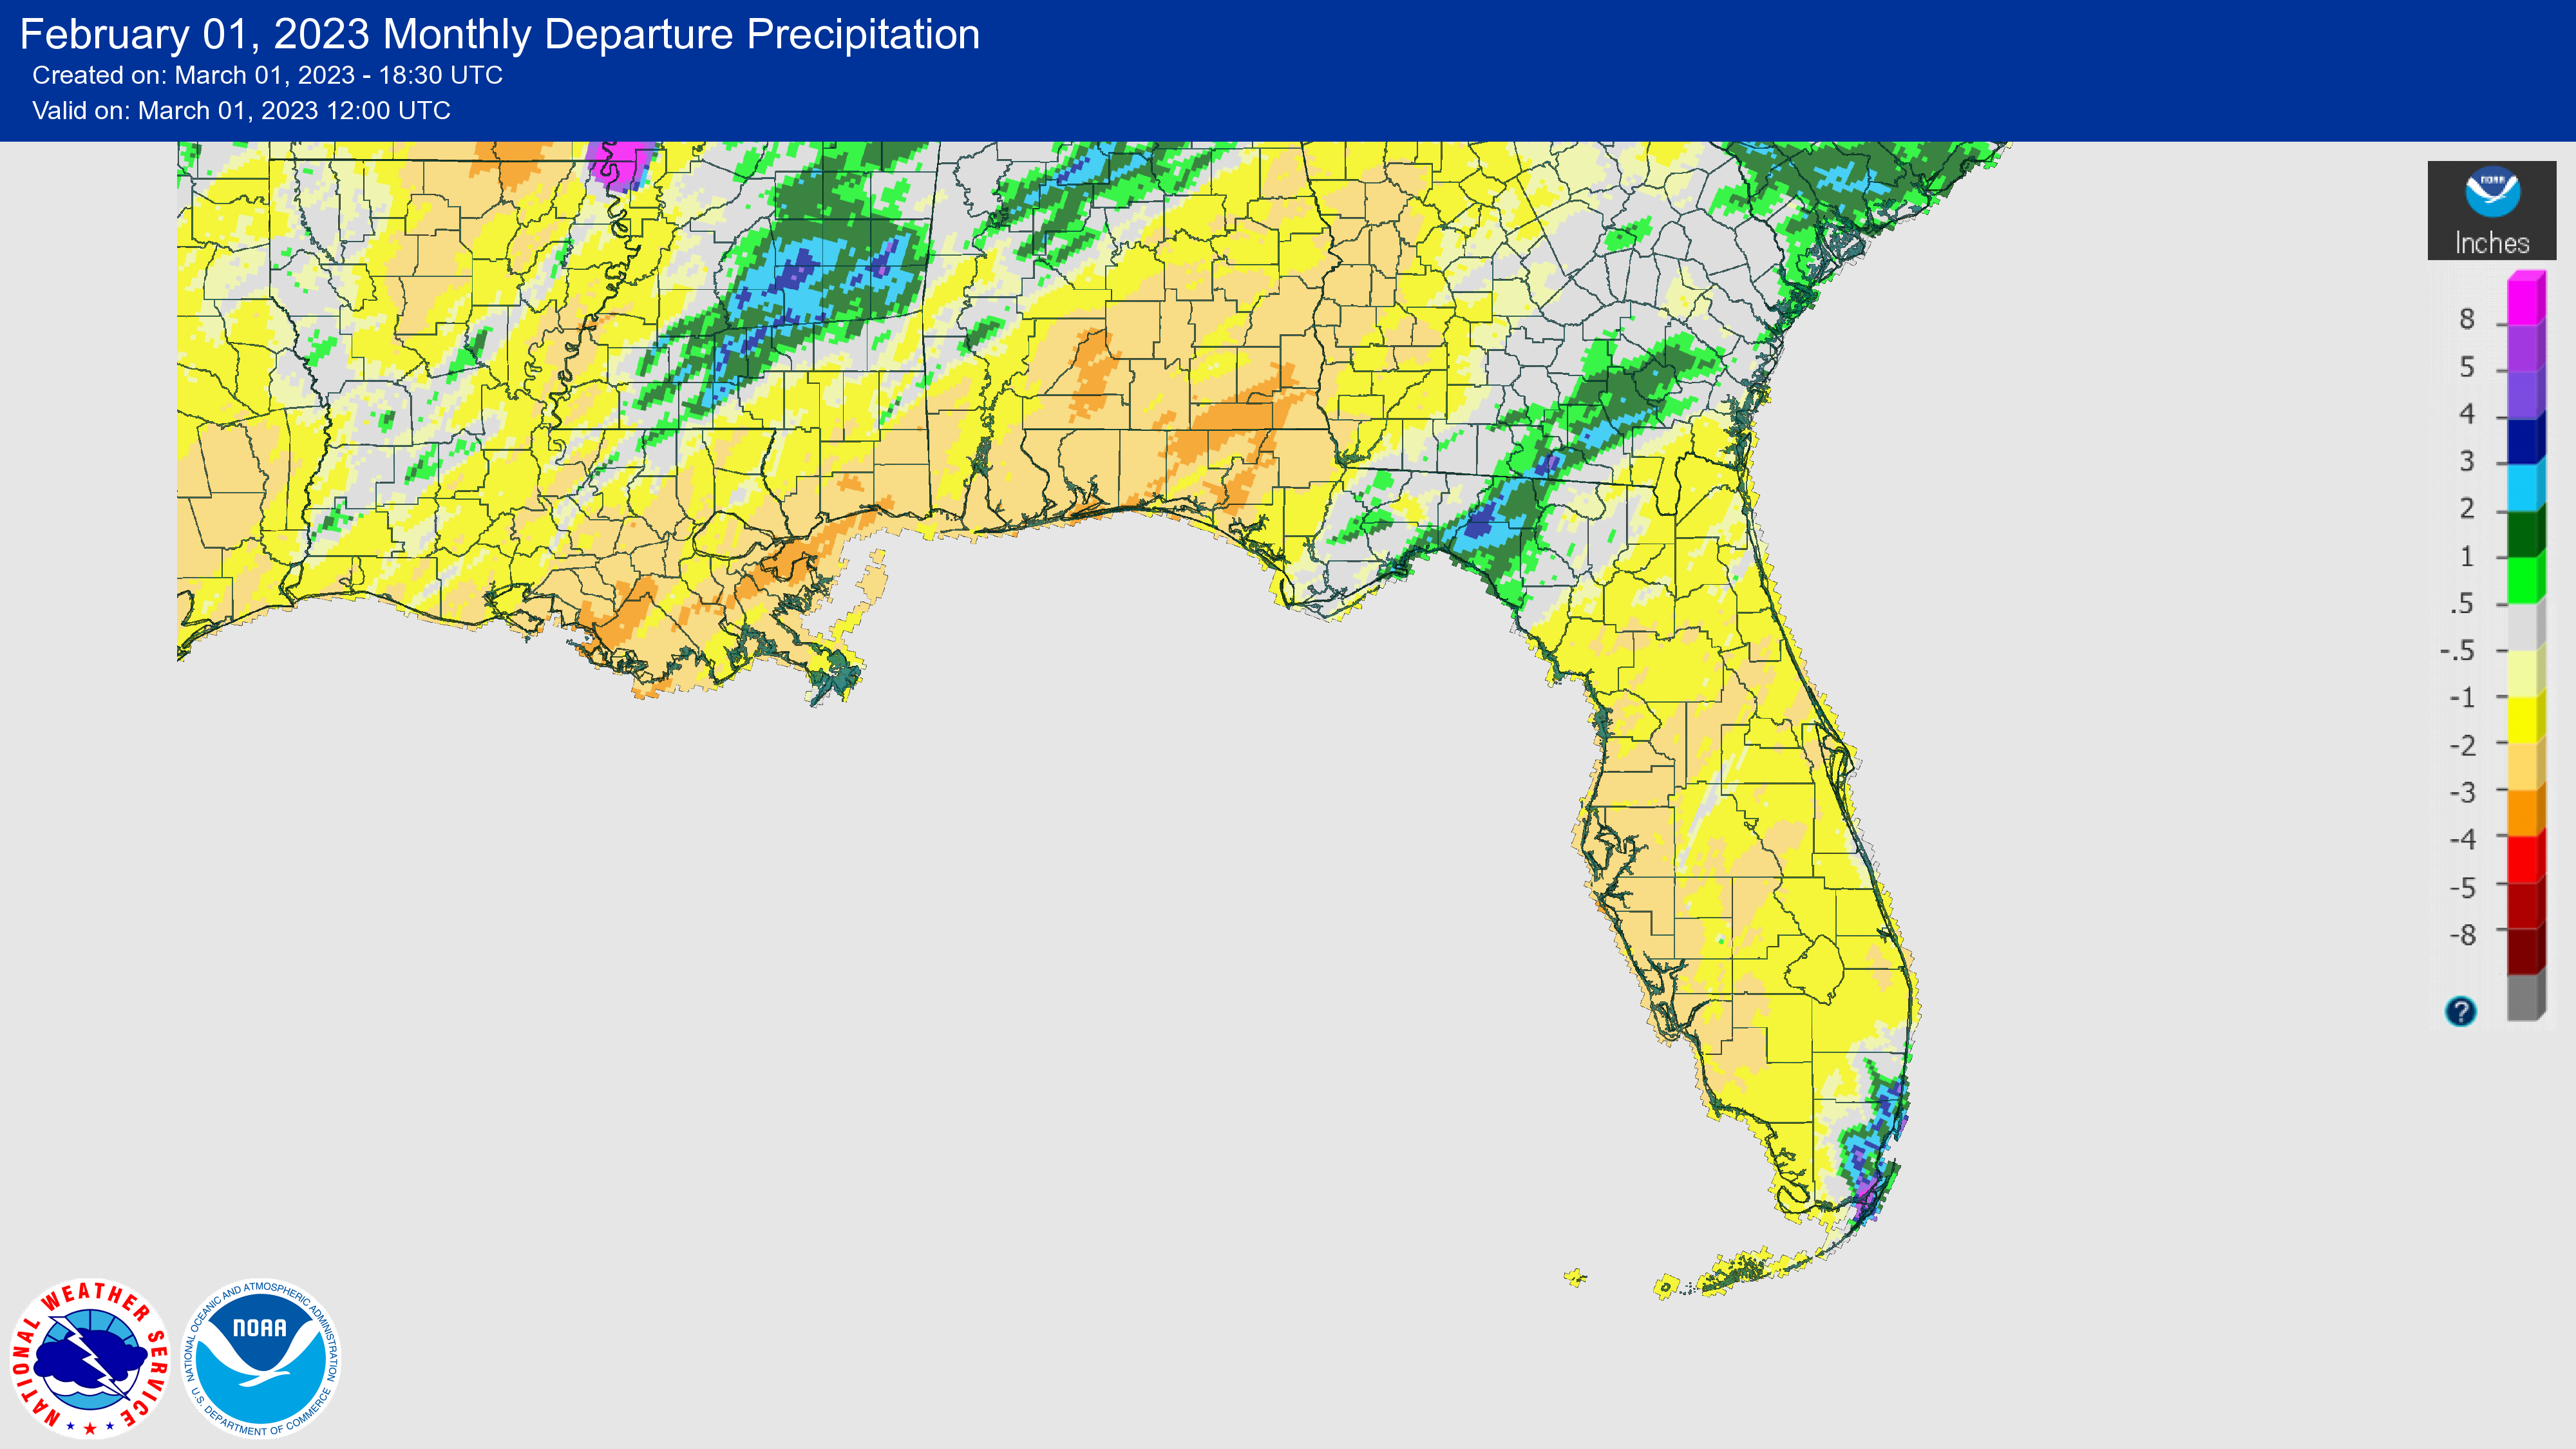
Figure 1. A graphical depiction of the monthly rainfall departure from normal (inches) for February (courtesy of NOAA, NWS).
La Niña Weakens with a Transition to ENSO-Neutral Expected.
A weak La Niña was still in place throughout the month with signs of weakening. Sea surface temperatures in the eastern equatorial Pacific Ocean were not as cold as they have been, with the latest Niño index values generally near -0.5°C; sub-surface temperatures warmed too. There is forecaster consensus that La Niña is expected to continue to weaken and transition to ENSO-neutral conditions during spring to early summer, during the March through May period. Models suggest a transition to El Niño conditions during summer, but large uncertainty remains beyond spring.
Hazardous Weather Events in February.
According to the Local Storm Reports issued by the local National Weather Service offices serving Florida, there were 64 individual local reports of hazardous weather events recorded across the state during the month of February (see Table 4 for a breakdown by event type). Unfortunately four fatalities were reported during the month, each as a result of rip currents.
Table 4. Breakdown of storm reports submitted in Florida during the month of February (compiled from Iowa State University/Iowa Environmental Mesonet).
| Report Type | Number of Reports |
| Heavy Rain | 10 |
| Flood | 0 |
| Coastal Flood | 0 |
| Hail | 0 |
| Marine Thunderstorm Wind | 3 |
| Non-Thunderstorm Wind Gust | 30 |
| Non-Thunderstorm Wind Damage | 3 |
| Tornado/Waterspout/Funnel Cloud | 1/2/0 |
| Thunderstorm Wind Damage | 0 |
| Thunderstorm Wind Gust | 11 |
| Rip Currents | 4 |
Daily Record Events in February.
Table 5.Summary of daily records broken or set in Florida in February (source: NCEI Daily Weather Records).
| Category | Number of Records |
| Highest daily max. temp. | 100 |
| Highest daily min. temp. | 58 |
| Lowest daily max. temp. | 0 |
| Lowest daily min. temp. | 0 |
| Highest daily precipitation | 10 |
| Total | 168 |
Weather/Climate Highlight of the Month:
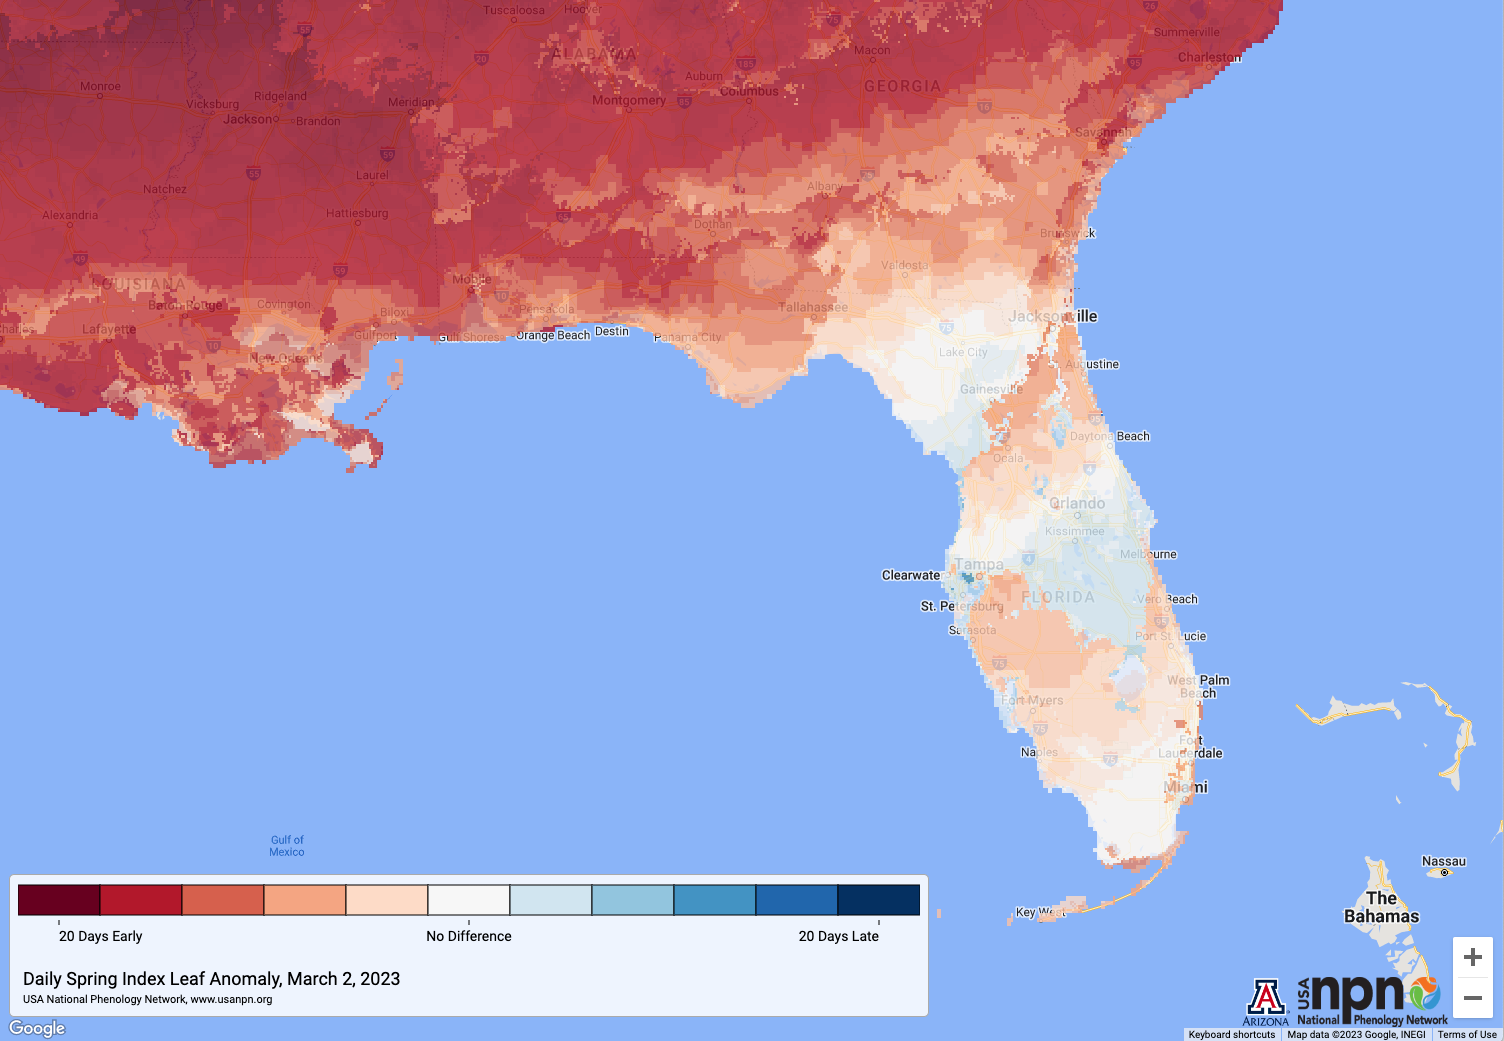
February temperatures were well above average, especially during the second half of the month. As a result of unseasonably warm temperatures, spring leaf out came anomalously early by several weeks in parts of the Southeast U.S., including about a week early in the Florida Panhandle; the Florida Peninsula was close to normal (Figure 2).
Figure 2. Daily spring index leaf anomaly, which shows the difference in days between the current daily spring index and the 30-year average spring index for first leaf, based on data from the National Centers for Environmental Prediction (Source: USA National Phenology Network).
Drought-Related Impacts.
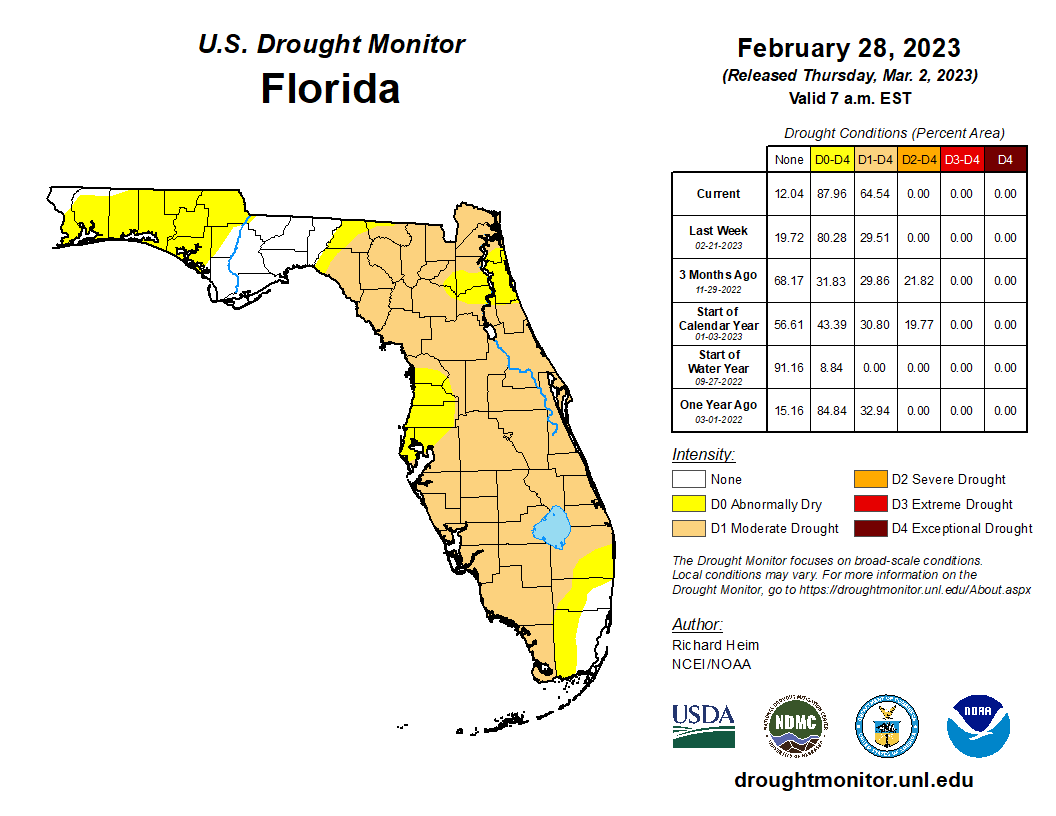
By the middle of February, severe drought (D2) conditions were removed from the Big Bend region, but moderate drought (D1) spread across north-central Florida. About 30% of the state was in moderate drought (D1) and 38% was abnormally dry, according to the U.S. Drought Monitor. By the end of the month, degradation occurred across the Peninsula with the continuation of above-average warmth and drier than normal conditions. As of February 28th, 65% of the state was in moderate drought (D1) and 23% was abnormally dry (Figure 3 below).
As of February 28, the Lake Okeechobee water level was 15.54 ft. above sea level (Feet-NGVD29), which is above average for this time of the year. At the first of the month, the water level was 16.01 ft. above sea level.
Figure 3. A graphical depiction of the latest drought conditions in Florida according to the U.S. Drought Monitor (courtesy of the National Drought Mitigation Center, University of Nebraska-Lincoln).
Agriculture-Related Impacts.
During February, the lack of precipitation and worsening drought conditions across the Peninsula negatively impacted pastures. Pasture conditions were reported as mostly poor to fair. However, the dry weather helped the progress of sugarcane harvesting. Preparations for spring planting of row crops began during the second half of the month. Citrus grove activities continued and included general maintenance and removal of dead trees; dry weather also resulted in increased irrigation for citrus. With unseasonably warm temperatures during February, chill hours for northern Florida and nearby areas are below last year’s accumulation and much less than historical averages. North Florida experienced only 1-2 days with temperatures at or below 32F during the month. The recent warm weather has resulted in early leaf out and the blooming of many fruits across the region. Several fruits and vegetables were planted and harvested during the month, such as green beans, yellow squash, potatoes, strawberries, sweet corn, pepper, and avocadoes. Rice planting began as well. For more information, consult the Crop Progress - State Stories reports, which are produced monthly December through March by the USDA’s National Agricultural Statistics Service.
Appendix 1
Additional February departures from normal data for select Florida locations (Source: NWS).
| Station | Average Temperature (˚F) | Departure from Normal (˚F) | Total Rainfall (in.) | Departure from Normal (in.) |
| Gainesville | 65.6 | +7.2 | 2.46 | -0.21 |
| Sarasota | 69.4 | +4.6 | 0.15 | -1.77 |
| Melbourne | 69.9 | +4.5 | 1.61 | -0.37 |
| Fort Myers | 73.6 | +6.3 | 0.07 | -1.71 |
| West Palm Beach | 74.1 | +5.7 | 1.14 | -1.49 |
Appendix 2
Select daily record high maximum temperatures (°F) broken or tied during February (compiled from NOAA).
| Location | Date | Record | Broken/Tied | Last |
| Hastings | 1 | 85 | Tied | 85 in 2002 |
| Miami | 1 | 85 | Broken | 84 in 1990 |
| Key West | 1 | 89 | Broken | 83 in 2007 |
| Fort Lauderdale | 2 | 84 | Broken | 83 in 2014 |
| Jacksonville Beach | 2 | 84 | Broken | 83 in 1985 |
| Key West | 2 | 89 | Broken | 85 in 2007 |
| Miami | 3 | 88 | Broken | 85 in 1985 |
| Vero Beach | 3 | 87 | Broken | 83 in 2019 |
| West Palm Beach | 3 | 87 | Broken | 86 in 1985 |
| Key West | 3 | 90 | Broken | 85 in 2022 |
| Fort Lauderdale | 4 | 89 | Broken | 87 in 2007 |
| Key West | 6 | 89 | Broken | 85 in 1997 |
| Key West | 7 | 89 | Broken | 83 in 2019 |
| Pensacola | 8 | 77 | Broken | 75 in 1994 |
| Key West | 8 | 90 | Broken | 86 in 2022 |
| Gainesville | 9 | 85 | Broken | 83 in 1990 |
| Key West | 9 | 91 | Broken | 84 in 1994 |
| Usher Tower | 10 | 85 | Broken | 82 in 2018 |
| Key West | 11 | 90 | Broken | 85 in 2020 |
| Crestview | 15 | 80 | Broken | 78 in 2018 |
| Clermont | 17 | 88 | Broken | 86 in 2001 |
| Jacksonville Beach | 17 | 87 | Broken | 83 in 1945 |
| Orlando | 17 | 88 | Broken | 87 in 1990 |
| Daytona Beach | 17 | 87 | Tied | 87 in 1975 |
| Lakeland | 17 | 88 | Broken | 87 in 1990 |
| Jacksonville | 17 | 86 | Broken | 83 in 2022 |
| Melbourne | 18 | 88 | Broken | 86 in 2001 |
| Vero Beach | 20 | 88 | Broken | 86 in 1988 |
| Clermont | 23 | 89 | Broken | 88 in 2018 |
| Jacksonville Beach | 23 | 88 | Broken | 83 in 2012 |
| Naples | 23 | 89 | Tied | 89 in 2019 |
| Miles City | 23 | 92 | Broken | 90 in 2006 |
| Pensacola | 23 | 80 | Broken | 78 in 1975 |
| Key West | 23 | 92 | Broken | 88 in 1997 |
| Pensacola | 23 | 83 | Broken | 79 in 2017 |
| Tallahassee | 23 | 84 | Broken | 83 in 2022 |
| Jacksonville | 23 | 89 | Broken | 84 in 2019 |
| Hastings | 24 | 87 | Broken | 84 in 2022 |
| Tampa | 24 | 88 | Broken | 87 in 2022 |
| Fort Myers | 24 | 90 | Broken | 89 in 2022 |
| Tallahassee | 24 | 86 | Broken | 84 in 1944 |
| Clermont | 25 | 89 | Tied | 89 in 2019 |
| Miles City | 25 | 90 | Broken | 88 in 2022 |
| Pensacola | 25 | 83 | Broken | 82 in 2011 |
| Jacksonville Beach | 26 | 90 | Broken | 84 in 1972 |
| Pensacola | 26 | 79 | Broken | 77 in 2001 |
| Miami | 26 | 87 | Tied | 87 in 2015 |
| Key West | 26 | 88 | Broken | 86 in 2022 |
| Crestview | 26 | 84 | Broken | 82 in 2021 |
| Tallahassee | 26 | 85 | Broken | 83 in 2022 |
| Jacksonville | 26 | 87 | Tied | 87 in 1962 |
| Jacksonville Beach | 27 | 85 | Broken | 84 in 1945 |
| Key West | 27 | 89 | Broken | 86 in 1997 |
| Pensacola | 27 | 81 | Broken | 80 in 1981 |
| Pensacola | 28 | 84 | Broken | 79 in 2021 |
Prepared by Florida Climate Center
The Florida State University
Tallahassee, FL
Key Points:
- Monthly mean temperatures in June were near normal for the month.
- Monthly precipitation totals for June were mixed, with above normal rainfall in southeast and north-central Florida and below normal rainfall in southwest Florida and the central Panhandle.
- Drought conditions improved across the state during the month, and by mid-month drought had been removed with lingering abnormally dry conditions along the west-central coast.
- An El Niño Advisory went into effect in June and El Niño conditions are expected to strengthen in the tropical Pacific in the coming months.
- Short-lived Tropical Storm Arlene formed in the Gulf of Mexico early in the month, while two tropical storms formed in the eastern Atlantic Ocean, Bret and Cindy, which is more typical of August for this part of the Atlantic Basin.
Average monthly temperatures in June were near normal across the state. Average temperature departures from normal ranged from -0.8 ̊F in Melbourne to +1.3 ̊F in Key West for the month (see Table 1 and Appendix 1 for select cities). Many places came close to reaching triple-digit temperatures near the end of the month, including Tallahassee which peaked at 99 ̊F on the 28th. Statewide, June ranked 29th warmest on record for Florida. However, Florida continues to see its hottest year on record so far, from January through June. Select daily high maximum temperature records tied or broken during the month are provided in Appendix 2.
| Station | Mean Temperature | Departure from Normal |
| Pensacola | 81.6 | -0.1 |
| Tallahassee | 80.9 | +0.1 |
| Jacksonville | 80.1 | -0.2 |
| Orlando | 82.1 | +0.9 |
| Tampa | 83.2 | +0.3 |
| Miami | 83.7 | +0.9 |
| Key West | 85.4 | +1.3 |
Monthly rainfall totals across the state in June were mixed. Above normal rainfall occurred in southeast and Big Bend regions of Florida and below normal rainfall affected southwest Florida and the central Panhandle. The monthly precipitation departures from normal ranged from -4.67 inches in Sarasota to +10.36 inches in Cross City (see Table 2 and Appendix 1 for select locations). Cross City experienced its wettest June on record, with a monthly rainfall total of 17.51 inches. Several other locations had one of their top 5 wettest Junes on record, including Lakeland (3rd-wettest), Gainesville (5th-wettest), Ocala (5th-wettest), and Vero Beach (5th-wettest). Pensacola had its 7th-wettest June on record, with much of its monthly rainfall falling in a single heavy rain event on the 15th, which produced 9.30 inches of rain mostly in a 6-hour period.
Table 2. June precipitation totals and departures from normal (inches) for selected cities.
| Station | Total Rainfall | Departure from Normal |
| Pensacola | 13.82 | +6.50 |
| Tallahassee | 5.65 | -2.11 |
| Jacksonville | 7.63 | +0.03 |
| Orlando | 7.31 | -0.74 |
| Tampa | 4.20 | -3.17 |
| Miami | 7.87 | -2.64 |
| Key West | 2.85 | -1.38 |
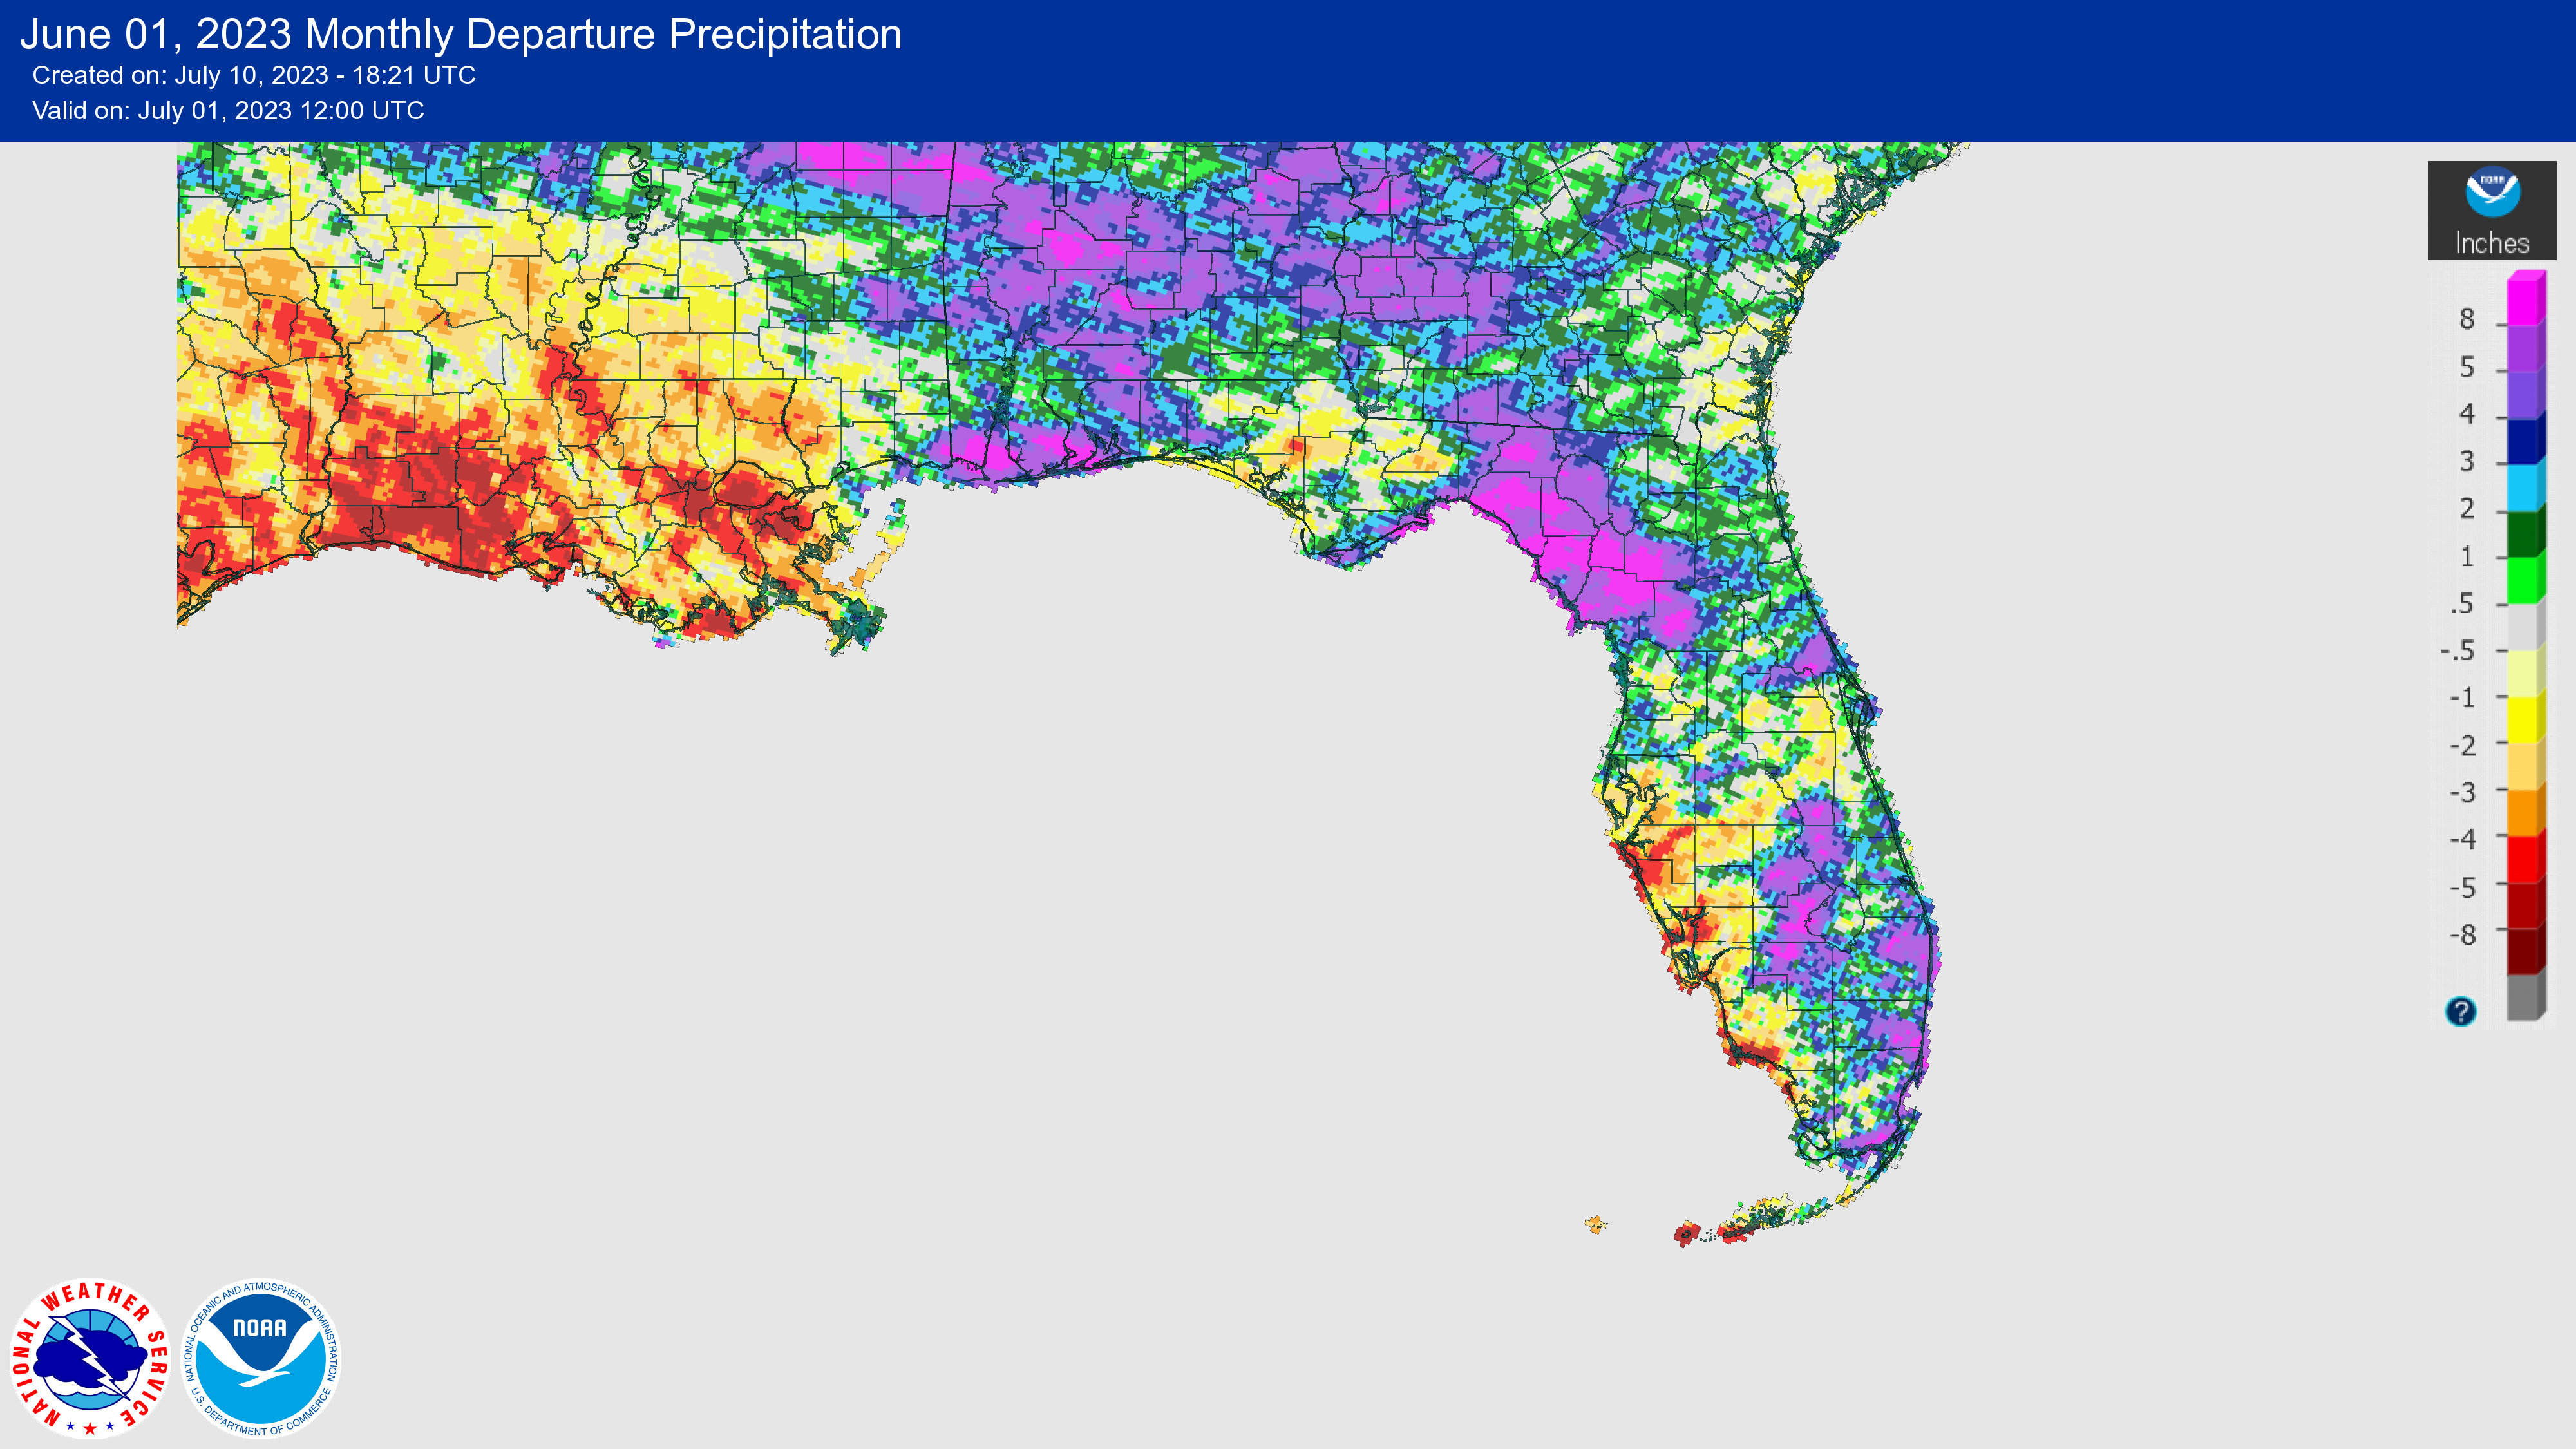
Figure 1. A graphical depiction of the monthly rainfall departure from normal (inches) for June (courtesy of NOAA, NWS).
El Niño Advisory.
An El Niño, the warm phase of the El Niño Southern Oscillation, developed in the tropical Pacific Ocean in June. The coupled ocean-atmosphere system reflected emerging El Niño conditions in May, including anomalous warmth in sea surface temperatures and below the surface of the equatorial Pacific Ocean. El Niño conditions are expected to gradually strengthen through the Northern Hemisphere winter. By the end of the year (November-January), there is an 84% chance of at least a moderate El Niño event (Niño-3.4 ≥ 1.0°C), and about a 56% chance of a strong El Niño (Niño-3.4 ≥ 1.5°C), according to the Climate Prediction Center at NOAA. This means that El Niño conditions are expected during the peak of the Atlantic Hurricane Season, August-October.
Hazardous Weather Events in June.
According to the Local Storm Reports issued by the local National Weather Service offices serving Florida, there were 1,032 individual local reports of hazardous weather events recorded across the state during the month of June (see Table 4 for a breakdown by event type). An active weather pattern continued in June with many severe weather reports submitted across the state, especially in the Panhandle and northern Florida regions. One lightning-related hospitalization was reported on the 1st of the month. 9 fatalities due to rip currents were reported. These included mostly out-of-town vacationers and occurred in Volusia County on the 2nd, Bay County on the 15th, 18th, 21st and 24th, and Walton County on the 22nd and 24th. Another fatality occurred in Escambia on the 16th due to downed limbs that fell on a manufactured home during a severe thunderstorm with an embedded small tornado. Heavy rain and thunderstorms generated nearly a foot of rain in a 3-hour period on the 16th in Escambia County as well, leading to flash flooding with rainfall totals of 14+ inches over a 6-hour period. A brief EF-2 tornado impacted Pensacola Beach on the same day, causing significant damage to homes and boats but no injuries or fatalities were reported. Golf ball sized hail was reported in Flagler County on the 19th.
Table 3. Breakdown of storm reports submitted in Florida during the month of June (compiled from Iowa State University/Iowa Environmental Mesonet).
| Report Type | Number of Reports |
| Heavy Rain | 42 |
| Flood | 24 |
| Flash Flood | 27 |
| Coastal Flood | 3 |
| Hail | 51 |
| Lightning | 1 |
| High Sustained Wind | 1 |
| Non-Thunderstorm Wind Gust | 22 |
| Non-Thunderstorm Wind Damage | 0 |
| Tornado/Waterspout/Funnel Cloud | 5/31/8 |
| Thunderstorm Wind Damage | 218 |
| Thunderstorm Wind Gust | 587 |
| Rip Currents | 11 |
| Wildfire | 1 |
Daily Record Events in June.
Table 4. Summary of daily records broken or set in Florida in June (source: NCEI Daily Weather Records).
| Category | Number of Records |
| Highest daily max. temp. | 16 |
| Highest daily min. temp. | 11 |
| Lowest daily max. temp. | 6 |
| Lowest daily min. temp. | 2 |
| Highest daily precipitation | 31 |
| Total | 66 |
Weather/Climate Highlight of the Month:
Tropical Storm Arlene formed in the Gulf of Mexico at the start of the Atlantic hurricane season on June 2. The storm drifted southward and quickly weakened as it entered unfavorable conditions for development. Two other early season tropical storms formed in the eastern Atlantic Ocean during the month, Bret and Cindy, which is not typical in this part of the Atlantic until August. Neither storm impacted the U.S. Sea surface temperatures in the Atlantic and Gulf of Mexico have been above average this summer and exceptionally warm.
Drought-Related Impacts.
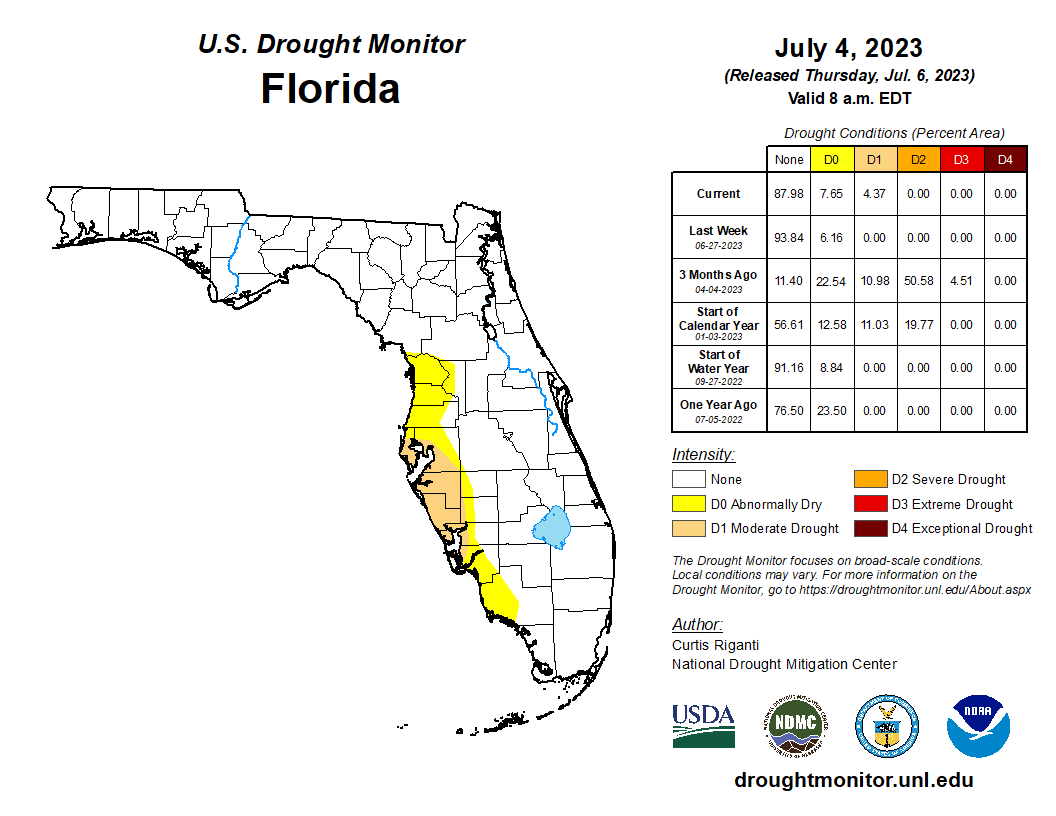
By the middle of June, moderate drought (D1) continued to affect the western central coast of Florida. About 9% of the state was in moderate drought and 8% was abnormally dry, according to the U.S. Drought Monitor. By month’s end, moderate drought (D1) and abnormally dry conditions lingered along the west coast of the Peninsula but with slight improvements. As of July 4th, 4% of the state was in moderate drought (D1), and about 8% of the state was abnormally dry (D0) (Figure 2).
As of June 30, the Lake Okeechobee water level was 14.64 ft. above sea level (Feet-NGVD29), which is above average for this time of year. At the first of the month, the water level was 13.89 ft. above sea level.
Figure 2. A graphical depiction of the latest drought conditions in Florida according to the U.S. Drought Monitor (courtesy of the National Drought Mitigation Center, University of Nebraska-Lincoln).
Agriculture-Related Impacts.
In mid-June, topsoil moisture conditions were adequate in 58% of the state, short in 22%, and very short in 9% of the state, while 11% of the state was experiencing surplus topsoil moisture conditions. By the end of June, topsoil moisture conditions were adequate in 74% of the state, short in 6%, and very short in 1% of the state; 19% of the state was in surplus. For more information, consult the Crop Progress and Conditions Report, which is published by the USDA’s National Agricultural Statistics Service.
Appendix 1
Additional June departures from normal data for select Florida locations (Source: NWS).
| Station | Average Temperature (˚F) | Departure from Normal (˚F) | Total Rainfall (in.) | Departure from Normal (in.) |
| Gainesville | 79.6 | -0.3 | 11.79 | +4.23 |
| Sarasota | 82.9 | +1.1 | 2.38 | -4.67 |
| Melbourne | 81.1 | -0.8 | 6.00 | -1.10 |
| Fort Myers | 83.5 | +1.2 | 6.14 | -3.52 |
| West Palm Beach | 82.3 | +0.6 | 12.39 | +3.91 |
Appendix 2
Select daily record high maximum temperatures (°F) broken or tied during June (compiled from NOAA).
| Location | Date | Record | Broken/Tied | Last |
| Canal Point | 13 | 96 | Tied | 96 in 2006 |
| Canal Point | 15 | 97 | Broken | 96 in 2016 |
| Clermont | 15 | 99 | Broken | 98 in 2022 |
| Fort Pierce | 16 | 97 | Broken | 96 in 1911 |
| Key West | 16 | 94 | Broken | 93 in 1951 |
| Miami | 16 | 95 | Broken | 94 in 2011 |
| Fort Lauderdale Beach | 19 | 95 | Broken | 94 in 2016 |
| Plant City | 19 | 99 | Broken | 98 in 1998 |
| Miami | 19 | 94 | Broken | 93 in 2011 |
| Fort Lauderdale Beach | 20 | 94 | Broken | 93 in 1958 |
| Plant City | 29 | 100 | Broken | 99 in 2020 |
| Key West | 29 | 94 | Broken | 92 in 2015 |
| Miami | 29 | 95 | Broken | 94 in 2020 |
| Clermont | 30 | 99 | Broken | 98 in 2014 |
| Tampa | 30 | 96 | Tied | 96 in 2014 |
| Venice | 30 | 95 | Broken | 94 in 2015 |
Building A, Suite 292
Tallahassee, FL 32306-2741
Phone: (850) 644-3417 | (850) 644-0719
climate@coaps.fsu.edu