


The Florida Climate Center serves as the primary resource for climate data, information, and services in the state of Florida.

The Florida Climate Center achieves its mission by providing climate monitoring, research, and expertise to be applied by the people, institutions, and businesses of Florida and the surrounding region.
We provide direct service by fulfilling requests for climate and weather data and information in a variety of formats.
We perform research that advances the understanding of the climate variability and changes of Florida and the surrounding region.
We provide outreach in presentations and at events aimed at a variety of groups, interests, and ages.
Prepared by Florida Climate Center
The Florida State University
Tallahassee, FL

Key Points:
- January average temperatures were above normal statewide for the month.
- Monthly precipitation totals were below normal for the month.
- Drought conditions improved in the Panhandle during the month but persisted in the Big Bend region; the Peninsula became abnormally dry by month’s end.
- La Niña conditions in the equatorial Pacific Ocean weakened, and a transition to ENSO-neutral is expected over the next couple of months.
Average monthly temperatures in January were above normal across the state. Average temperature departures from normal ranged from +1.3 ̊F in Melbourne to +6.8 ̊F in Pensacola for the month (see Table 1 and Appendix 1 for select cities). Following a cold end to December, mean average temperatures in January were well above normal during the beginning of the month. During the first week, departures from normal ranged from +5 ̊F in south Florida to +13 ̊F in the western Panhandle. Select daily high maximum temperature records tied or broken during the month are provided in Appendix 2.
Table 1. January average temperatures and departures from normal ( ̊F) for selected cities.
| Station | Mean Temperature | Departure from Normal |
| Pensacola | 60.0 | +6.8 |
| Tallahassee | 57.5 | +5.3 |
| Jacksonville | 58.0 | +3.8 |
| Orlando | 64.4 | +3.8 |
| Tampa | 64.6 | +2.6 |
| Miami | 72.1 | +3.5 |
| Key West | 72.6 | +2.0 |
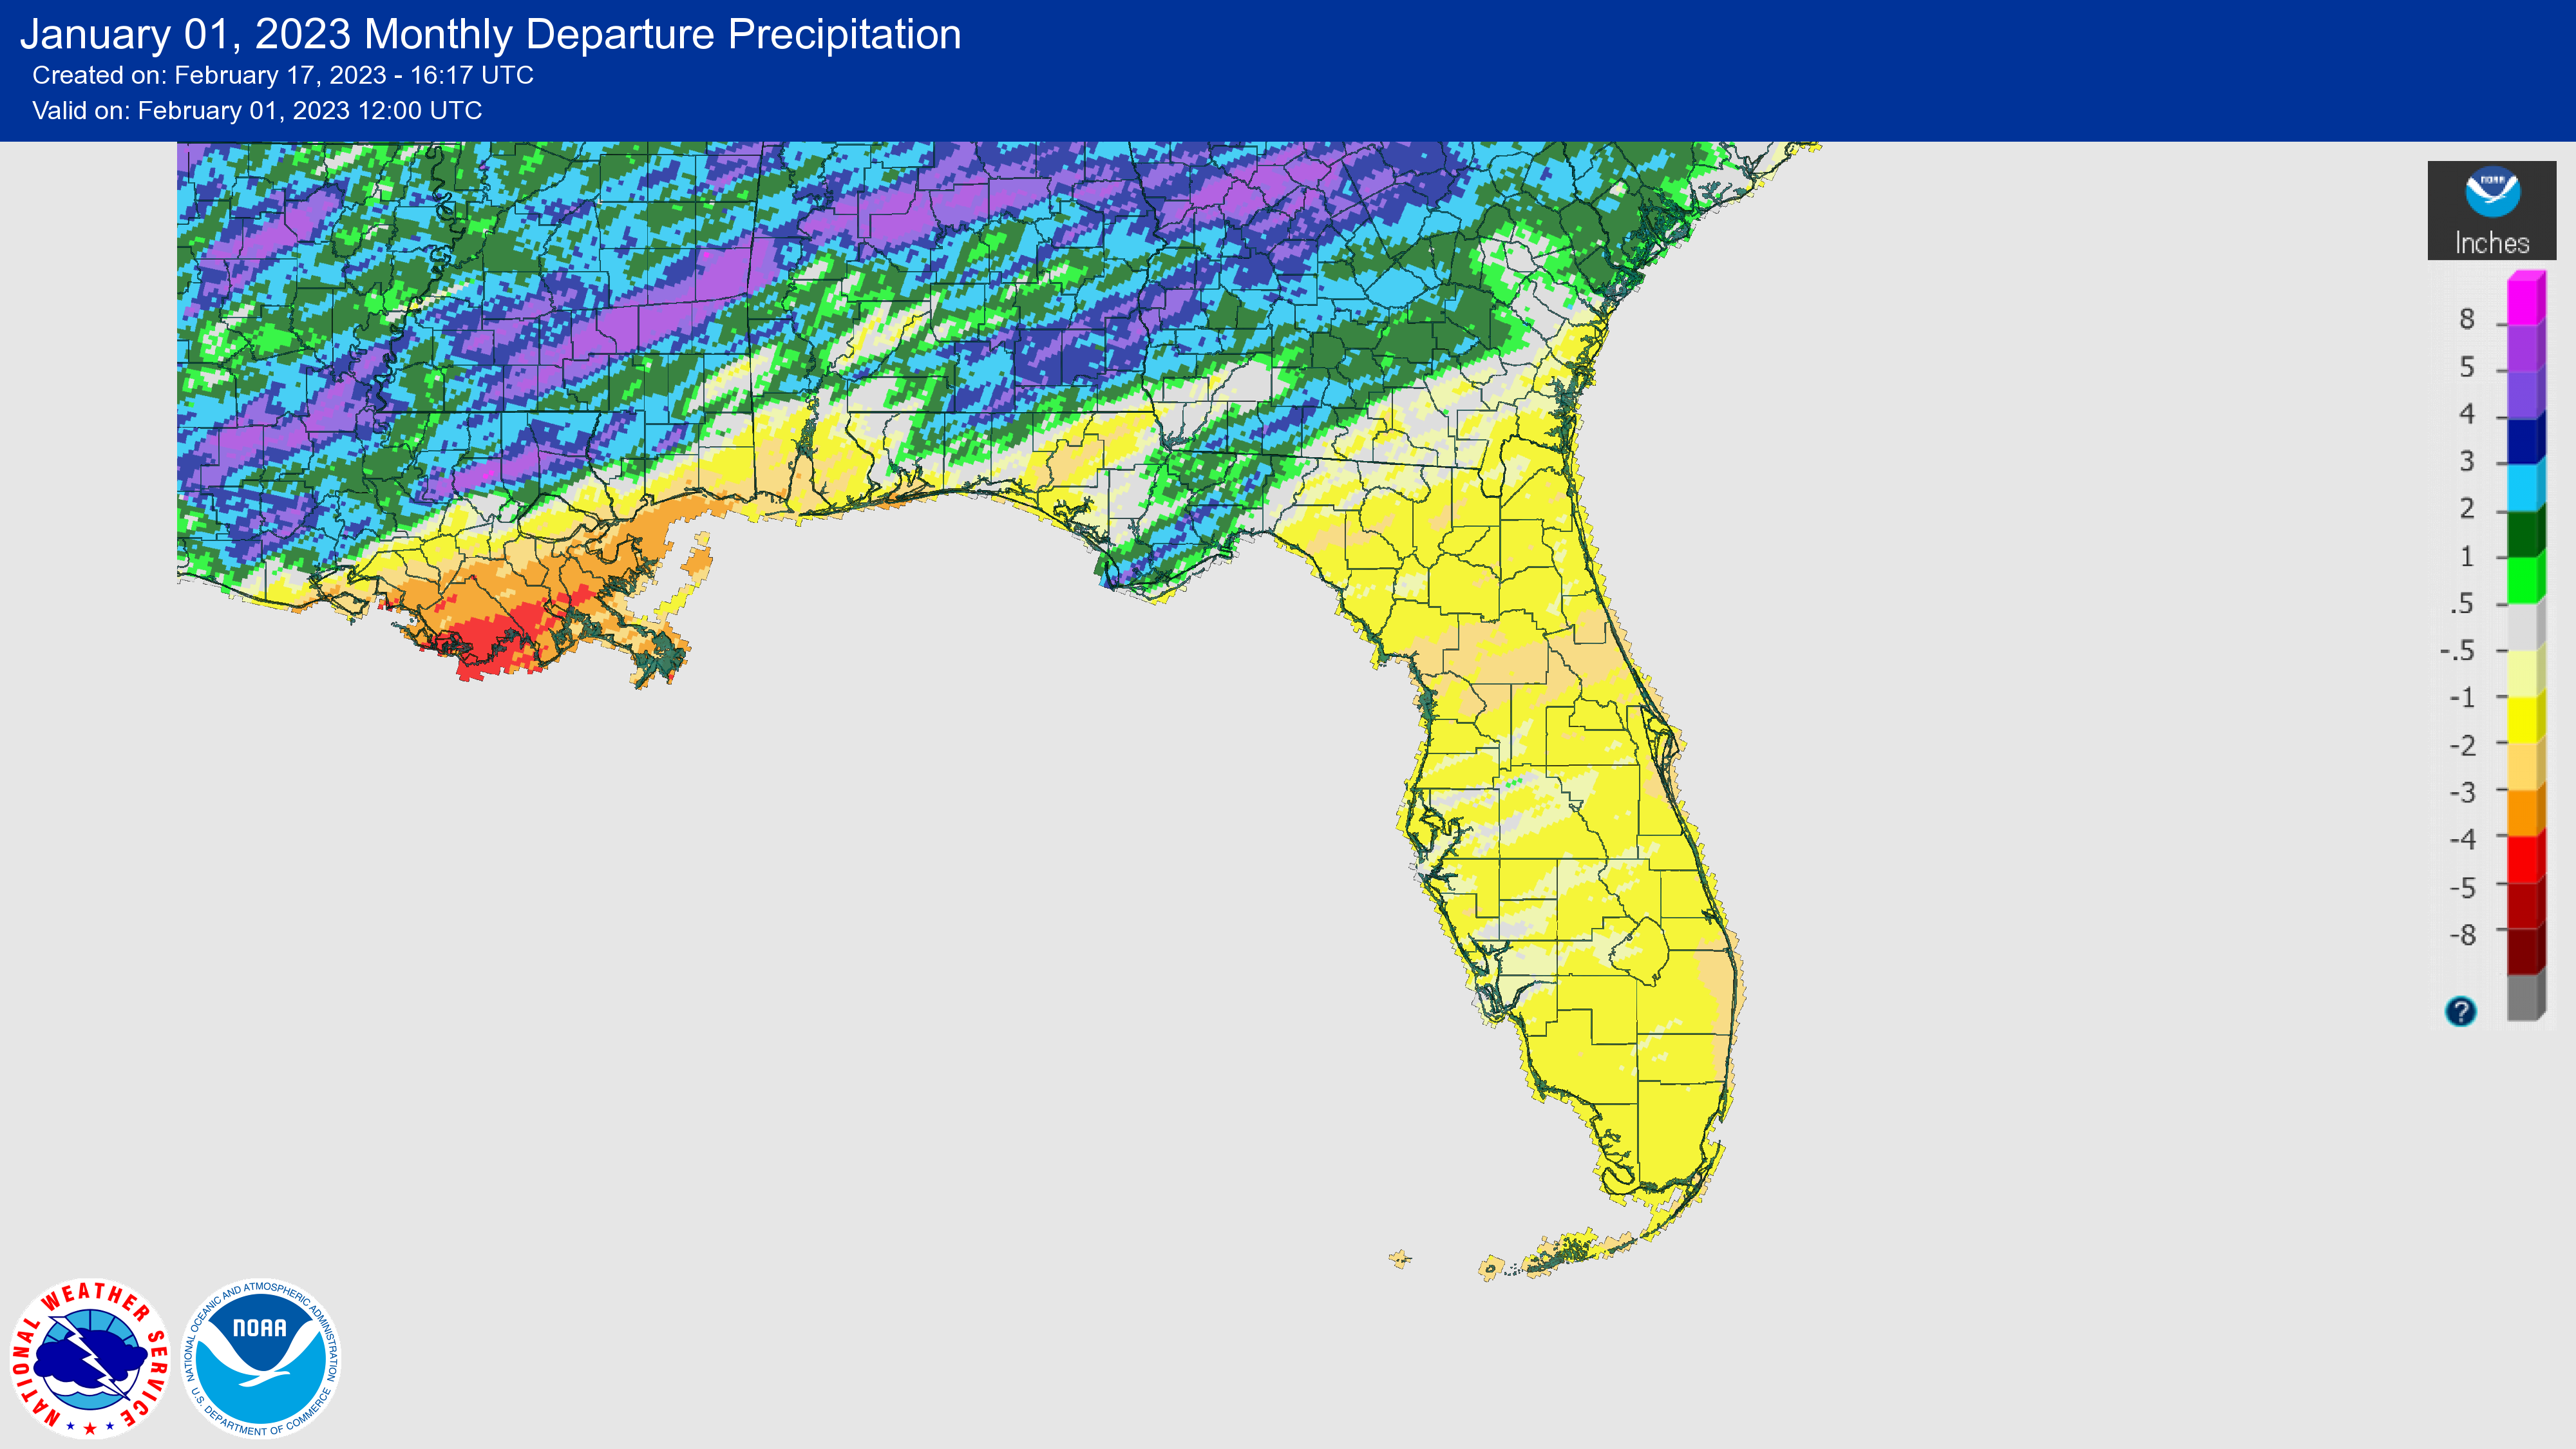
January was generally dry, with monthly rainfall totals below normal for much of the state. The monthly precipitation departures from normal ranged from -3.26 inches in West Palm Beach to +2.27 inches in Tallahassee (see Table 2 and Appendix 1 for additional locations). The Tallahassee and Apalachicola areas picked up several inches of rain toward the end of the month, which helped to alleviate drought in this area, but generally most places were dry and, as a result, abnormally dry conditions appeared over much of the Peninsula by the end of the month.
Table 2. January precipitation totals and departures from normal (inches) for selected cities.
| Station | Total Rainfall | Departure from Normal |
| Pensacola | 4.03 | -1.00 |
| Tallahassee | 6.68 | +2.27 |
| Jacksonville | 2.18 | -1.10 |
| Orlando | 1.01 | -1.47 |
| Tampa | 1.55 | -1.10 |
| Miami | 0.05 | -1.78 |
| Key West | 0.08 | -1.75 |
Figure 1. A graphical depiction of the monthly rainfall departure from normal (inches) for January (courtesy of NOAA, NWS).
La Niña Continues but Weakens.
A weak La Niña was still in place throughout the month of January with signs of weakening. Sea surface temperatures in the eastern equatorial Pacific Ocean were not as cold as they have been, with the latest Niño index values generally near -0.5°C, and sub-surface temperatures warmed too. There is forecaster consensus that La Niña is expected to continue to weaken, with a transition to ENSO-neutral over the next couple of months. ENSO-neutral is expected to then persist through the Northern Hemisphere spring and early summer. There are increasing chances of El Niño at longer forecast horizons, though large uncertainty remains.
Hazardous Weather Events in January.
According to the Local Storm Reports issued by the local National Weather Service offices serving Florida, there were 140 individual local reports of hazardous weather events recorded across the state during the month of January (see Table 4 for a breakdown by event type). No major impacts were reported.
Table 4. Breakdown of storm reports submitted in Florida during the month of January (compiled from Iowa State University/Iowa Environmental Mesonet).
| Report Type | Number of Reports |
| Heavy Rain | 0 |
| Flood | 0 |
| Coastal Flood | 0 |
| Hail | 2 |
| Marine Thunderstorm Wind | 35 |
| Non-Thunderstorm Wind Gust | 22 |
| Non-Thunderstorm Wind Damage | 1 |
| Tornado/Waterspout/Funnel Cloud | 6/0/2 |
| Thunderstorm Wind Damage | 27 |
| Thunderstorm Wind Gust | 43 |
| Rip Currents | 0 |
| Wildfire | 2 |
Daily Record Events in January.
Table 5.Summary of daily records broken or set in Florida in January (source: NCEI Daily Weather Records).
| Category | Number of Records |
| Highest daily max. temp. | 69 |
| Highest daily min. temp. | 39 |
| Lowest daily max. temp. | 6 |
| Lowest daily min. temp. | 3 |
| Highest daily precipitation | 6 |
| Total | 123 |
Weather/Climate Highlight of the Month:
January temperatures were above average, and the statewide monthly average maximum temperature ranked 12th-warmest on record. Many daily high maximum temperature records were broken during the month. Key West reached a high of 90 ̊F several times during the month, including on the 23rd, 25th and 31st, which shattered previous records of 83 ̊F, 82 ̊F and 83 ̊F set on this day in 1973, 2012 and 1946, respectively.
Drought-Related Impacts.
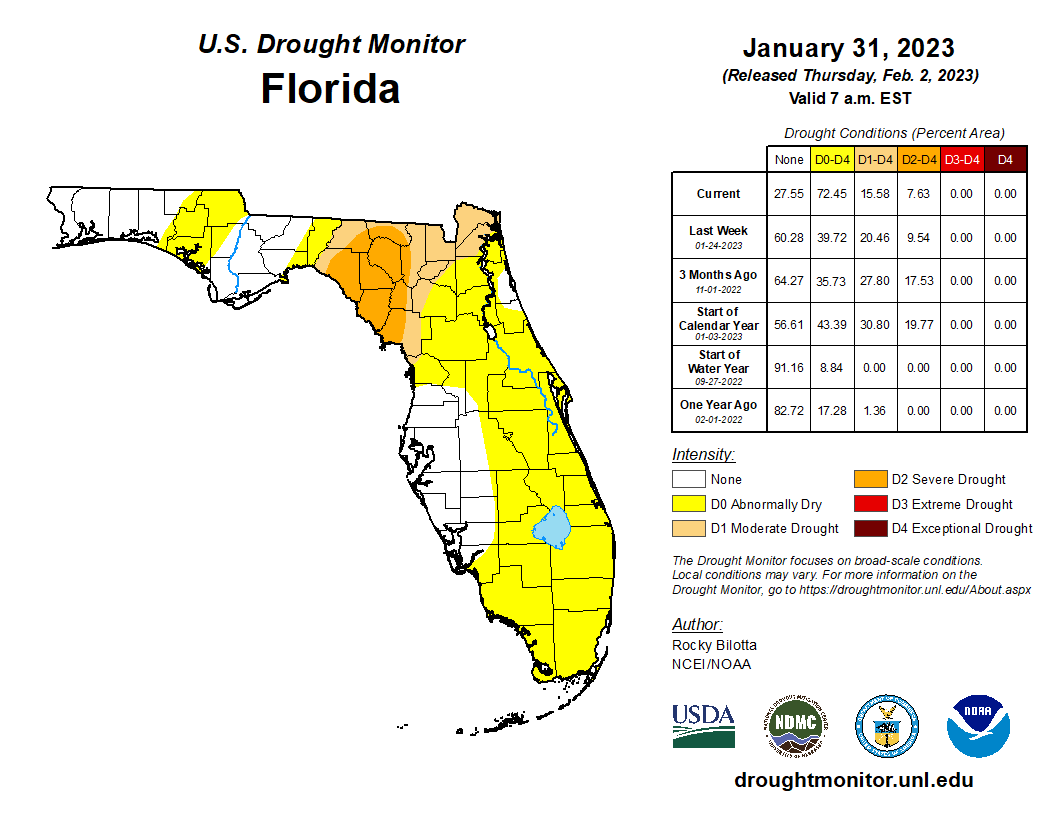
By the middle of January, severe drought (D2) affected the eastern Panhandle and Big Bend regions. About 16% of the state was in severe drought (D2), 13% was in moderate drought (D1), and 13% was abnormally dry, according to the U.S. Drought Monitor. By the end of the month, drought was removed in the Panhandle, but 8% of the state remained in severe drought (D2), 8% was in moderate drought (D1), and 57% was abnormally dry (Figure 2 below).
As of January 31, the Lake Okeechobee water level was 16.02 ft. above sea level (Feet-NGVD29), which is above average for this time of the year. At the first of the month, the water level was 16.36 ft. above sea level.
Figure 2. A graphical depiction of the current drought conditions in Florida according to the U.S. Drought Monitor (courtesy of the National Drought Mitigation Center, University of Nebraska-Lincoln).
Agriculture-Related Impacts.
During the month of January, Florida pasture conditions remained mostly fair to good but cold spells and lack of rainfall in the southern half of the State did hurt some pastures with reports of bleaching and frost. Livestock remained in mostly fair to good condition. Sugarcane planting and harvest progressed well, while citrus activities included the removal of dead trees and other maintenance activities. Several vegetable crops were planted and harvested, such as green beans, yellow squash, potatoes, sweet corn, pepper, and avocado. Preparation for rice planting also began during the latter part of the month. For more information, consult the Crop Progress - State Stories reports, which are produced monthly December through March by the USDA’s National Agricultural Statistics Service.
Appendix 1
Additional January departures from normal data for select Florida locations (Source: NWS).
| Station | Average Temperature (˚F) | Departure from Normal (˚F) | Total Rainfall (in.) | Departure from Normal (in.) |
| Gainesville | 58.5 | +3.7 | 1.65 | -1.64 |
| Sarasota | 64.3 | +1.9 | 1.43 | -1.36 |
| Melbourne | 64.6 | +1.3 | 0.43 | -2.20 |
| Fort Myers | 68.9 | +4.2 | 1.33 | -1.10 |
| West Palm Beach | 69.8 | +3.5 | 0.21 | -3.26 |
Appendix 2
Select daily record high maximum temperatures (°F) broken or tied during January (compiled from NOAA).
| Location | Date | Record | Broken/Tied | Last |
| Stuart | 1 | 86 | Broken | 85 in 2022 |
| Niceville | 2 | 79 | Broken | 78 in 1975 |
| Pensacola | 2 | 79 | Broken | 74 in 2009 |
| Key West | 2 | 90 | Broken | 86 in 2022 |
| Cross City | 3 | 82 | Broken | 81 in 2015 |
| Deland | 3 | 85 | Tied | 85 in 1907 |
| Pensacola | 3 | 81 | Broken | 79 in 2020 |
| Hastings | 4 | 83 | Broken | 82 in 2015 |
| Crestview | 4 | 79 | Broken | 77 in 1997 |
| Sanford | 5 | 86 | Broken | 84 in 2015 |
| Miami | 5 | 86 | Broken | 84 in 2015 |
| West Palm Beach | 5 | 86 | Broken | 84 in 1972 |
| Key West | 8 | 88 | Broken | 85 in 2022 |
| Marianna | 12 | 80 | Broken | 79 in 2017 |
| Crestview | 17 | 80 | Tied | 80 in 2017 |
| Pensacola | 17 | 80 | Broken | 78 in 2017 |
| Jacksonville Beach | 19 | 83 | Broken | 82 in 2001 |
| Plant City | 19 | 85 | Tied | 85 in 2001 |
| Key West | 19 | 88 | Broken | 82 in 2020 |
| Jacksonville | 19 | 84 | Broken | 83 in 2001 |
| Tallahassee | 19 | 84 | Broken | 79 in 2001 |
| Mayport | 22 | 83 | Broken | 80 in 2017 |
| Key West | 22 | 89 | Broken | 84 in 2017 |
| Hialeah | 23 | 85 | Broken | 84 in 2017 |
| Miami | 23 | 88 | Broken | 85 in 2007 |
| Key West | 23 | 90 | Broken | 83 in 1973 |
| Perrine | 24 | 86 | Broken | 84 in 2018 |
| Plant City | 25 | 88 | Broken | 86 in 1898 |
| Orlando | 25 | 86 | Broken | 85 in 1990 |
| Gainesville | 25 | 82 | Broken | 81 in 1990 |
| Vero Beach | 25 | 86 | Broken | 84 in 2002 |
| Key West | 25 | 90 | Broken | 82 in 2012 |
| Clermont | 26 | 87 | Broken | 84 in 1962 |
| Daytona Beach | 26 | 84 | Broken | 82 in 1965 |
| Key West | 28 | 89 | Broken | 83 in 1997 |
| Miles City | 29 | 87 | Tied | 87 in 1990 |
| Key West | 29 | 88 | Broken | 84 in 1997 |
| Jacksonville Beach | 30 | 88 | Broken | 83 in 1991 |
| Gainesville | 30 | 86 | Broken | 84 in 2013 |
| Crestview | 30 | 83 | Broken | 78 in 2013 |
| Tallahassee | 30 | 83 | Tied | 83 in 1957 |
| Jacksonville | 30 | 87 | Broken | 85 in 2013 |
| Jacksonville Beach | 31 | 88 | Broken | 85 in 1985 |
| Gainesville | 31 | 85 | Broken | 83 in 1985 |
| Key West | 31 | 90 | Broken | 83 in 1946 |
Prepared by Florida Climate Center
The Florida State University
Tallahassee, FL
Key Points:
- Monthly average temperatures were above normal in April for the fourth month in a row this year; Florida is experiencing its hottest year on record so far (January – April).
- April monthly precipitation totals were generally above normal in Florida, except along the western Gulf Coast region. Extreme rainfall occurred in and around Fort Lauderdale on April 12-13.
- Drought conditions improved in some places by the end of the month. Moderate to severe drought persisted across much of the Peninsula, and a pocket of extreme drought developed along the west-central Gulf Coast from Levy to Pinellas Counties.
- An El Niño Watch has been issued, with a 62% chance of a transition to El Niño in summer (May–July).
Average monthly temperatures in April were above normal across the state. Average temperature departures from normal ranged from +1.8 ̊F in Key West to +4.2 ̊F in Orlando for the month (see Table 1 and Appendix 1 for select cities). Many locations across the Peninsula experienced one of their warmest Aprils on record. Sarasota and Lakeland had their top record warmest April on record, while many other locations had one of their top 5 warmest Aprils on record, including Naples, Fort Myers, Tampa, Orlando, Daytona Beach, Miami, and West Palm Beach. April marks the fourth month in a row with above normal monthly average temperatures. Since the beginning of the year, Florida is experiencing its warmest year on record to date. Appendix 2 provides select daily high maximum temperature records tied or broken during the month.
Table 1. April average temperatures and departures from normal ( ̊F) for selected cities.
| Station | Mean Temperature | Departure from Normal |
| Pensacola | 70.4 | +2.1 |
| Tallahassee | 70.2 | +2.9 |
| Jacksonville | 70.7 | +2.6 |
| Orlando | 76.4 | +4.2 |
| Tampa | 77.0 | +3.1 |
| Miami | 79.4 | +2.7 |
| Key West | 79.7 | +1.8 |
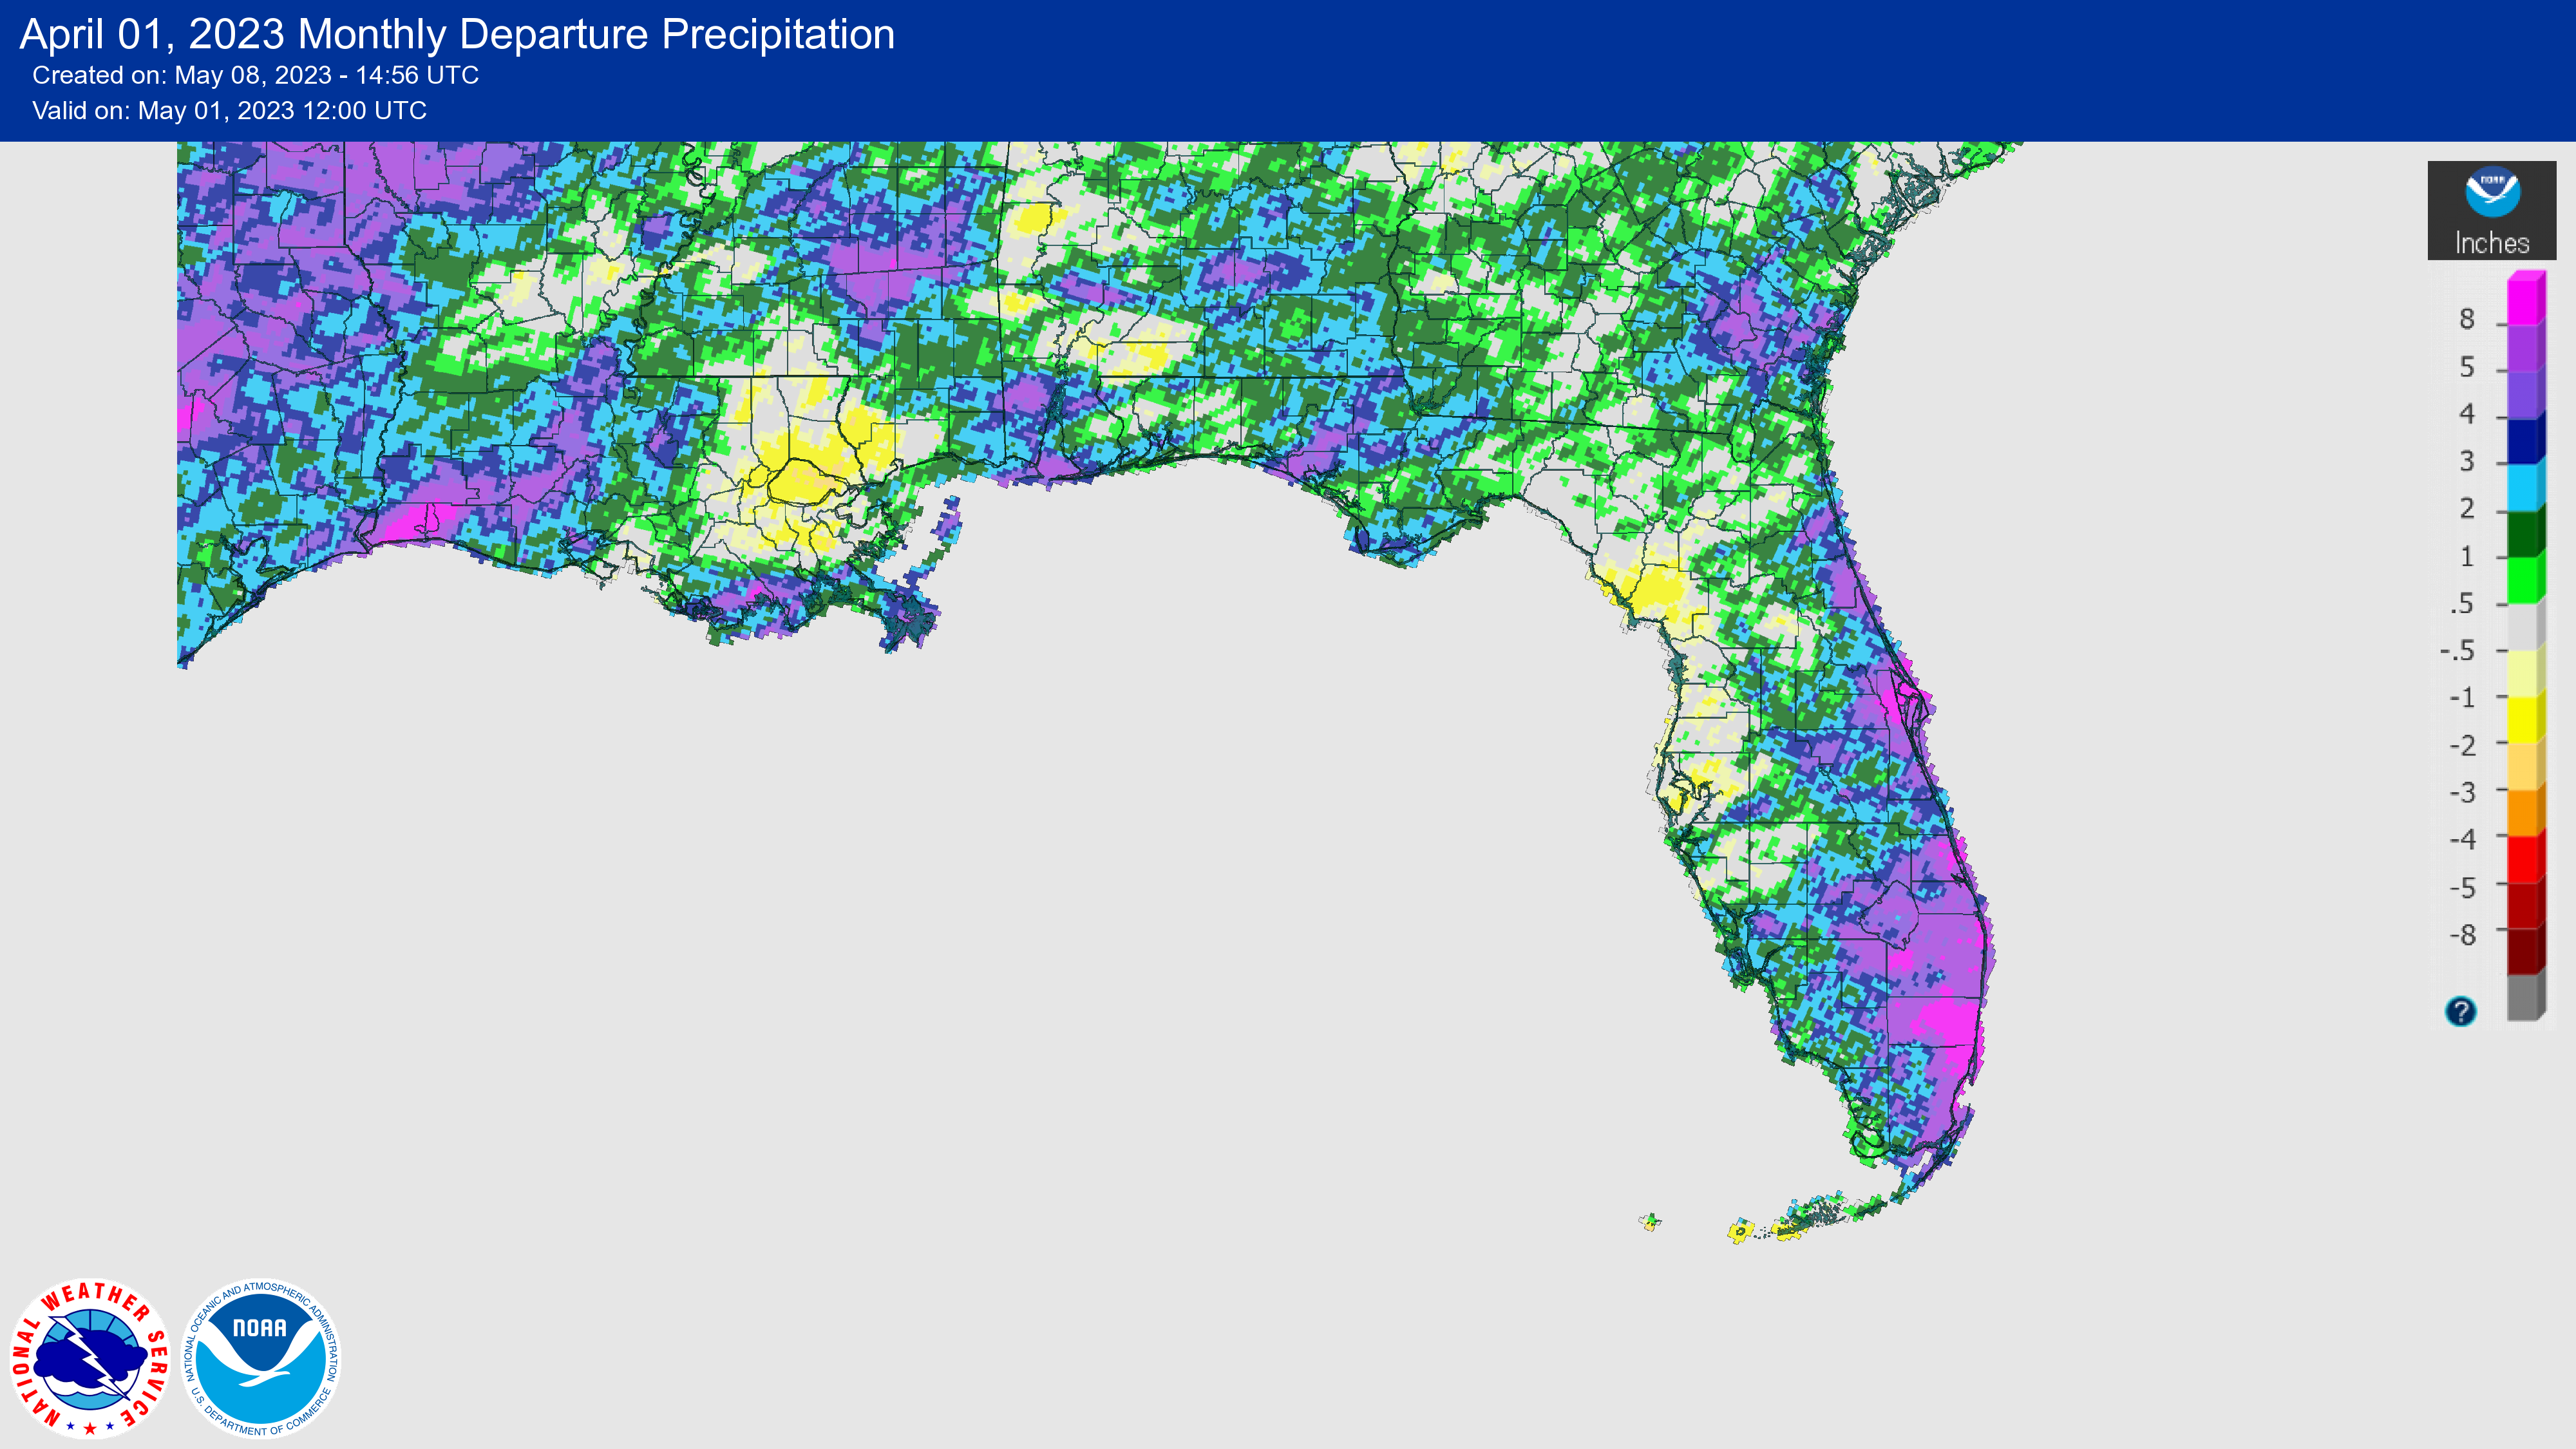
Monthly precipitation totals in April were variable, with above normal monthly rainfall across eastern Florida and the central Panhandle and below normal rainfall across the western Gulf Coast. The monthly precipitation departures from normal ranged from -1.67 inches in Tampa to +6.59 inches in Miami (see Table 2 and Appendix 1 for additional locations). Other locations in Southeast Florida were well above normal, with excess rainfall for the month on the order of +7.45 inches in West Palm Beach to +25.34 inches in Fort Lauderdale. Fort Lauderdale’s rainfall total of 25.87 inches on April 12-13 was a record 1-day rainfall, and Fort Lauderdale, Hollywood, and Miami all recorded their wettest April on record. In addition, Stuart recorded its wettest April on record, with a total of 10.59 inches for the month, and Titusville had its wettest April with 11.03 inches for the month (based on a 105-year record at this station).
Table 2. April precipitation totals and departures from normal (inches) for selected cities.
| Station | Total Rainfall | Departure from Normal |
| Pensacola | 7.34 | +1.82 |
| Tallahassee | 3.36 | -0.17 |
| Jacksonville | 3.05 | +0.12 |
| Orlando | 3.92 | +1.34 |
| Tampa | 0.88 | -1.67 |
| Miami | 9.95 | +6.59 |
| Key West | 1.69 | -0.38 |
Figure 1. A graphical depiction of the monthly rainfall departure from normal (inches) for April (courtesy of NOAA, NWS).
El Niño Watch.
The current ENSO-neutral conditions in the equatorial Pacific Ocean are expected to continue through the Northern Hemisphere spring. Over the past month, above-average sea surface temperatures dominated across the equatorial Pacific Ocean. The Niño 1 + 2 index value was at +2.7 ̊C, indicating warming along the South American Coast. There is the potential of a strong El Niño by the end of the year, with a decrease in trade winds and an increase in oceanic heat content, which have led to increased confidence in El Niño in coming months. However, the range of possibilities toward the end of the year remain wide – from a strong El Niño to no El Niño. There is a 62% chance of El Niño developing during summer (May-July 2023).
Hazardous Weather Events in April.
According to the Local Storm Reports issued by the local National Weather Service offices serving Florida, there were 614 individual local reports of hazardous weather events recorded across the state during the month of April (see Table 4 for a breakdown by event type). There were several reports of large hail throughout the month, including golf ball sized hail on the 16th near Port St. Lucie and baseball sized hail (2.75 inches) in Lake County on the 25th. A 3-inch hail stone was reported on the 24th in Antioch in Hillsborough County, which is only the 19th such occurrence dating back to 1950, according to National Weather Service data obtained from the North Carolina State Climate Office Severe Storm Reports Tool. A tornado outbreak occurred on the 27th, with 7 tornadoes reported across the Panhandle on that day alone. A peak wind gust of 76 mph was reported near Lynn Haven in Bay County.
Table 3. Breakdown of storm reports submitted in Florida during the month of April (compiled from Iowa State University/Iowa Environmental Mesonet).
| Report Type | Number of Reports |
| Heavy Rain | 1 |
| Flood | 12 |
| Flash Flood | 9 |
| Coastal Flood | 3 |
| Hail | 140 |
| Marine Thunderstorm Wind | 97 |
| Non-Thunderstorm Wind Gust | 42 |
| Non-Thunderstorm Wind Damage | 2 |
| Tornado/Waterspout/Funnel Cloud | 17/11/10 |
| Thunderstorm Wind Damage | 102 |
| Thunderstorm Wind Gust | 158 |
| Rip Currents | 1 |
| Wildfire | 7 |
Daily Record Events in April.
Table 4. Summary of daily records broken or set in Florida in April (source: NCEI Daily Weather Records).
| Category | Number of Records |
| Highest daily max. temp. | 35 |
| Highest daily min. temp. | 44 |
| Lowest daily max. temp. | 5 |
| Lowest daily min. temp. | 2 |
| Highest daily precipitation | 40 |
| Total | 126 |
Weather/Climate Highlight of the Month:
A cluster of stationary thunderstorms developed and sat over the Fort Lauderdale area on April 12-13, producing copious amounts of rainfall over the region. A local record 24-hour rainfall total of approximately 25.8 inches was recorded at a WeatherStem station near the Ft. Lauderdale Airport. This rainfall total could set a new record 24-hour rainfall for Florida, and is under investigation by the State Climate Extremes Committee. Much of this rainfall in Fort Lauderdale and surrounding areas fell in a 6- to 12-hour period. A CoCoRaHS observer recorded 18.16 inches in Hollywood on that day. The storm caused flash flooding, which flooded roadways and closed the airport. The current 24-hour rainfall record in Florida is 23.28 inches in Key West, set on November 11-12, 1980.
Drought-Related Impacts.
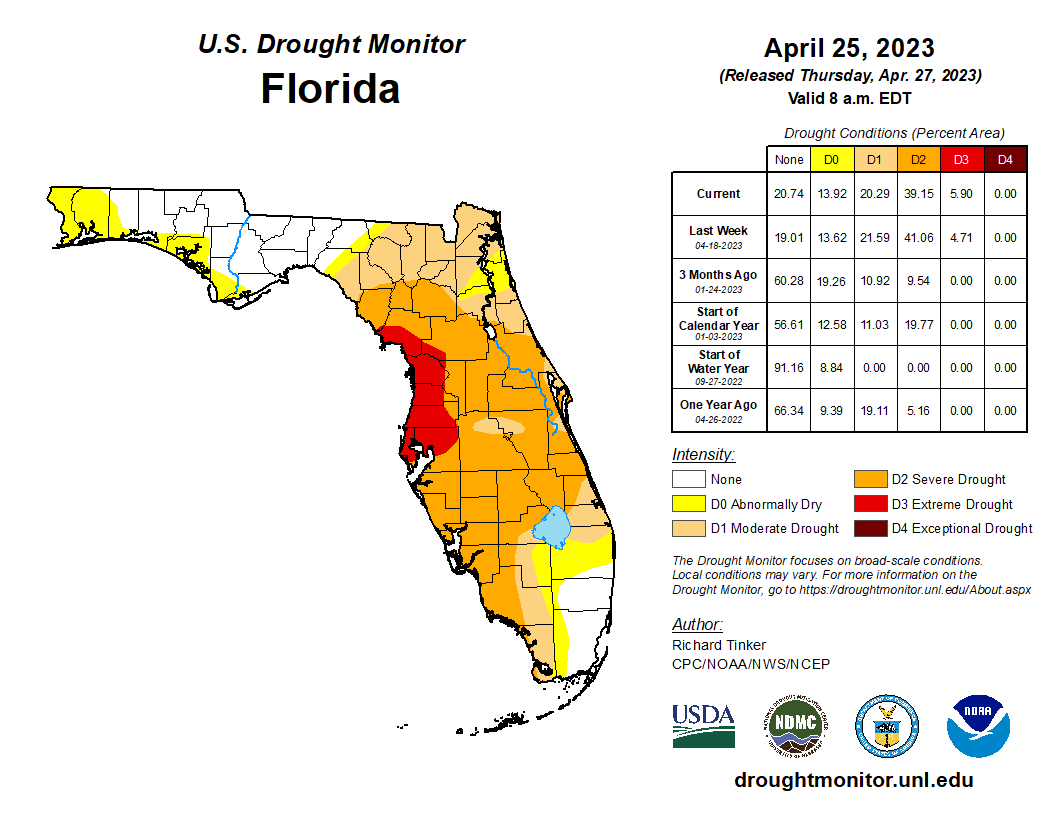
In mid-April, extreme drought (D3) had shifted northward to the west-central Gulf counties of Pinellas, Hillsborough, Pasco, Hernando, and Citrus Counties. About 4.7% of the state was in extreme drought (D3), 41% was in severe drought (D2), 22% was in moderate dry (D1), and 14% was abnormally dry, according to the U.S. Drought Monitor. Toward the end of the month, conditions had not changed much. The area of extreme drought extended slightly further north to include coastal Levy County. As of April 25, about 5.9% of the state was in extreme drought (D3), 39% was in severe drought (D2), 20% of the state was in moderate drought (D1), and 14% remained abnormally dry (Figure 2).
As of April 30, the Lake Okeechobee water level was 14.33 ft. above sea level (Feet-NGVD29), which is just above average for this time of year. At the first of the month, the water level was 14.52 ft. above sea level.
Figure 2. A graphical depiction of the latest drought conditions in Florida according to the U.S. Drought Monitor (courtesy of the National Drought Mitigation Center, University of Nebraska-Lincoln).
Agriculture-Related Impacts.
In mid-April, topsoil moisture conditions were adequate in 45% of the state, short in 27%, and very short in 18% of the state, while 10% of the state had surplus moisture conditions. By the end of April, topsoil moisture had begun to improve with levels adequate in 60% of the state, short in 21%, and very short in 8% of the state; 11% of the state was in surplus. For more information, consult the Crop Progress and Conditions Report, which is published by the USDA’s National Agricultural Statistics Service.
Appendix 1
Additional April departures from normal data for select Florida locations (Source: NWS).
| Station | Average Temperature (˚F) | Departure from Normal (˚F) | Total Rainfall (in.) | Departure from Normal (in.) |
| Fort Lauderdale | 77.4 | +2.5 | 29.03 | +25.34 |
| Gainesville | 71.5 | +3.0 | 4.60 | +1.86 |
| Sarasota | 76.2 | +3.6 | 3.63 | +1.17 |
| Melbourne | 75.8 | +2.7 | 4.72 | +2.43 |
| Fort Myers | 79.0 | +4.2 | 3.99 | +1.55 |
| West Palm Beach | 78.2 | +3.3 | 11.13 | +7.45 |
Appendix 2
Select daily record high maximum temperatures (°F) broken or tied during April (compiled from NOAA).
| Location | Date | Record | Broken/Tied | Last |
| Kissimmee | 1 | 90 | Tied | 90 in 2021 |
| Orlando | 1 | 92 | Tied | 92 in 1974 |
| Jacksonville | 1 | 90 | Broken | 89 in 1974 |
| Pensacola | 1 | 86 | Broken | 84 in 2012 |
| Sanford | 3 | 91 | Tied | 91 in 2017 |
| Vero Beach | 3 | 88 | Broken | 87 in 2017 |
| Fort Pierce | 4 | 92 | Broken | 91 in 1977 |
| Orlando | 4 | 93 | Broken | 92 in 1974 |
| Gainesville | 4 | 90 | Broken | 89 in 2011 |
| Fort Myers | 4 | 93 | Broken | 90 in 2022 |
| Crestview | 4 | 88 | Broken | 86 in 2017 |
| Bradenton | 5 | 91 | Broken | 89 in 2022 |
| Clermont | 5 | 94 | Broken | 91 in 2012 |
| Kissimmee | 5 | 92 | Broken | 90 in 2017 |
| Usher Tower | 5 | 91 | Broken | 90 in 1999 |
| Venice | 5 | 93 | Broken | 89 in 1997 |
| Cross City | 5 | 90 | Broken | 87 in 2010 |
| Fort Myers | 5 | 94 | Broken | 91 in 2022 |
| Tampa | 5 | 91 | Broken | 89 in 1964 |
| Fort Myers | 6 | 93 | Broken | 91 in 1999 |
| Tampa | 6 | 92 | Broken | 89 in 1999 |
| Crestview | 6 | 88 | Broken | 86 in 2022 |
| Clermont | 7 | 95 | Broken | 92 in 2022 |
| Cross City | 7 | 90 | Broken | 88 in 1954 |
| Plant City | 8 | 94 | Broken | 93 in 1967 |
| Kissimmee | 9 | 91 | Broken | 89 in 2020 |
| Key West | 9 | 86 | Tied | 86 in 1965 |
| Miles City | 15 | 97 | Broken | 95 in 2015 |
| Fort Myers | 15 | 93 | Broken | 92 in 2020 |
| Clermont | 16 | 93 | Broken | 92 in 1967 |
| Wauchula | 16 | 94 | Broken | 93 in 1945 |
| Lakeland | 16 | 92 | Tied | 92 in 1994 |
| Clermont | 17 | 91 | Broken | 90 in 2022 |
Prepared by Florida Climate Center
The Florida State University
Tallahassee, FL
Key Points:
- Average monthly temperatures in November were above normal.
- Monthly precipitation totals in November were below normal in the western Panhandle and west central Florida where rainfall was most needed; eastern and southern areas received above normal precipitation for the month.
- With a shift to a wetter pattern, drought improvement or removal is expected over the coming weeks.
- El Niño is expected to persist for the next several months, with a 62% chance of continuing in spring (April-June 2024); chances of a strong event are greater than 55%, and there is about a 1-in-3 chance for a “historically strong” event for the November-January season.
Average monthly temperatures in November were near to above average. Average temperature departures from normal ranged from -0.7 ̊F in Jacksonville to 3.0 ̊F Miami for the month (see Table 1 and Appendix 1 for select cities). Miami experienced its 4th-warmest November on record. Tallahassee reached a low of 27 ̊ F and 28 ̊F on the 29th and 30th, respectively, at the airport, which was between 10 ̊F to 14 ̊F degrees below normal. The Jacksonville airport also reached a freezing temperature of 32 ̊ F on the 30th. The probability of the first freeze of the season happening at this time of year in North Florida is 50% according to climatology. Select daily high maximum temperature records tied or broken during the month are provided in Appendix 2.
Table 1. November average temperatures and departures from normal ( ̊F) for selected cities.
| Station | Mean Temperature | Departure from Normal |
| Pensacola | 61.7 | +0.3 |
| Tallahassee | 61.4 | +1.2 |
| Jacksonville | 61.6 | -0.7 |
| Orlando | 70.0 | +1.8 |
| Tampa | 70.4 | +0.6 |
| Miami | 77.8 | +3.0 |
| Key West | 78.1 | +1.5 |
Monthly rainfall totals in November were below normal in the western Panhandle and west central Florida and above average elsewhere. The monthly precipitation departures from normal ranged from -1.95 inches in Jacksonville to +5.83 inches in Miami (see Table 2 and Appendix 1 for select locations). Naples saw its 2nd-wettest November on record (based on a 22-year period), with 3.70 inches of rain. Fort Lauderdale collected 11.23 inches of rainfall in November, ranking as the wettest November on record there. However, coastal southwest Florida continues to see its driest year-to-date on record, including at the Naples, Sarasota, and Venice stations. In addition, many locations across north Florida went 30 consecutive days without measurable rainfall between mid-October and mid-November.
Table 2. November precipitation totals and departures from normal (inches) for selected cities.
| Station | Total Rainfall | Departure from Normal |
| Pensacola | 4.12 | -0.30 |
| Tallahassee | 3.34 | +0.24 |
| Jacksonville | 3.95 | -1.95 |
| Orlando | 5.21 | +3.42 |
| Tampa | 1.85 | +0.45 |
| Miami | 9.36 | +5.83 |
| Key West | 1.56 | -0.49 |
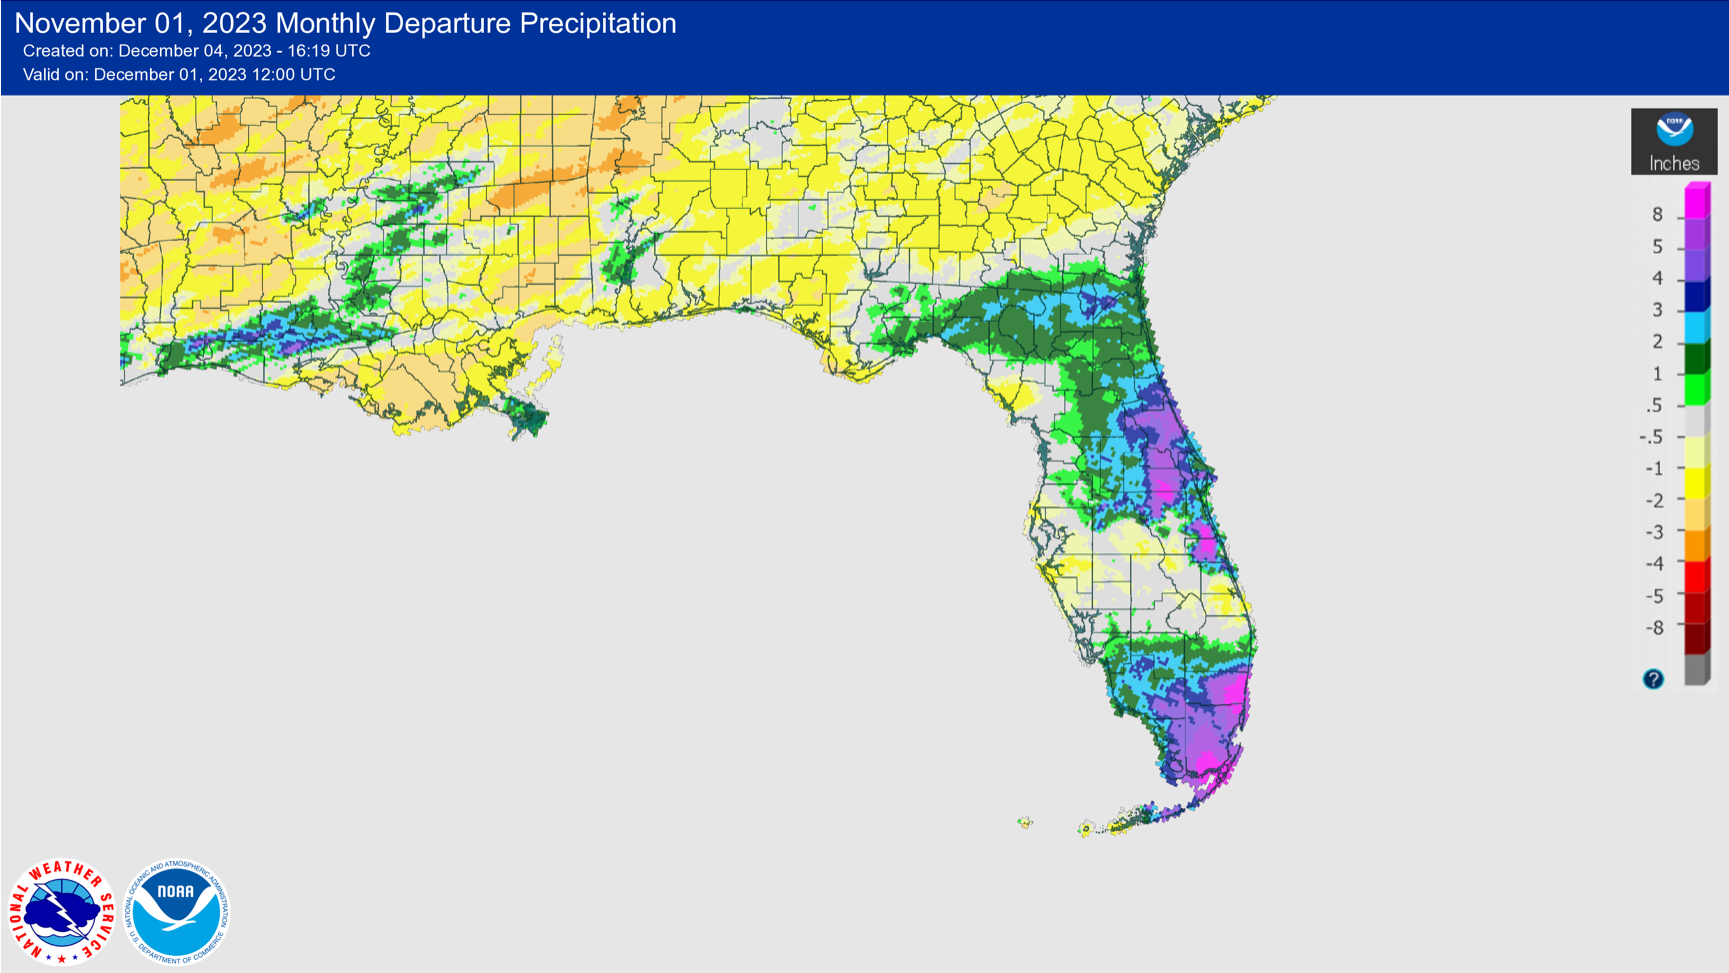
Figure 1. A graphical depiction of the monthly rainfall departure from normal (inches) for November (courtesy of NOAA, NWS).
El Niño Advisory.
El Niño conditions, the warm phase of the El Niño Southern Oscillation climate pattern in the tropical equatorial Pacific Ocean, continue to strengthen. El Niño is likely to persist through the Northern Hemisphere winter and into spring, with a 62% chance during April-June 2024. Above-average sea surface temperature anomalies across the equatorial Pacific Ocean have been indicative of a strong El Niño. As a result, there is a greater than 55% chance of at least a strong El Niño event (≥ 1.5°C in Niño-3.4 for a seasonal average). There is a 35% chance that this El Niño could become “historically strong” (≥ 2.0°C) for the November-January season.
Hazardous Weather Events in November.
According to the Local Storm Reports issued by the local National Weather Service offices serving Florida, there were 122 individual local reports of hazardous weather events recorded across the state during the month of November (see Table 4 for a breakdown by event type).
Table 3. Breakdown of storm reports submitted in Florida during the month of November (compiled from Iowa State University/Iowa Environmental Mesonet).
| Report Type | Number of Reports |
| Heavy Rain | 31 |
| Flood | 2 |
| Flash Flood | 6 |
| Coastal Flood | 1 |
| Hail | 0 |
| Non-Thunderstorm Wind Gust | 52 |
| Non-Thunderstorm Wind Damage | 6 |
| Tornado/Waterspout/Funnel Cloud | 0/2/0 |
| Thunderstorm Wind Damage | 0 |
| Thunderstorm Wind Gust | 22 |
Daily Record Events in November.
Table 4. Summary of daily records broken or set in Florida in November (source: NCEI Daily Weather Records).
| Category | Number of Records |
| Highest daily max. temp. | 22 |
| Highest daily min. temp. | 8 |
| Lowest daily max. temp. | 6 |
| Lowest daily min. temp. | 4 |
| Highest daily precipitation | 35 |
| Total | 75 |
Weather/Climate Highlight of the Month:
2023 is on pace to become the hottest year in recorded history globally, according to the World Meteorological Organization. In Florida, many locations are also very likely to see their hottest year on record based on year-to-date average mean temperatures through November 30, including Pensacola, Tallahassee, Fort Myers, Miami, and Key West. The departures from normal for the 11-month period are running close to 3°F above normal.
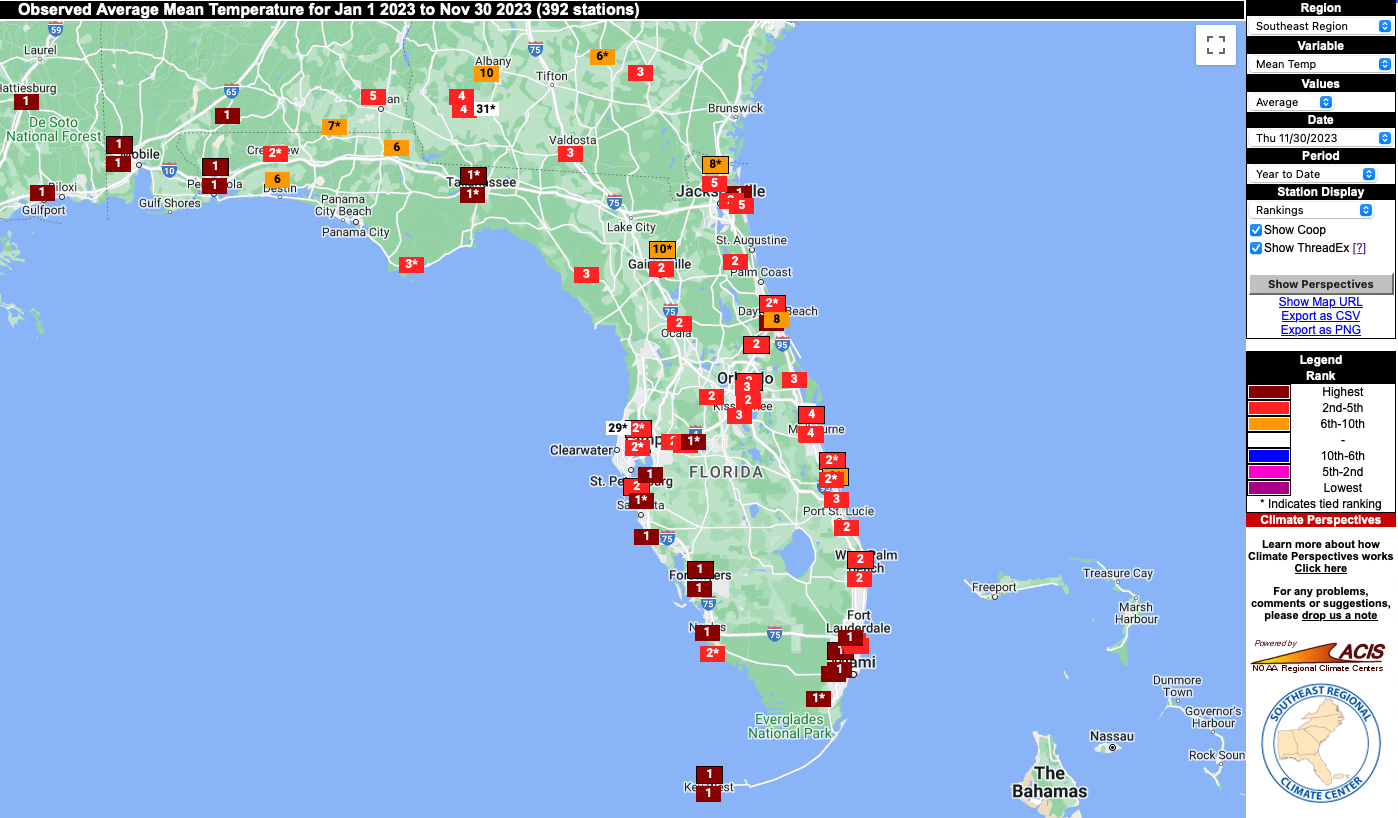
Year to date temperature rankings through November 30, 2023, based on average mean temperatures (Source: Southeast Regional Climate Center's Climate Perspectives Tool).
Drought-Related Impacts.
Drought conditions persisted across the western Panhandle through much of the month, where flash drought had developed. Many locations across northern Florida went one month, or close to, without measurable rainfall. The lack of rain caused problems for forage and livestock producers and small grain farmers. Declines in the pecan harvest which is down about 30% this year can be attributed to these recent dry conditions, as well as to Hurricane Idalia. Wet fields elsewhere in the state are starting to cause issues with citrus crops.
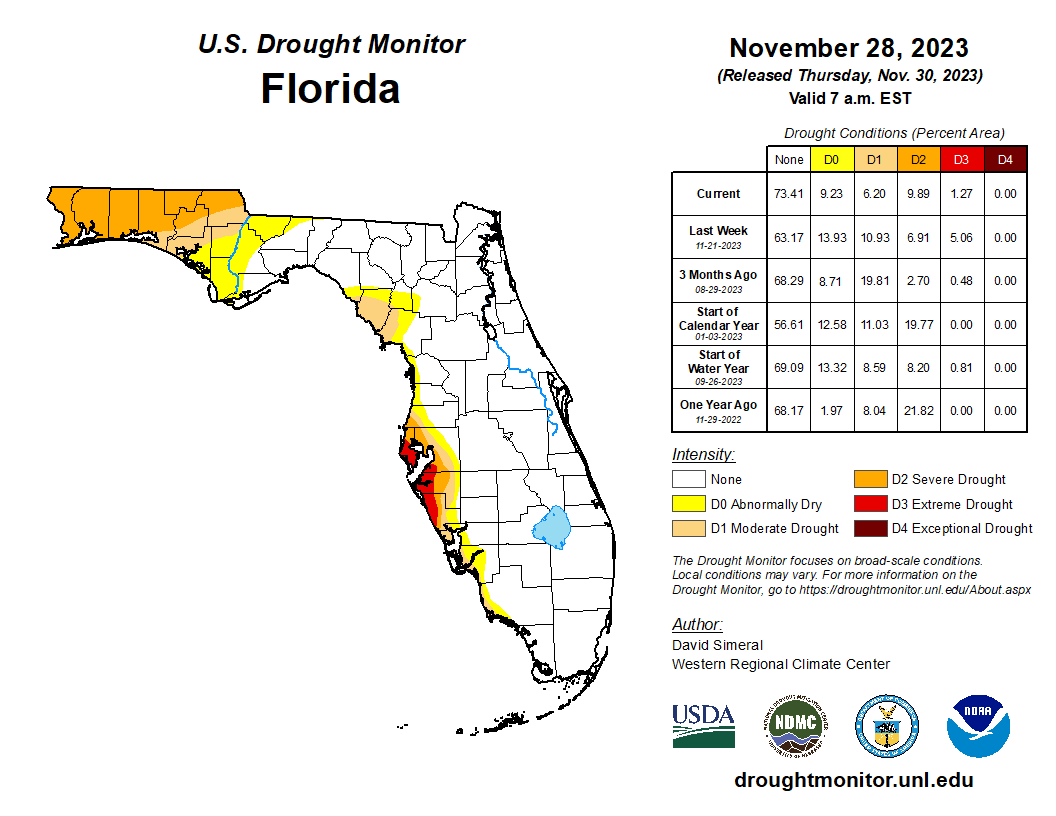
Throughout November, drought persisted but improved slightly across the Panhandle and west coast of Florida. By the 14th, roughly 8% of the state was in extreme drought (D3), 4% was in severe drought (D2), 9% was experiencing moderate drought (D1), and 30% was abnormally dry (D0), according to the U.S. Drought Monitor. By the end of the month, only 1% of the state was in extreme drought (D3), 10% was in severe drought (D2), 6% was in moderate drought (D1), and 9% remained abnormally dry (D0) (see Figure 2 below). Drought improvement or removal is expected everywhere during December.
As of November 30, the Lake Okeechobee water level was 15.98 ft. above sea level (Feet-NGVD29), which is above average for this time of year. At the first of the month, the water level was 16.16 ft. above sea level.
Figure 2. A graphical depiction of the latest drought conditions in Florida according to the U.S. Drought Monitor (courtesy of the National Drought Mitigation Center, University of Nebraska-Lincoln).
Agriculture-Related Impacts.
In mid-November, topsoil moisture conditions were adequate in 51% of the state, short in 31%, and very short in 18% of the state, while 0% of the state was experiencing surplus topsoil moisture conditions. By November 26, conditions improved with topsoil moisture conditions adequate in 73% of the state, short in 15%, and very short in only 1% of the state; 11% of the state was in surplus. For more information, consult the Crop Progress and Conditions Report, which is published by the USDA’s National Agricultural Statistics Service.
Appendix 1
Additional November departures from normal data for select Florida locations (Source: NWS).
| Station | Average Temperature (˚F) | Departure from Normal (˚F) | Total Rainfall (in.) | Departure from Normal (in.) |
| Gainesville | 63.7 | +1.0 | 2.39 | +0.60 |
| Sarasota | 71.1 | +1.0 | 0.67 | -1.14 |
| Naples | 73.4 | +1.0 | 3.70 | +2.31 |
| Fort Myers | 73.0 | +1.5 | 2.97 | +1.19 |
| West Palm Beach | 75.2 | +2.2 | 4.46 | +0.84 |
Appendix 2
Select daily record high maximum temperatures (°F) broken or tied during November (compiled from NOAA).
| Location | Date | Record | Broken/Tied | Last |
| Homestead | 1 | 90 | Tied | 90 in 2020 |
| Perrine | 1 | 90 | Tied | 90 in 2019 |
| Plant City | 10 | 91 | Broken | 90 in 2018 |
| Tampa | 10 | 89 | Broken | 87 in 2002 |
| Orlando | 10 | 89 | Broken | 87 in 2015 |
| Gainesville | 10 | 87 | Broken | 84 in 2020 |
| Miami | 10 | 89 | Tied | 89 in 2015 |
| Lakeland | 10 | 90 | Broken | 89 in 1986 |
| Jacksonville | 10 | 86 | Broken | 84 in 2002 |
| Tallahassee | 10 | 87 | Tied | 87 in 2020 |
| Bradenton | 11 | 89 | Broken | 87 in 1994 |
| Clermont | 11 | 90 | Broken | 88 in 2015 |
| Deland | 11 | 87 | Tied | 87 in 2002 |
| Plant City | 11 | 94 | Broken | 90 in 1972 |
| Wauchula | 11 | 91 | Broken | 89 in 1972 |
| Orlando | 11 | 89 | Broken | 87 in 2002 |
| Gainesville | 11 | 89 | Broken | 85 in 2002 |
| Cross City | 11 | 88 | Broken | 86 in 2002 |
| Fort Myers | 11 | 91 | Tied | 91 in 1979 |
| Miami | 11 | 89 | Tied | 89 in 2002 |
| Tampa | 11 | 88 | Tied | 88 in 1986 |
| Clermont | 12 | 89 | Broken | 88 in 2002 |
| Plant City | 12 | 92 | Broken | 90 in 2018 |
| Wauchula | 12 | 90 | Broken | 89 in 1986 |
| Vero Beach | 26 | 86 | Broken | 85 in 2018 |
Prepared by Florida Climate Center
The Florida State University
Tallahassee, FL
Key Points:
- Hurricane Ian made landfall on the southwest Florida coast at Cayo Costa, a barrier island just west of Fort Myers, as a strong Category 4 hurricane on September 28. Ian caused widespread and devastating impacts to the southwest coast, central, and eastern coastal areas of Florida. (View the special report on Hurricane Ian HERE.)
- Rainfall was variable during the month, with northern areas receiving below normal rainfall and central to southern regions receiving above normal rainfall, with surplus and flooding rainfall observed in areas impacted by Hurricane Ian.
- Monthly mean temperatures were near to above normal across that state in September.
- Dry conditions have set in for the western Panhandle region, where drought is likely to develop during the month of October.
Average temperatures in September were near normal to above normal across the state. Average temperature departures from normal ranged from -0.8 ̊F in Jacksonville to +1.5 ̊F in Orlando for the month (see Table 1 and Appendix 1 for select cities). Southeast Florida was the warmest part of the state in September. Based on monthly average maximum temperatures, Miami had its warmest September on record, and Jacksonville Beach had its 2nd-warmest September on record. Based on monthly mean temperatures, Miami had its 3rd-warmest September on record, and Homestead had its 5th-warmest September on record. Several daily high maximum and high minimum temperature records were set during the month.
Table 1. September average temperatures and departures from normal ( ̊F) for selected cities.
| Station | Mean Temperature | Departure from Normal |
| Pensacola | 80.5 | +0.5 |
| Tallahassee | 79.1 | 0.0 |
| Jacksonville | 78.0 | -0.8 |
| Orlando | 82.5 | +1.5 |
| Tampa | 83.2 | +0.5 |
| Miami | 84.3 | +1.3 |
| Key West | 83.4 | -0.7 |
Rainfall totals in September were below normal across north Florida and well above normal in central and south Florida. The monthly precipitation departures from normal ranged from -4.41 inches in Pensacola to +16.05 inches in Orlando (see Table 2 and Appendix 1 for more locations). During the early to middle part of the month, areas of south-central and central Florida had received above normal rainfall for the month, while north Florida and much of southeast Florida had received below normal rainfall for the month. In late September, Hurricane Ian’s extensive rainfall across much of southwest, central, and eastern Florida made a large impact on monthly rainfall. The storm even reversed year-to-date rainfall deficits previously seen in Orlando and Miami, which went from a deficit of 5.2 inches each to a surplus of 10.8 inches and 2.7 inches, respectively. The storm resulted in it being the wettest September on record for Orlando, Sanford, Daytona Beach, and the 2nd wettest September on record at Kissimmee. Key West had its 5th-wettest September on record. Storm rainfall totals are shown in Appendix 2. Many daily rainfall records were also broken during the month (Appendix 3).
Table 2. September precipitation totals and departures from normal (inches) for selected cities.
| Station | Total Rainfall | Departure from Normal |
| Pensacola | 2.20 | -4.41 |
| Tallahassee | 2.25 | -2.66 |
| Jacksonville | 5.53 | -2.03 |
| Orlando | 22.42 | +16.05 |
| Tampa | 11.90 | +5.81 |
| Miami | 12.15 | +1.93 |
| Key West | 12.06 | +4.82 |
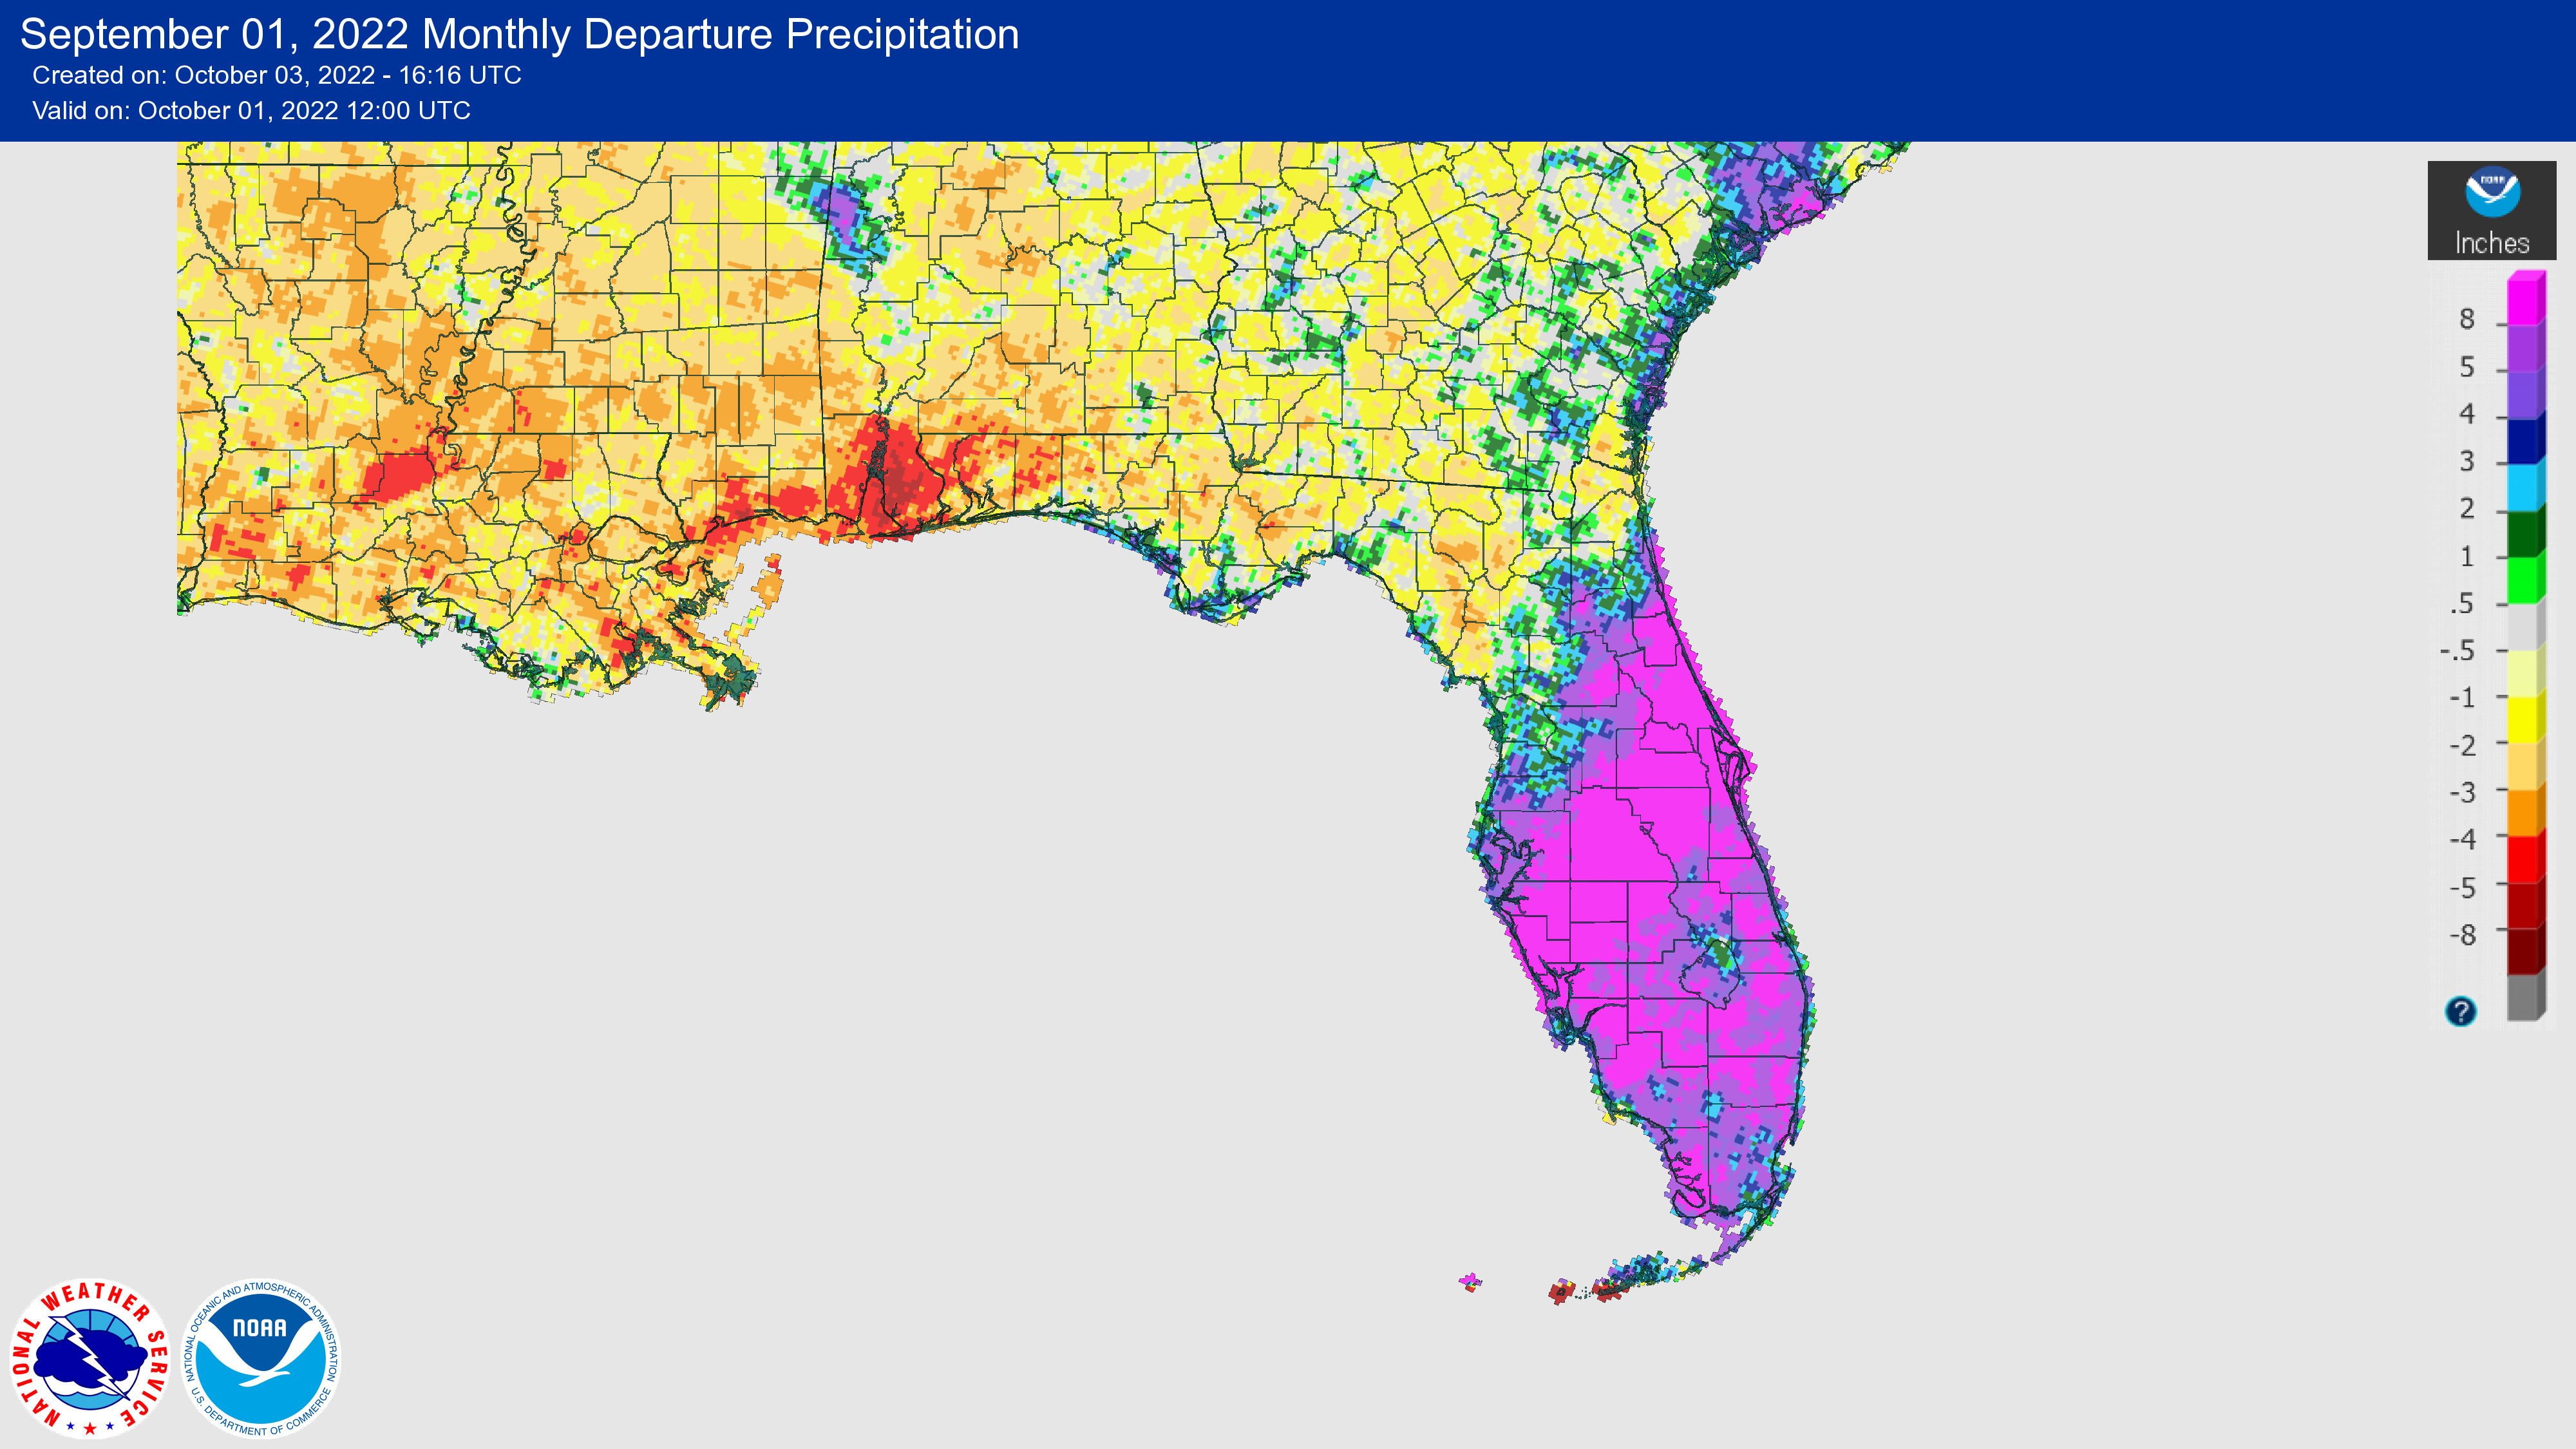
Figure 1. A graphical depiction of the monthly rainfall departure from normal (inches) for September (courtesy of NOAA, NWS).
La Niña Advisory.
La Niña is expected to continue through the winter, with a 91% chance in September-November, decreasing to a 54% chance in January-March 2023. Below average sea surface temperatures remained in the eastern Pacific Ocean throughout the month, and overall the coupled ocean-atmosphere system continued to reflect La Niña. Looking ahead, the dynamical versus statistical model forecasts are split, with the latter suggesting La Niña will last longer through the January-March 2023 timeframe, but large uncertainty exists over how long it will last and when it will transition to ENSO-neutral (56% chance during February-April 2023).
Hazardous Weather Events in September.
According to the Local Storm Reports issued by the local National Weather Service offices serving Florida, there were 685 individual local reports of hazardous weather events recorded across the state during the month of September (see Table 4 for a breakdown by event type). From early to mid-month, several areas saw thunderstorms with heavy rainfall and wind gusts reaching over 40 mph. On September 1, a wind gust of 62 mph was reported at the Orlando Executive Airport, which caused two small private aircraft to overturn leading to one fatality and one injury. Parts of Lake and Seminole Counties saw heavy rainfall on the 9th of between 4.15 and 4.53 inches that day. Between 7.0 and 8.8 inches of rain was reported in Bay and Walton Counties on the 11th with some reports of flooding. Another round of heavy rain was reported in Volusia and Brevard Counties on the 15th, with between 3.46 and 8.47 inches of rain causing some flooding on roadways. On the same day, flooding and water rescues from partially submerged vehicles were reported in Manatee County.
Hurricane Ian made landfall in Southwest Florida at the end of the month on September 28 near Cayo Costa, a barrier island just west of Fort Myers, as a strong Category 4 hurricane. Ian’s outer rain bands began to affect the Florida Keys and south Florida as early as September 26 with strong wind and heavy rain as it approached Florida from the south and southwest. Ian’s expansive rain bands also produced multiple tornadoes reported in Monroe, Broward, Miami-Dade, Palm Beach, and Brevard Counties. Reports of storm surge and flooding began in Monroe and Collier Counties on the 28th. Storm surge and winds over 100 mph began around 2:45 pm on the 28th, around the time of landfall. Multiple storm surge reports of 3-4 feet and as high as first story roofs or first level parking garages were made in and around Naples to Fort Myers Beach on the 28th. A report from North Naples stated that they went from “dry to 5 feet of surge in 20 minutes.” Official high-water marks and peak surge levels from Ian have yet to be released. Flooding from heavy rainfall and storm surge also impacted central and eastern Florida on the 29th, with some of the hardest impacted areas located in Osceola, Orange, and Seminole Counties and also from Volusia up through Nassau Counties along the eastern coastline. In addition, several critical facilities were impacted by storm surge and flooding, including fire stations and healthcare facilities.
Table 4. Breakdown of storm reports submitted in Florida during the month of September (compiled from Iowa State University/Iowa Environmental Mesonet).
| Report Type | Number of Reports |
| Flash Flood | 34 |
| Heavy Rain | 69 |
| Flood | 27 |
| Coastal Flood | 7 |
| Lightning | 5 |
| Hail | 2 |
| Marine Thunderstorm Wind | 36 |
| Non-Thunderstorm Wind Gust | 17 |
| Non-Thunderstorm Wind Damage | 1 |
| Tornado/Waterspout/Funnel Cloud | 13/19/10 |
| Thunderstorm Wind Damage | 23 |
| Thunderstorm Wind Gust | 68 |
| Wildfire | 2 |
| High Surf | 2 |
| Storm Surge | 38 |
| Tropical Storm | 269 |
| Hurricane | 43 |
Daily Record Events in September.
Table 5.Summary of daily records broken or set in Florida in September (source: NCEI Daily Weather Records).
| Category | Number of Records |
| Highest daily max. temp. | 45 |
| Highest daily min. temp. | 19 |
| Lowest daily max. temp. | 25 |
| Lowest daily min. temp. | 8 |
| Highest daily precipitation | 44 |
| Total | 141 |
Weather/Climate Highlight of the Month: Hurricane Ian
Hurricane Ian was a large category 4 storm that brought wide-ranging impacts to much of the state, including the south, central, and eastern regions of Florida, with high winds, powerful storm surge, and heavy rain. Ian underwent rapid intensification, developing from a category 1 into a category 4 storm with maximum sustained winds of 155 mph in less than a day as it approached Florida, making it just shy of a category 5 hurricane (157+ mph). At landfall, its maximum sustained winds were 150 mph. Based on wind speed, Ian ranks in a 3-way tie for 4th strongest storm to ever make landfall in Florida, tied with Hurricane Charley in 2004 and the Florida Keys hurricane of 1919. The top 3 strongest storms that have made landfall in Florida were the 1935 Labor Day Hurricane at 185 mph, Hurricane Andrew in 1992 at 165 mph, and Hurricane Michael in 2018 at 160 mph. These three storms are also the only category 5 hurricanes on record to strike Florida.
Drought-Related Impacts.
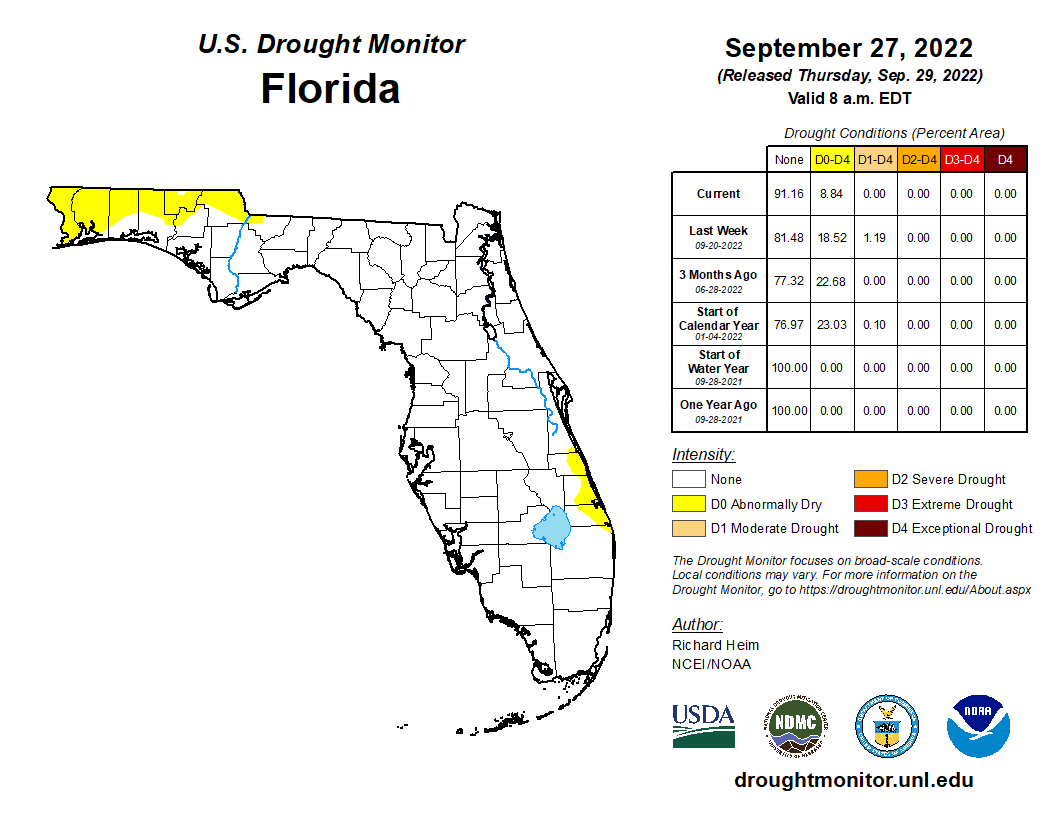
At the beginning of September, much of Southeast Florida was experiencing abnormally dry conditions (D0) and eastern coastal areas were in moderate drought (D1). As of September 6, about 2.55% of the state was in moderate drought (D1) and 17.95% was abnormally dry, according to the U.S. Drought Monitor. As of September 27, drought had disappeared and abnormally dry conditions emerged in the western Panhandle, with about 9% of the state being abnormally dry (Figure 2 below).
As of September 30, the Lake Okeechobee water level was 13.76 ft. above sea level (Feet-NGVD29), which is above average for this time of the year. The water level rose above water shortage management levels mid to late in the month. At the first of the month, the water level was 12.56 ft. above sea level.
Figure 2. A graphical depiction of the current drought conditions in Florida according to the U.S. Drought Monitor (courtesy of the National Drought Mitigation Center, University of Nebraska-Lincoln).
Agriculture-Related Impacts.
In mid-September, topsoil moisture conditions were adequate in 81% of the state, short in 8%, and very short in 0% of the state, while 11% of the state was in surplus. Near the end of September, topsoil moisture levels were adequate in 69% of the state, short in 17%, and very short in 2% of the state; 12% of the state was in surplus. Rainfall during the month and from Hurricane Ian will likely have impacts to citrus, vegetables, and other crops, but official assessments have yet to be made. For more information, consult the Crop Progress and Conditions report, which is published by the USDA's National Agricultural Statistics Service.
Appendix 1
Additional September departures from normal data for select Florida locations (Source: NWS).
| Station | Average Temperature (˚F) | Departure from Normal (˚F) | Total Rainfall (in.) | Departure from Normal (in.) |
| Gainesville | 78.4 | 0.0 | 3.76 | -1.29 |
| Sarasota | 80.4 | -1.8 | 14.54 | +8.54 |
| Melbourne | 80.8 | -1.3 | 15.51 | +7.88 |
| Fort Myers | 83.6 | +1.4 | 13.92 | +4.92 |
| West Palm Beach | 82.7 | +0.8 | 11.86 | +3.90 |
Appendix 2
Hurricane Ian daily rainfall totals, in inches, from September 27 - 30 for select locations; an “M” denotes missing data. Rainfall is generally reported for the proceeding 24 hours ending at 7:00 am each day (sources: NWS Coop, CoCoRaHS).
| Station | Rainfall reported on 9/27 | Rainfall reported on 9/28 | Rainfall reported on 9/29 | Rainfall reported on 9/30 | Total Rainfall from 9/27-9/30 |
| Marco Island | 0.59 | 2.04 | 1.35 | 0.00 | 3.98 |
| Port Charlotte | 1.53 | 3.15 | 14.72 | 0.00 | 19.40 |
| Nokomis | 0.12 | 2.95 | 14.20 | 0.00 | 17.27 |
| Lake Suzy | 0.16 | 3.63 | 11.71 | 0.00 | 15.50 |
| Venice | 0.66 | 3.35 | 0.00 | 0.00 | 4.01 |
| Bradenton | 0.46 | 7.09 | 1.20 | M | 8.75 |
| Frostproof | 2.84 | 1.61 | 12.00 | 0.05 | 16.50 |
| Desoto City | M | 2.72 | 4.48 | M | 7.20 |
| Orlando | 0.09 | 7.72 | 5.39 | 0.00 | 13.20 |
| Sanford | 0.00 | 0.35 | 11.20 | 2.12 | 13.67 |
| Daytona Beach | 0.00 | 1.97 | 4.80 | 14.72 | 21.49 |
| Kissimmee | 0.60 | 0.55 | 13.60 | 0.27 | 15.02 |
| Titusville | 0.17 | 7.81 | 4.30 | M | 12.28 |
| Oviedo | 0.00 | 1.30 | 13.66 | 0.84 | 15.80 |
| New Smyrna Beach | 0.00 | 0.55 | 15.12 | 5.42 | 21.09 |
| Edgewater | 0.00 | 0.26 | 16.27 | 2.49 | 19.02 |
| Flagler Beach | 0.00 | 0.17 | 3.26 | 1.00 | 4.79 |
| St. Augustine | 0.00 | 1.78 | 4.62 | 0.0001 | 6.40 |
| Hastings | 0.00 | 0.14 | 5.06 | 2.68 | 7.88 |
Appendix 3
Select daily record high precipitation values broken during September (compiled from NOAA).
| Location | Date | Record (in.) | Broken/Tied | Last |
| Cross City | 1 | 2.82 | Broken | 2.65 in 1985 |
| Tampa | 1 | 2.74 | Broken | 2.22 in 2021 |
| Bartow | 2 | 5.12 | Broken | 2.72 in 1893 |
| Fort Myers | 7 | 3.12 | Broken | 3.03 in 1955 |
| Key West | 7 | 2.16 | Broken | 1.75 in 2007 |
| Naples | 9 | 2.00 | Broken | 1.70 in 1989 |
| Panama City | 12 | 2.70 | Broken | 2.30 in 2015 |
| Miami | 14 | 2.61 | Broken | 1.79 in 1993 |
| Melbourne | 18 | 3.48 | Broken | 2.30 in 1956 |
| Kissimmee | 21 | 2.12 | Broken | 1.67 in 1948 |
| Key West | 26 | 3.08 | Broken | 1.99 in 1968 |
| Key West | 27 | 4.18 | Broken | 3.70 in 1987 |
| Miami | 27 | 3.54 | Broken | 3.07 in 2005 |
| Fort Lauderdale | 28 | 4.10 | Broken | 3.33 in 1943 |
| Naples | 28 | 2.70 | Broken | 1.73 in 2001 |
| Stuart | 28 | 3.51 | Broken | 3.00 in 1992 |
| Vero Beach | 28 | 3.95 | Broken | 2.78 in 1992 |
| Orlando | 28 | 7.72 | Broken | 2.66 in 2010 |
| Daytona Beach AP | 28 | 5.22 | Broken | 3.79 in 1995 |
| Fort Myers | 28 | 2.46 | Broken | 2.12 in 1929 |
| Daytona Beach | 29 | 4.80 | Broken | 2.48 in 1938 |
| Hastings | 29 | 5.06 | Broken | 1.03 in 1979 |
| Plant City | 29 | 4.76 | Broken | 3.69 in 1949 |
| Sanford | 29 | 11.20 | Broken | 2.05 in 2012 |
| Orlando | 29 | 5.39 | Broken | 1.84 in 2014 |
| Daytona Beach AP | 29 | 7.91 | Broken | 2.17 in 1979 |
Prepared by Florida Climate Center
The Florida State University
Tallahassee, FL
Key Points:
- Monthly average temperatures in October were below to near normal across the state.
- Precipitation was below normal across the state and, as we head into the dry season, drought is an increasing concern.
- Drought developed in the western Panhandle during the month; areas of severe drought (D2) spread eastward into parts of Leon and Wakulla Counties as of November 1st. Abnormally dry conditions (D0) spread as far east as Nassau County. Hurricane Ian eliminated drought and dry conditions in southeastern Florida.
- A La Niña advisory continues with a 75% chance of persisting through the winter from December-February.
Average monthly temperatures in October were generally below to near normal across the state. Average temperature departures from normal ranged from -3.1 ̊F in Tallahassee to +0.4 ̊F in Miami for the month (see Table 1 and Appendix 1 for select cities). A ridge of high pressure dominated the weather pattern early in the month, with cooler fall-like temperatures and lower humidity in much of the state. This was followed by a very strong trough across the Southeast U.S., which brought arctic air to northern parts of the state during the middle of the month. Many places in north and central Florida experienced record low temperatures. On the 20th, Tallahassee recorded a daily record low of 31°F and Pensacola recorded a low of 40°F, which was 26°F and 20°F below the normal daily low temperature for this date, respectively. Cross City smashed its record low on the 20th at 31°F, which was previously 42°F set on this date in 2011. Most places across north Florida saw several nights with minimum temperature 15-20°F below normal from the 19th-22nd. The month ended with much warmer than normal temperatures, as daily maximum temperatures climbed to around +10°F above normal across north and central Florida on the 31st. Daily low minimum temperature records tied or broken during the month are provided in Appendix 2.
Table 1. October average temperatures and departures from normal ( ̊F) for selected cities.
| Station | Mean Temperature | Departure from Normal |
| Pensacola | 69.2 | -2.1 |
| Tallahassee | 67.2 | -3.1 |
| Jacksonville | 68.5 | -2.7 |
| Orlando | 75.7 | +0.2 |
| Tampa | 75.7 | -1.7 |
| Miami | 80.5 | +0.4 |
| Key West | 80.1 | -1.2 |
Monthly rainfall totals in October were below normal. The monthly precipitation departures from normal ranged from -3.55 inches in Pensacola to -1.24 inches in Tampa (see Table 2 and Appendix 1 for additional locations). Continued dryness in the Panhandle has led to the development of drought across the region (see drought section below). Annual precipitation surpluses in Pensacola and Tallahassee continue to shrink due to below-normal rainfall over the past couple of months, now at just +2.3 and +2.4 inches above normal for the year, respectively. Areas of the southeast coast are around 10 inches below normal for the year so far, including Vero Beach (-10.8 in.), Stuart (-13.3 in.), West Palm Beach (-10.8 in.), and Ft. Lauderdale (-15.6 in.). A late month system brought some rain but not enough to alleviate drought concerns. Dry conditions are expected to persist into November.
Table 2. October precipitation totals and departures from normal (inches) for selected cities.
| Station | Total Rainfall | Departure from Normal |
| Pensacola | 1.15 | -3.55 |
| Tallahassee | 0.22 | -3.02 |
| Jacksonville | 1.60 | -2.43 |
| Orlando | 2.14 | -1.32 |
| Tampa | 1.10 | -1.24 |
| Miami | 4.85 | -2.80 |
| Key West | 2.78 | -2.89 |
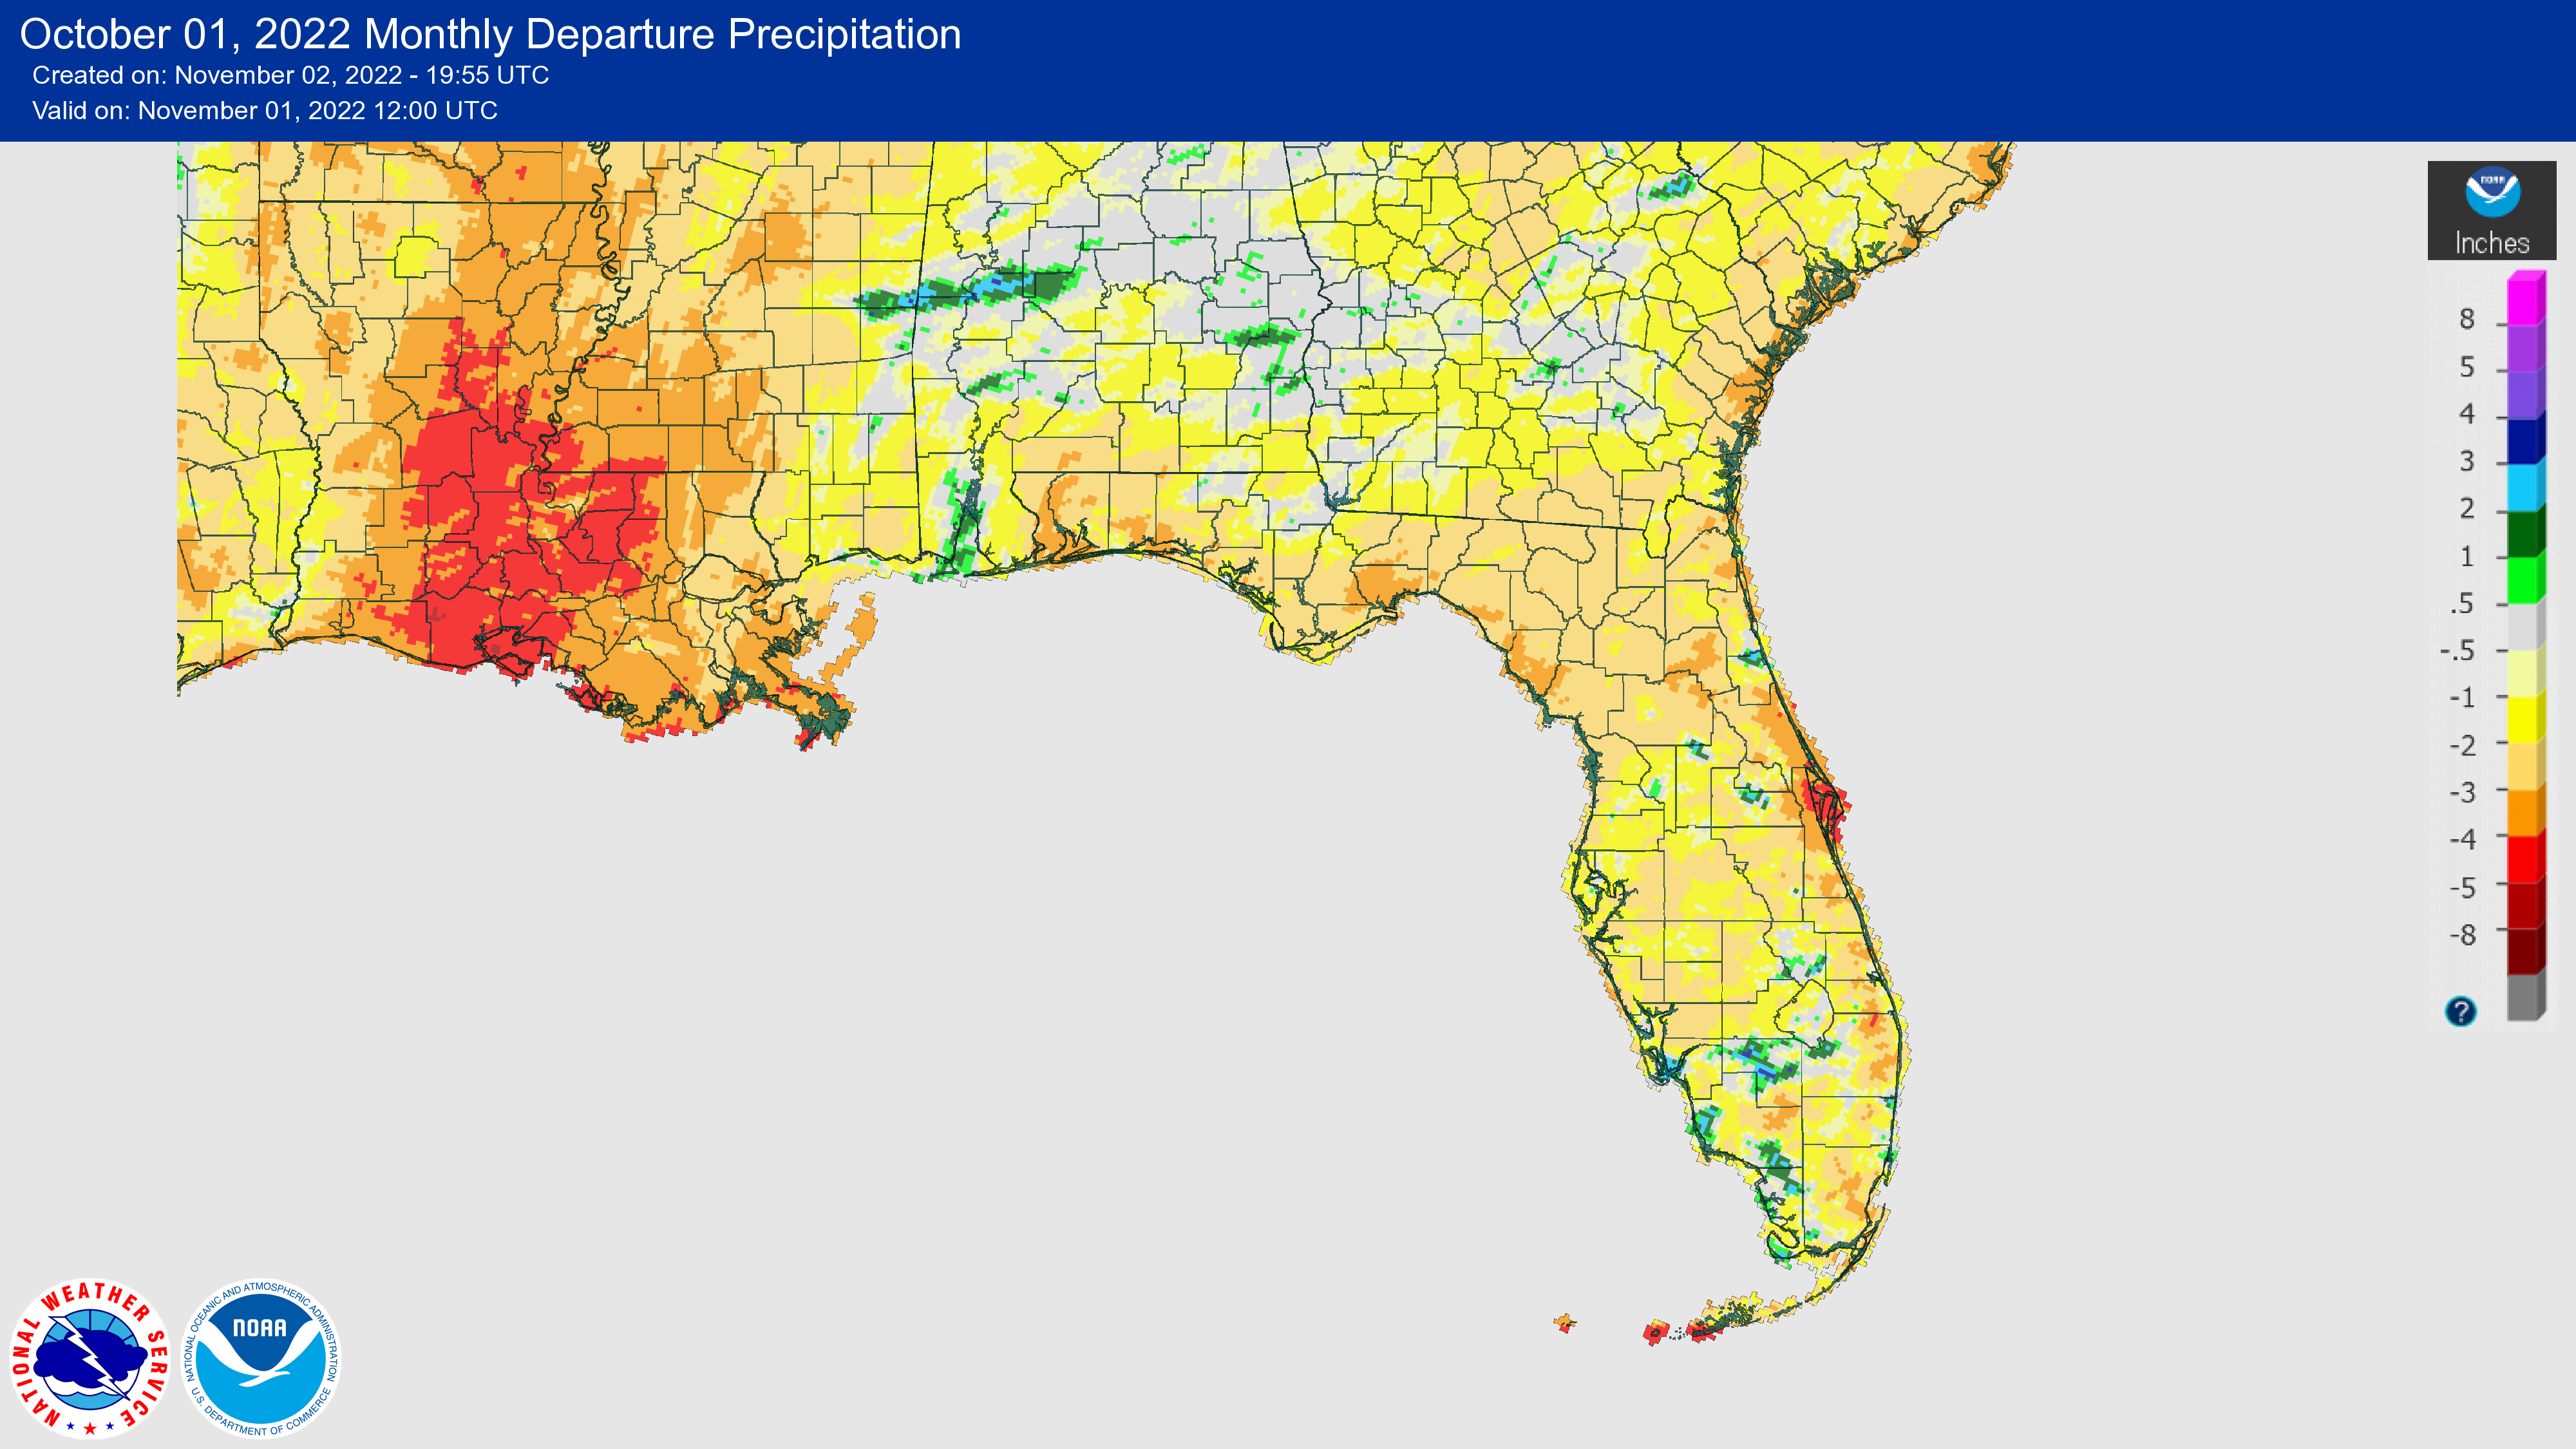
Figure 1. A graphical depiction of the monthly rainfall departure from normal (inches) for October (courtesy of NOAA, NWS).
La Niña Advisory.
La Niña is expected to continue through the Northern Hemisphere winter, with a 75% chance in December-February. There is a 54% chance for a transition to ENSO-neutral conditions during February-April 2023. Below average sea surface temperatures remained in the eastern equatorial Pacific Ocean during September, and overall the coupled ocean-atmosphere system continues to reflect La Niña. There is still some uncertainty over how long La Niña may last. The next ENSO update is scheduled for November 10.
Hazardous Weather Events in October.
According to the Local Storm Reports issued by the local National Weather Service offices serving Florida, there were 56 individual local reports of hazardous weather events recorded across the state during the month of October (see Table 4 for a breakdown by event type). Thunderstorm activity produced isolated heavy rain of several inches during the middle and end of the month in Orange County. There were several small tornadoes during the latter half of the month, but no injuries or fatalities were reported.
Table 4. Breakdown of storm reports submitted in Florida during the month of October (compiled from Iowa State University/Iowa Environmental Mesonet).
| Report Type | Number of Reports |
| Flash Flood | 1 |
| Heavy Rain | 13 |
| Flood | 8 |
| Lightning | 0 |
| Hail | 11 |
| Marine Thunderstorm Wind | 1 |
| Non-Thunderstorm Wind Gust | 0 |
| Non-Thunderstorm Wind Damage | 0 |
| Tornado/Waterspout/Funnel Cloud | 4/6/1 |
| Thunderstorm Wind Damage | 1 |
| Thunderstorm Wind Gust | 10 |
| Wildfire | 0 |
Daily Record Events in October.
Table 5.Summary of daily records broken or set in Florida in October (source: NCEI Daily Weather Records).
| Category | Number of Records |
| Highest daily max. temp. | 9 |
| Highest daily min. temp. | 4 |
| Lowest daily max. temp. | 26 |
| Lowest daily min. temp. | 30 |
| Highest daily precipitation | 7 |
| Total | 76 |
Weather/Climate Highlight of the Month:
Early season cold temperatures affected the Panhandle and North Florida during the middle of the month. Minimum temperatures dipped down to 31°F in Tallahassee and 37°F in Gainesville on the 20th, which was 26°F and 22°F below normal for this day, respectively. In Tallahassee, freezing temperatures in October have occurred 10 times in the past since 1940, most recently in 2008.
Drought-Related Impacts.
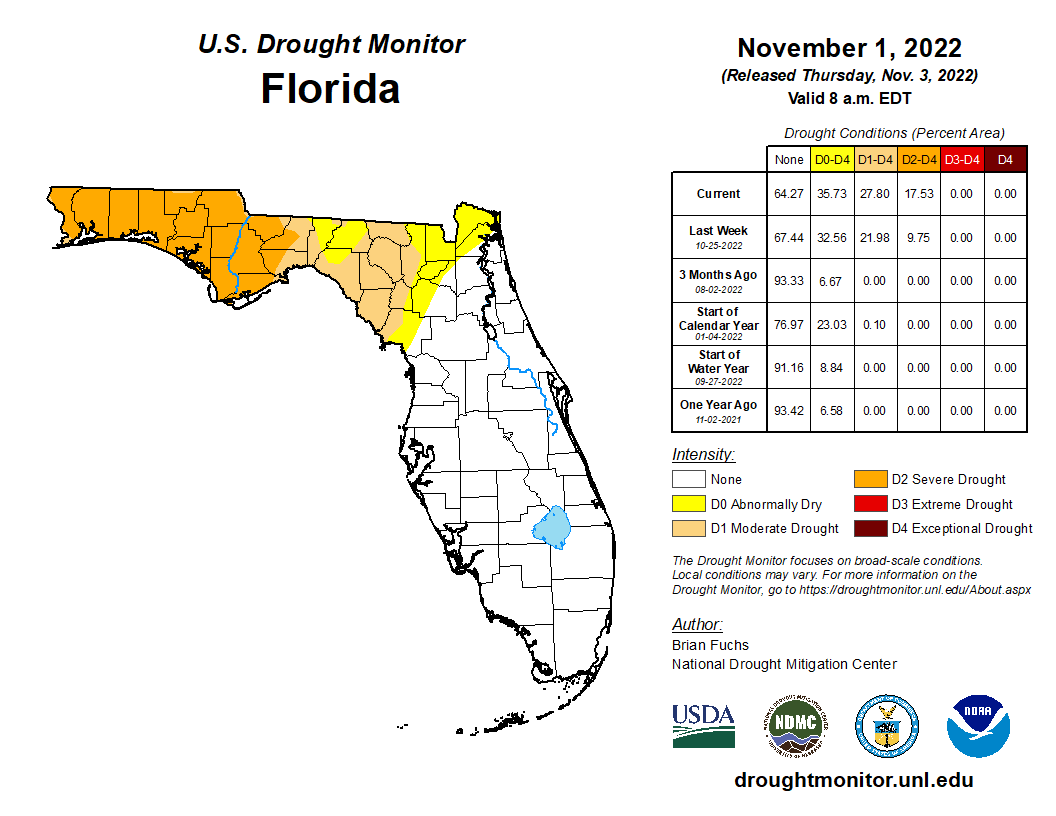
At the beginning of October, abnormally dry conditions expanded and worsened in the western Panhandle. About 7.5% of the area was experiencing abnormally dry conditions (D0) and 4% was in moderate drought (D1), according to the U.S. Drought Monitor. Throughout the month, little rainfall caused drought conditions to expand across the Panhandle and gradually moved east across North Florida. By the end of the month, 17.53% of the state was in severe drought (D2), 10.28% was in moderate drought (D1), and 7.92% was abnormally dry (D0) (Figure 2 below). Local drought impacts are high for grasslands and agriculture, while hydrological impacts remain low except in the Apalachicola-Chattahoochee-Flint (ACF) River Basin and the Big Bend region where streamflows are running much below normal.
As of October 31, the Lake Okeechobee water level was 15.85 ft. above sea level (Feet-NGVD29), which is above average for this time of the year. The water level rose throughout the month and has rebounded by over 2 feet since Hurricane Ian’s passage. At the first of the month, the water level was 13.87 ft. above sea level.
Figure 2. A graphical depiction of the current drought conditions in Florida according to the U.S. Drought Monitor (courtesy of the National Drought Mitigation Center, University of Nebraska-Lincoln).
Agriculture-Related Impacts.
In mid-October, topsoil moisture conditions were adequate in 51% of the state, short in 15%, and very short in 12% of the state, while 22% of the state was in surplus. At the end of October, topsoil moisture levels were adequate in 61% of the state, short in 22%, and very short in 10% of the state; 7% of the state was in surplus. Agricultural losses from Hurricane Ian are estimated to be approximately $417 million - $675 million to citrus, $153 million - $230 million to other fruits and vegetables, $86 to $160 million to field crops, $153 - $297 million to horticultural crops, $337 million - $492 million to animals and animal products, and $33 million to forestry, according to the Florida Department of Agriculture and Consumer Services. For more information, consult the Crop Progress and Conditions report, which is published by the USDA's National Agricultural Statistics Service.
Appendix 1
Additional October departures from normal data for select Florida locations (Source: NWS).
| Station | Average Temperature (˚F) | Departure from Normal (˚F) | Total Rainfall (in.) | Departure from Normal (in.) |
| Gainesville | 69.1 | -2.3 | 0.16 | -2.52 |
| Sarasota | 75.3 | -2.0 | 1.78 | -0.98 |
| Melbourne | 74.8 | -2.7 | 1.88 | -2.98 |
| Fort Myers | 78.1 | +0.1 | 1.59 | -1.49 |
| West Palm Beach | 78.4 | -0.3 | 2.66 | -3.24 |
Appendix 2
Select daily record low minimum temperatures (°F) broken or tied during October (compiled from NOAA).
| Location | Date | Record | Broken/Tied | Last |
| Moore Haven Lock | 1 | 62 | Broken | 64 in 1993 |
| Naples | 2 | 57 | Broken | 58 in 1976 |
| Plant City | 3 | 53 | Broken | 54 in 1929 |
| Cross City | 5 | 45 | Broken | 48 in 2014 |
| Lisbon | 13 | 47 | Broken | 52 in 1980 |
| Apalachicola | 19 | 39 | Broken | 45 in 1996 |
| Jacksonville Beach | 19 | 47 | Broken | 48 in 1967 |
| Jasper | 19 | 36 | Broken | 38 in 2009 |
| Marianna | 19 | 36 | Tied | 36 in 2009 |
| Pensacola | 19 | 37 | Broken | 41 in 1989 |
| Gainesville | 19 | 38 | Broken | 41 in 2009 |
| Cross City | 19 | 37 | Tied | 37 in 2009 |
| Lakeland | 19 | 51 | Broken | 52 in 1955 |
| Crestview | 19 | 33 | Tied | 33 in 2009 |
| Jacksonville | 19 | 42 | Broken | 43 in 2009 |
| Tallahassee | 19 | 33 | Broken | 36 in 2009 |
| Apalachicola | 20 | 36 | Broken | 42 in 1989 |
| Cross City | 20 | 33 | Broken | 34 in 1967 |
| Jasper | 20 | 33 | Broken | 35 in 1967 |
| Lisbon | 20 | 44 | Broken | 45 in 1989 |
| Ocala | 20 | 40 | Tied | 40 in 1981 |
| Perry | 20 | 31 | Broken | 34 in 1989 |
| Usher Tower | 20 | 36 | Broken | 38 in 1967 |
| Marianna | 20 | 34 | Broken | 41 in 2011 |
| Gainesville | 20 | 37 | Broken | 38 in 1989 |
| Cross City | 20 | 31 | Broken | 42 in 2011 |
| Crestview | 20 | 28 | Broken | 31 in 1989 |
| Jacksonville | 20 | 39 | Broken | 40 in 1989 |
| Tallahassee | 20 | 31 | Broken | 34 in 1996 |
| Quincy | 21 | 33 | Tied | 33 in 1989 |
| Marianna | 21 | 38 | Broken | 40 in 2011 |
| Cross City | 21 | 35 | Broken | 37 in 2011 |
| Apalachicola | 22 | 42 | Broken | 44 in 1987 |
Building A, Suite 292
Tallahassee, FL 32306-2741
Phone: (850) 644-3417 | (850) 644-0719
climate@coaps.fsu.edu