


The Florida Climate Center serves as the primary resource for climate data, information, and services in the state of Florida.

The Florida Climate Center achieves its mission by providing climate monitoring, research, and expertise to be applied by the people, institutions, and businesses of Florida and the surrounding region.
We provide direct service by fulfilling requests for climate and weather data and information in a variety of formats.
We perform research that advances the understanding of the climate variability and changes of Florida and the surrounding region.
We provide outreach in presentations and at events aimed at a variety of groups, interests, and ages.
Prepared by Melissa Griffin and David F. Zierden
Thanks to L. Zuromski
Florida Climate Center
The Florida State University
Tallahassee, FL

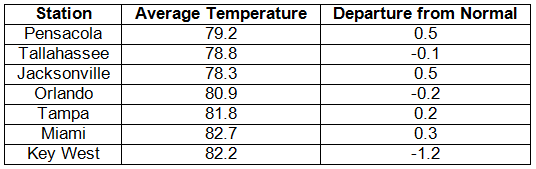
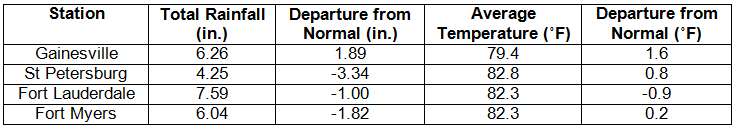
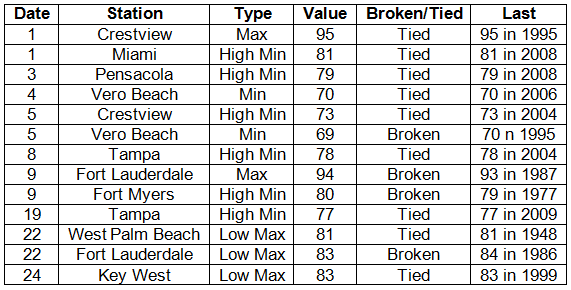
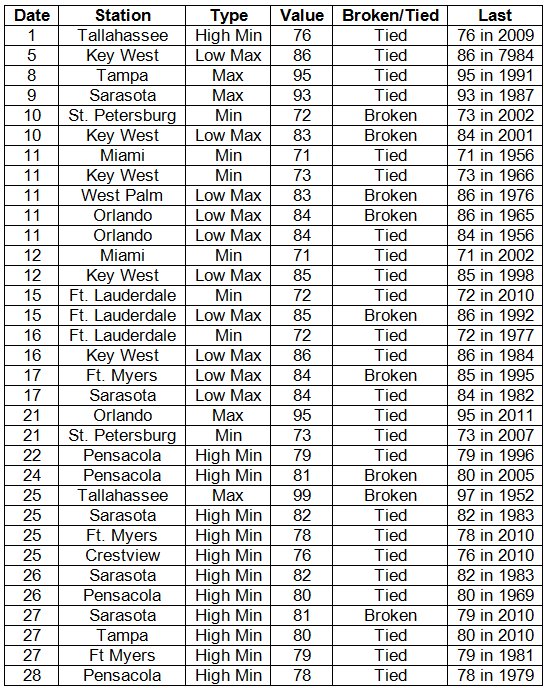
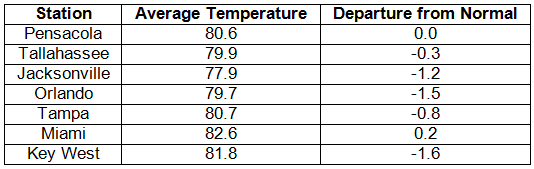
Average temperatures varied across the state in September. Average temperatures were below normal to slightly above normal for September across the entire state (Table 1 and Appendix 1). Departures from normal ranged from -1.2˚F at Key West to 0.5˚F in Pensacola and Tampa. The average maximum temperatures at most reporting stations were cooler than normal, while the recorded average minimum temperatures were above normal for the second month in a row. No station reported a temperature over 100˚F during September, and roughly 15 stations across the state reported a high temperature over 95˚F. The month only saw about a dozen temperature records either tied or broken (Appendix 2), with the majority of those being from low maximum or high minimum temperatures.
Table 1: September average temperatures and departures from normal (° F) for selected cities.
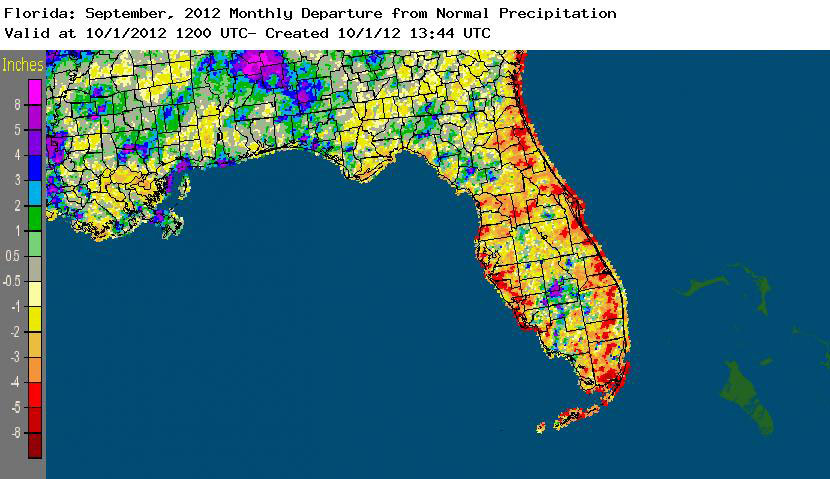
Rainfall totals varied across the state in September. Rainfall totals across the state varied in September (Table 2), though most of the coastal communities in Florida saw below normal precipitation for the month. Areal patterns of monthly rainfall relative to normal are depicted in Figure 1 and show how portions of north Florida reported near to above normal rainfall, along with areas southwest of Alachua County and interior portions of South Florida. Only a few precipitation records were broken in September (Table 3). Year to date (01/01/12 to 9/30/12) rainfall totals from some locations along the southeast coast (i.e., Miami, West Palm Beach, and Fort Lauderdale) have already reported rainfall amounts above their average annual totals and, with 3 months left in the year, it could mean 2012 may be the wettest year on at some locations.
Table 2: September precipitation totals and departures from normal (inches) for selected cities.
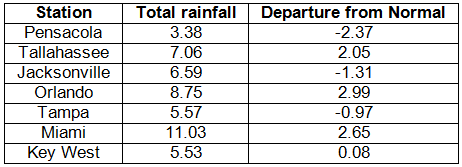
Table 3: Select daily rainfall records (inches) broken during September (compiled from NOAA, NWS).
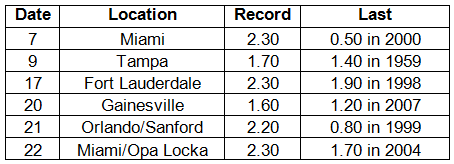
Figure 1: A graphical depiction of the monthly rainfall departure from normal (inches) for September is given in the figure below (courtesy of NOAA, NWS).
ENSO-neutral conditions continue in the Pacific. Neutral ENSO conditions continue to be reported for the equatorial Pacific. Equatorial sea surface temperatures (SST) are greater than 0.5˚C above average across the eastern Pacific Ocean. There is still a chance for El Niño to form and continue through the winter of 2012-2013. The Climate Prediction Center (CPC) predicts normal temperatures for the state and is predicting above normal precipitation in the western Panhandle through December.
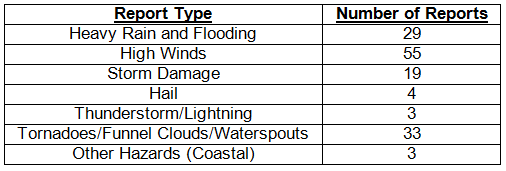
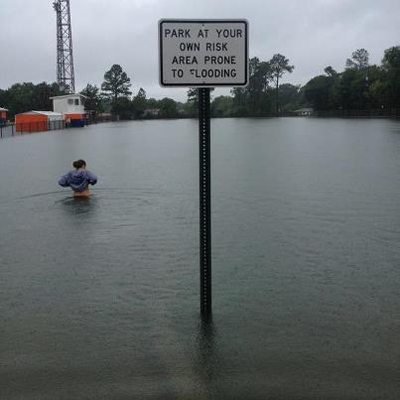
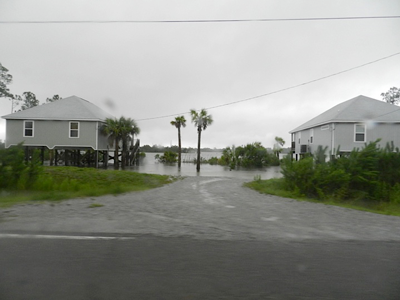
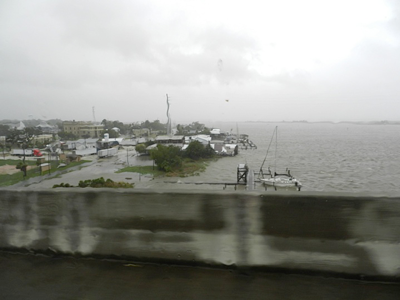
Hazardous weather events in September After a fairly active August, September saw a drop in the number of hazardous weather reports across the state. Multiple waterspouts were reported in the Keys at the beginning of the month, along with a funnel cloud near Weston, FL. On September 5, many flooding reports came in from portions of Walton County, especially around DeFuniak Springs, from heavy rains that had fallen the day before in the same area. Also on the 5th, high winds (up to 60 mph), pea-sized hail and storm damage were recorded in and around the Fort Lauderdale area. More high winds, hail, and storm damage, along with some flooding and heavy rains, were reported in coastal areas from Palm Coast southward to Miami on the 6th and 7th. From September 8th-16th, most of the hazardous weather reports came from peninsular Florida, and the reports ranged from strong rip currents (resulting in one fatality) along Cocoa Beach to multiple waterspouts in the lower Keys and high wind reports from Tampa (gusts over 45 mph). Lightning strikes on the 17th and 18th in the Big Bend caused a large apartment complex fire in Panama City Beach and a fire in two separate homes in Leon County. The line of storms caused flooding in Madison County and multiple reports of storm damage and high wind as it pushed through the state. A severe storm produced dime sized hail in Fort Myers on the 20th. On the 22nd, heavy rains impacted portions of Miami and Fort Lauderdale, causing major flooding in both locations. The Miami NWS Office on the campus of Florida International University recorded 6.23” of rainfall during the event.
Table 4: Breakdown of storm reports submitted in Florida during the month of September (compiled from Southeast Regional Climate Center).
Agricultural and other climate-related impacts. At the beginning of September, there was concern about how the rainy summer (combined with two tropical systems) had impacted crops. Hay harvesting in some areas had been put on hold, and problems with wet fields posed problems for cotton and peanut growers. Cotton boll rot and white mold were reported in areas, along with rust effects in soybeans and nutritional deficiencies in some crops. Vegetable growers resumed land preparation. Cattle conditions seem to improve across the state, as the ample rainfall provided good pasture conditions. Citrus groves began application of fall miticide and continued to prepare young trees for the upcoming citrus season. Toward the middle and end of the month, hay cutting and peanut inverting began, as growers were able to get back into the field. Sugarcane planting started, after being delayed due to muddy fields from Tropical Storm Isaac. Some reports of diseases found in cotton, peanuts and soybeans fields. Vegetable growers were disrupted with daily rainfall, and began staking, tying and spraying as needed. Harvest preparations for Navels and grapefruit were underway.
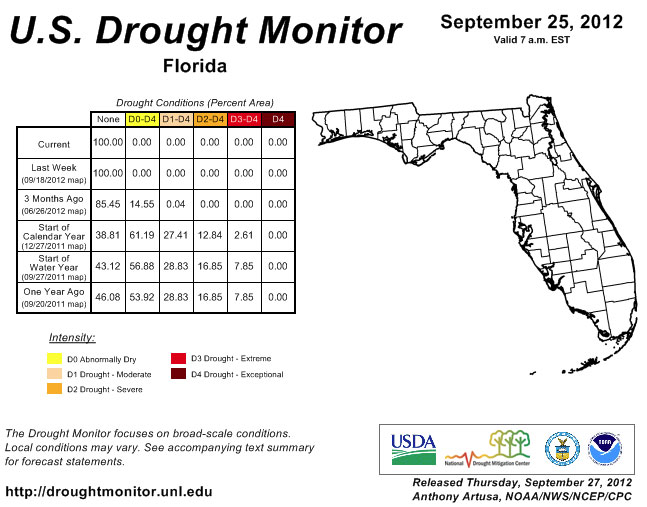
Since the September 4th release of the Drought Monitor, conditions have not changed. The state remains drought free, despite some areas having below normal rainfall for the month. Fall is a typically dry period for the state, though passing fronts and the occasional sea breeze storm will bring rainfall to portions of the state. Water levels reported at Lake Okeechobee have risen from 14.24 ft to 15.63 ft.
Figure 2: Drought conditions in Florida as of September 25, 2012 (courtesy of U.S. Drought Monitor).
Appendix 1: Additional September departures from normal data for Florida locations.
Appendix 2: Select daily maximum and minimum temperature records (° F) tied or broken during September (compiled from NOAA, NWS).
Prepared by Melissa Griffin and David F. Zierden
Florida Climate Center
The Florida State University
Tallahassee, FL
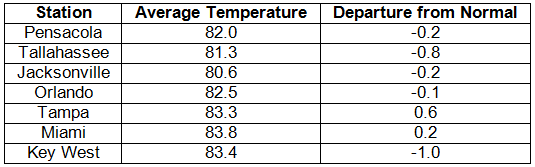
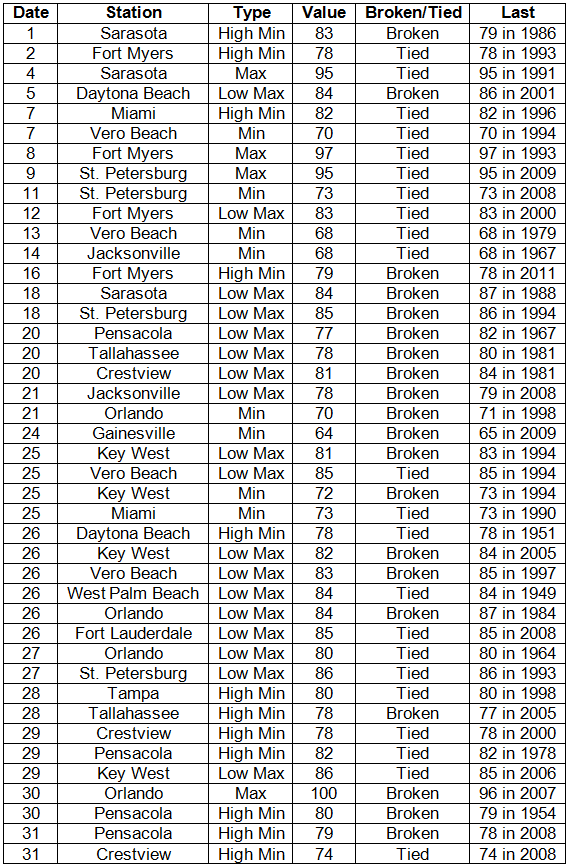
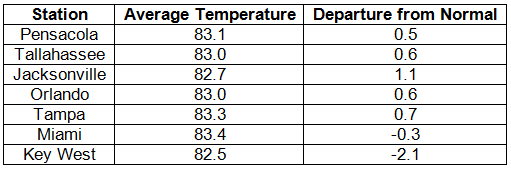
Average temperatures varied across the state in August. Average temperatures were below normal to above normal for August across the entire state (Table 1 and Appendix 1). Departures from normal ranged from -1.0˚F at Key West to 0.6˚F in Tampa. The average maximum temperatures at most reporting stations were cooler than normal in August, while the recorded average minimum temperatures were above normal. Only 4 record highs were broken in August, though the month saw numerous records tied or broken (Appendix 2), with the majority of those being from low maximum or high minimum temperatures.
Table 1: August average temperatures and departures from normal (° F) for selected cities.
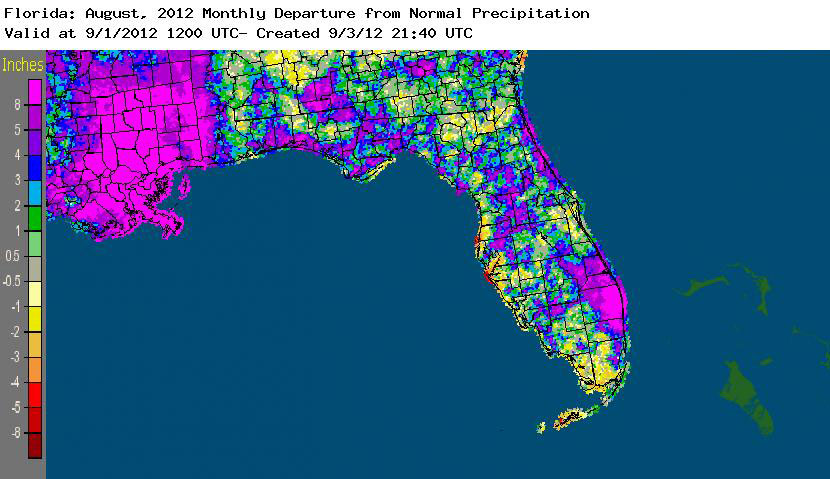
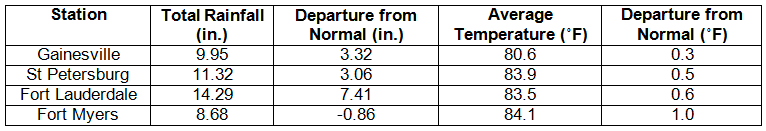
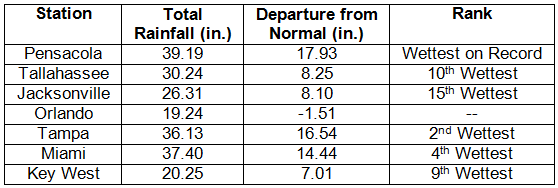
Rainfall totals varied across the state in August. Rainfall totals across the state varied in August (Table 2), though most of Florida saw above normal precipitation for the month. Areal patterns of monthly rainfall relative to normal are depicted in Figure 1 and show how areas around Tarpon Springs (near the Hillsborough and Pasco County line), Anna Maria Key (Manatee County), and the Keys were below normal, while portions of the Emerald Coast, First Coast, and Gold Coast saw above normal rainfall totals. At the end of the month, Tropical Storm Isaac brought torrential rainfall to parts of the state, breaking many 24-hour records in southern Florida (Table 3). August 2012 was the wettest on record at Niceville and West Palm Beach, the 4th wettest on record in Miami and Fort Lauderdale (Appendix 1), the 7th wettest on record in Pensacola, and the 9th wettest on record in Tallahassee. The summer as a whole proved to be extremely wet for numerous locations (Appendix 3).
Table 2: August precipitation totals and departures from normal (inches) for selected cities.
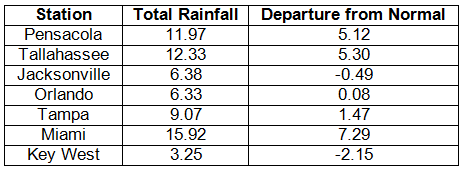
Table 3: Select daily rainfall records (inches) broken during August (compiled from NOAA, NWS).
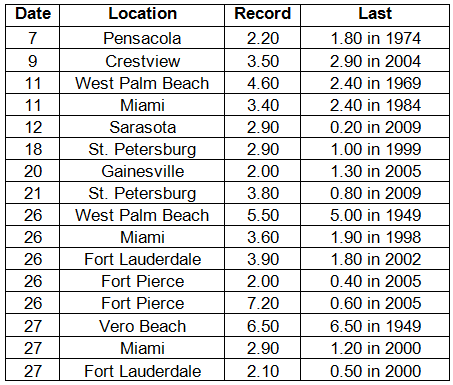
Figure 1: A graphical depiction of the monthly rainfall departure from normal (inches) for August is given in the figure below (courtesy of NOAA, NWS).
ENSO-neutral conditions continue in the Pacific. Neutral ENSO conditions continue to be reported for the equatorial Pacific. Equatorial sea surface temperatures (SST) are greater than 0.5˚C above average across the eastern Pacific Ocean. The chances have increased for El Niño to begin September 2012 and continue through the winter of 2012-2013. The Climate Prediction Center (CPC) predicts normal temperatures for the state and above normal precipitation in the western Panhandle through November.
Hazardous weather events in August. August was a fairly active month for hazardous weather across the state.
Table 4: Breakdown of storm reports submitted in Florida during the month of August. (Compiled from Southeast Regional Climate Center.)
Tropical Storm Isaac
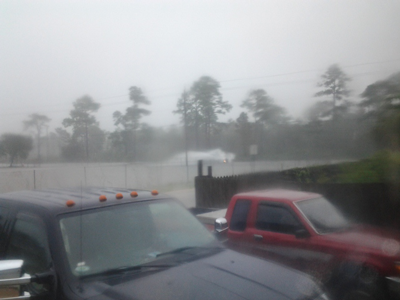
Tropical Storm Isaac passed just to the west of the Florida Keys before making landfall as a hurricane near Port Fourchon, LA, during the early morning hours of August 29. While Isaac never directly hit Florida, the size of the storm caused the impacts to be felt over a widespread area, affecting a large portion of the state. Here are just some of the impacts felt here in Florida during the storm:
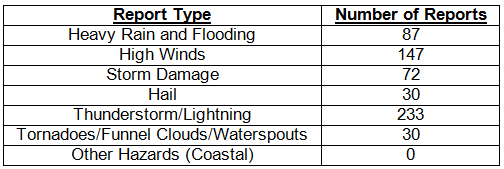
View from Brevard County prior to Isaac’s passage. Credit: FL-BV-11.
Tornadoes/Waterspouts
EF-0 tornados were reported in both Jackson (near Greenwood) and Holmes (Graceville) counties in the Panhandle. The Jackson County tornado touched down in a rural area and did little damage, while the tornado near Graceville uprooted some trees and tore a porch off a mobile home. Another EF-0 tornado touched down near Vero Beach (Indian River County) on the 27th and impacted the Vero Palm Estates Countryside Mobile Home Park. A waterspout moved ashore from Tampa Bay and damaged 6 residences on Maple Ave near 22nd Street in Tampa.
Storm Surge
The storm surge associated with Isaac ranged from a little over a foot to about 3.5 feet. However, once that is combined with the tide (which ranged from 2 to 4 feet), many areas saw coastal inundation with the surge. There was minor flooding in Saint Marks, FL (Wakulla County), and Water Street in Apalachicola (Franklin County) was under water. Saint George Island State Park reported surf passing the dune line and flooding the parking areas. Surf heights at the park were estimated between 6 and 8 feet and caused moderate beach erosion. St. Joe State Park (Gulf County) was closed due to water inundation, and some roads near downtown Panama City (Bay County) and West Bay were under water. Along Panama City Beach, moderate beach erosion was reported with surf estimated between 8 and 10 feet. Areas to the west of Panama City Beach also experienced high surf conditions and moderate erosion, along with strong rip currents. Most of the beaches along northwest Florida were closed prior to Labor Day Weekend.
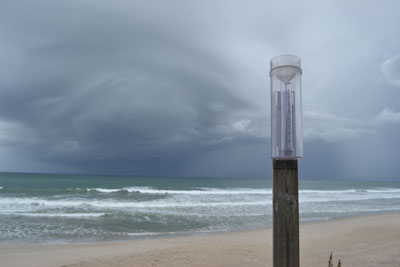
Damaged dunes along Okaloosa Island.
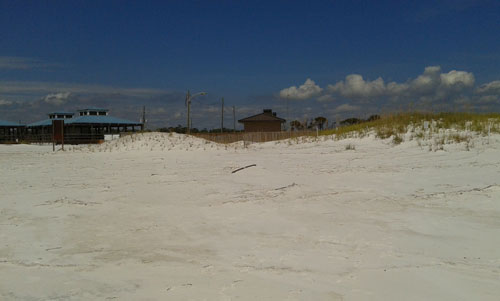
Surge also affected parts of coastal Levy, Pinellas, Lee, Hillsborough and Manatee counties, and there was flooding along the Hillsborough River during high tide. The high surge, in combination with the rainfall, led to flooding in East Venice (Sarasota County) near the Myakka River.
In South Florida, moderate to locally heavy beach erosion was reported along all south Florida beaches. The southern coast of Collier County had the highest surge in the south part of the state, with about 3 feet estimated from Marco Island to Everglades City, which caused some minor coastal flooding issues in low lying areas.
Rainfall/Flooding
Portions of Highlands and Polk counties received 4.00-6.00” of rain, and numerous reports of 4.00” rainfall came out of Pasco County. US 98, south of Sebring, was closed on the 27th due to standing water on the road. Central and southwest Florida saw 0.50”-4.00”, while the Panhandle and Big Bend regions reported 2.00”-5.00” from Isaac.
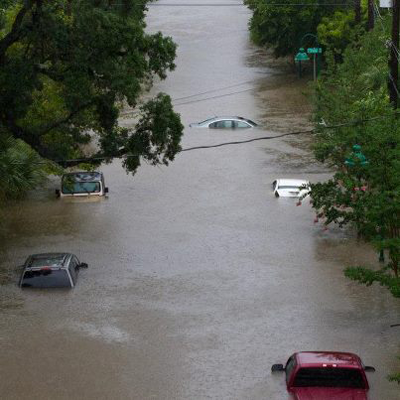
Southeast Florida took the brunt of the rainfall from Isaac with observed two-day rainfall totals from the area ranging between 3.00-16.00”. Significant flooding was reported in the metro area of Broward County (Lauderhill, Tamarac and Coral Springs). Roadways were mainly impacted, though some homes and businesses had water damage. Southwest metro area also had flooding issues, but not as bad as northern parts. Severe flooding was reported in large parts of metro Palm Beach County. The hardest hit area was from the Florida Turnpike to Boca Raton, with measured rainfall at 10.00-16.00”, though radar estimates were up to 20.00”. Wellington, Royal Palm Beach, and Loxahatchee suffered the worst of the flooding, with entire neighborhoods isolated by several feet of water and over topped canals.
Radar estimates of rainfall over south Florida. Credit: NWS Miami.
The National Hurricane Center will release its final report on Isaac (along with rest of the tropical storms/hurricanes that have impacted the United States) at the end of the 2012 Atlantic hurricane season.
Agricultural and other climate-related impacts. Levy and Gilchrist counties started to harvest peanuts at the beginning of August. Washington County saw a flurry of activity as corn, peanuts and soybeans were being harvested, while corn was picked in Madison County. Vegetable growers increased the pace of land preparation, fumigating and laying plastic for fall crops. Citrus fertilizer and grove maintenance continued. Statewide, most of the pasturelands had improved due to the frequent rainfall, though some issues with lingering drought, disease and insects had been reported. By the middle of the month, the frequent rains were causing a variety of issues in northern parts of the state. Rain caused harvesting and disease problems in Gulf (peanuts), Jefferson (peanuts) and Washington (peanuts and cotton) counties. Some pastures (Okaloosa and Jefferson counties) reported diseases. The sugarcane crop (Glades County) looked good, and preparations (Collier, Lee, Hendry, Glades and Charlotte counties) for fall vegetables continued. Rain continued to hinder harvesting operations in the northern part of the state toward the end of the month. In Washington County, rust on soybeans, white mold in peanuts and leaf spot in cotton were reported. Hillsborough County began preparations for strawberries. Cattle conditions across the state ranged from very poor to excellent, with most reporting fair to excellent, though pasture conditions in some areas were limited due to drought, disease and flooding depending on location. At the end of August, white mold (peanuts) was reported in Jackson, Jefferson and Santa Rosa counties. Cypress and wetlands saw water levels rise in many low areas. Gulf, Flagler, and Putnam counties halted hay harvesting due to the daily rains. Vegetable growers in southwestern counties were using throw-out pumps to control high water levels. Tropical Storm Isaac caused wide spread rain and flooding crop related issues across the state, though the rains did improve pasture conditions in some areas.
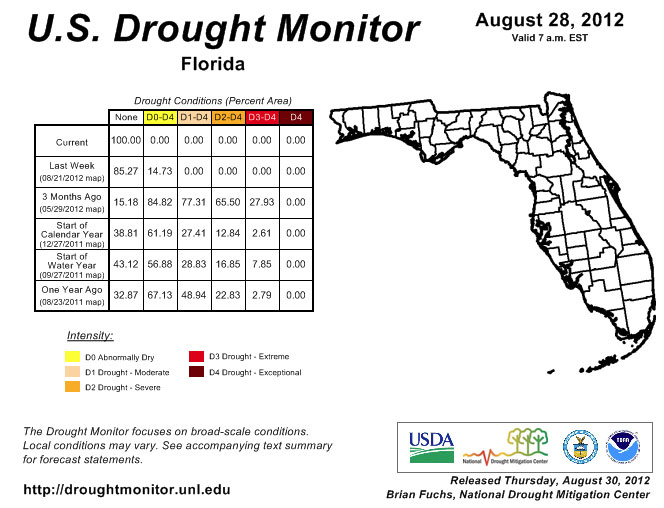
The frequent rains during the early part of August helped ease the lingering drought conditions across the state. Prior to Tropical Storm Isaac’s impact, all of the dry conditions (D0) across the Panhandle and in northeastern Florida had been alleviated by above normal summer-time rains. An area of D0 expanded from Monroe and Collier counties across areas close to the Everglades and Lake Okeechobee to portions of the East Coast. The water level of Lake Okeechobee around this time was just above 12 feet. Torrential rains from Tropical Storm Isaac brought much needed, and in some cases too much, rainfall to portions of south Florida. The rains wiped out what remaining dryness had been in the state, and as of the August 28th release of the Drought Monitor, the state was drought-free for the first time since May 2010. The September 4th water level reported at Lake Okeechobee had risen to 14.24 feet, which is still below normal for this time of year.
Figure 2: Drought conditions in Florida as of August 28, 2012 (courtesy of U.S. Drought Monitor).
Appendix 1: Additional August departures from normal data for Florida locations.
Appendix 2: Select daily maximum and minimum temperature records (° F) tied or broken during August (compiled from NOAA, NWS).
Appendix 3: June - August precipitation departures from normal data for Florida locations
Prepared by Melissa Griffin and David F. Zierden
Special thanks to R. Worsnop
Florida Climate Center
The Florida State University
Tallahassee, FL
Average temperatures varied across the state in July. Average temperatures were below normal to slightly above normal for June across the entire state (Table 1 and Appendix 1). Departures from normal ranged from -2.1˚F at Key West to 1.1˚F in Jacksonville. July 2012 was the 13th coldest on record in Key West, while the month proved to have the 4th warmest average minimum temperature (76.1˚F, 1.5˚F above normal) at Pensacola. Only 4 record highs were broken in July, though the month saw numerous records tied or broken (Appendix 2), with the majority of those being from low maximum or high minimum temperatures.
Table 1: Julu average temperatures and departures from normal (° F) for selected cities.
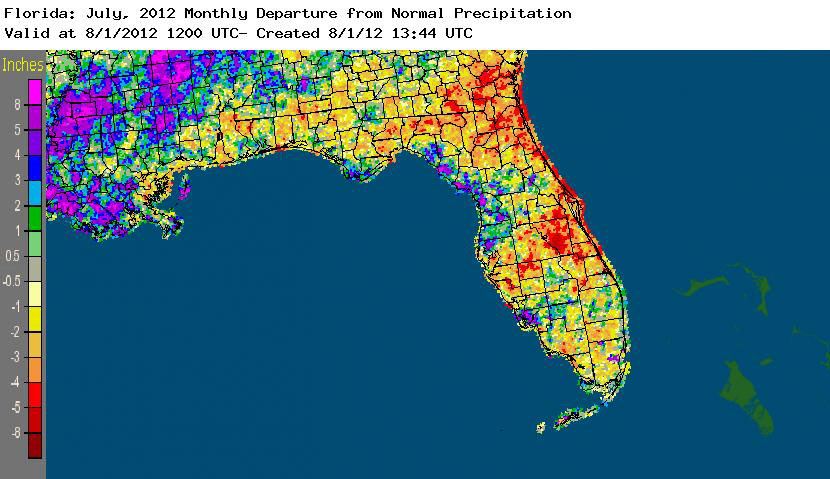
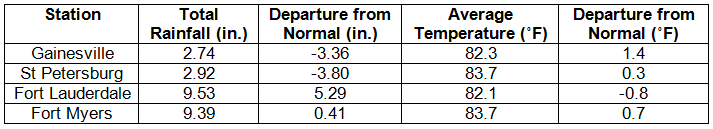
Rainfall totals varied across the state in July. Rainfall totals in the state varied in July (Table 2). Portions of the Nature Coast saw above normal precipitation, while areas along the First and Space Coasts had below normal rainfall totals. Summertime sea-breeze convection was hit and miss across the state, with some small pockets of above normal rainfall directly next to areas of below normal rainfall. July 2012 was the 6th wettest on record in Fort Lauderdale (Appendix 1) and Key West, while it was the 3rd driest July on record in Gainesville (Appendix 1) and 5th driest in Orlando. Areal patterns of monthly rainfall relative to normal are depicted in Figure 1.
Table 2: July precipitation totals and departures from normal (inches) for selected cities.
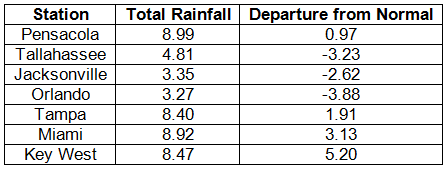
Table 3: Select daily rainfall records (inches) broken during July (compiled from NOAA, NWS).
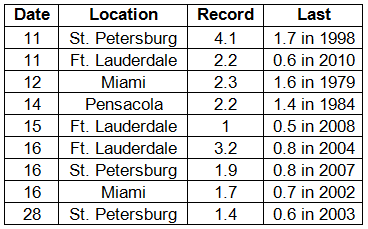
Figure 1: A graphical depiction of the monthly rainfall departure from normal (inches) for July is given in the figure below (courtesy of NOAA, NWS).
ENSO-neutral conditions continue in the Pacific. Neutral ENSO conditions continue to be reported for the equatorial Pacific. Equatorial sea surface temperatures (SST) are greater than 0.5˚C above average across the eastern Pacific Ocean. The chances have increased for El Niño to begin in July-September of 2012 and continue through the winter of 2012-2013. The Climate Prediction Center (CPC) continues to predict warmer than normal temperatures for the state and is predicting above normal precipitation in the western Panhandle through October.
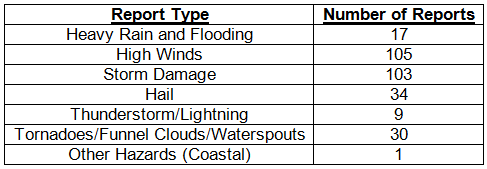
Hazardous weather events in July. July was not as active for severe weather when compared with June. In total, there were 299 storm reports made last month.
Table 4: Breakdown of storm reports submitted in Florida during the month of July. (Compiled from Southeast Regional Climate Center.)
Agricultural and other climate-related impacts. At the beginning of July, fields and agricultural interests across parts of the state were trying to recover from the heavy rainfall from Tropical Storm Debby. Major flooding was reported in fields in Baker and Marion Counties, and in Suwannee County about 30% of the peanut fields were underwater. Muddy fields prevented harvesting of corn for silage. Despite all the rain from Debby, which drastically improved drought conditions in the major citrus areas, certain parts of the state experienced little rain or problems, including Gadsden County, which reported good cotton conditions. Assessments of the fields by mid-month shows that irrigated and non-irrigated crops were in good conditions. Avocadoes were marketed and okra was being harvested in Dade County. Pasture conditions were good due to the temperatures, but there had been some heat-strained cattle reported in the Panhandle. Flood-waters from Debby started to subside through the middle of the month, though some low-lying fields still had standing water. Heavy summer rains had flooded some fields in Lee County. Insect and fungal pressures were higher than normal due to the rain. Cotton and peanut fields needed rain in the western Panhandle. By the end of the month, soil moisture levels were all within adequate ranges. Growers were preparing the fields for the fall vegetable planting season, and citrus grove activity mainly focused on fertilizer application, summer oil spraying, young tree care and regular maintenance to prepare for the upcoming citrus season.
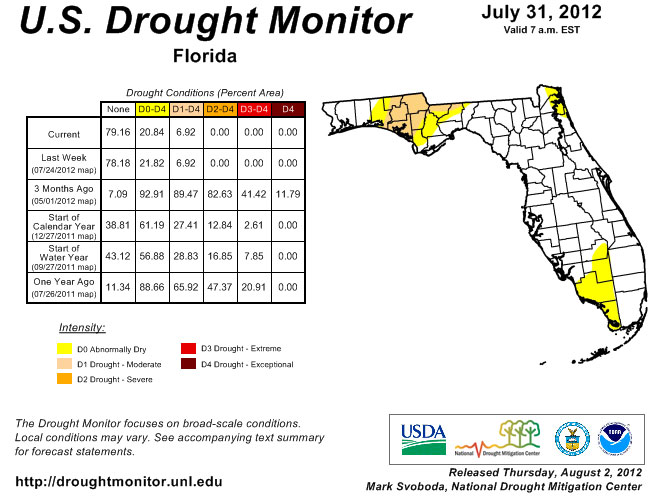
There were some changes in drought conditions across the state in July. At the beginning of the month, abnormally dry (D0) conditions were reported in portions of the Panhandle and Southwest Florida. The summer rains have kept drought conditions in check for the majority of the state, but there has been some expansion of the D0 conditions and even some reintroduction of D0 and moderate (D1) drought conditions. D0 expanded in the southwest to now include Dade, Broward, Monroe, and Palm Beach counties and was introduced in coastal portions of Brevard, Duval, Martin and Nassau counties. Portions of the Panhandle saw an increase in drought conditions toward the end of the month, going to D1 in 6 counties that had previously only been classified as abnormally dry.
Figure 2: Drought conditions in Florida as of July 31, 2012 (courtesy of U.S. Drought Monitor).
Appendix 1: Additional July departures from normal data for Florida locations.
Appendix 2: Select daily maximum and minimum temperature records (° F) tied or broken during July (compiled from NOAA, NWS).
Prepared by Melissa Griffin and David F. Zierden
Special thanks to R. Worsnop
Florida Climate Center
The Florida State University
Tallahassee, FL
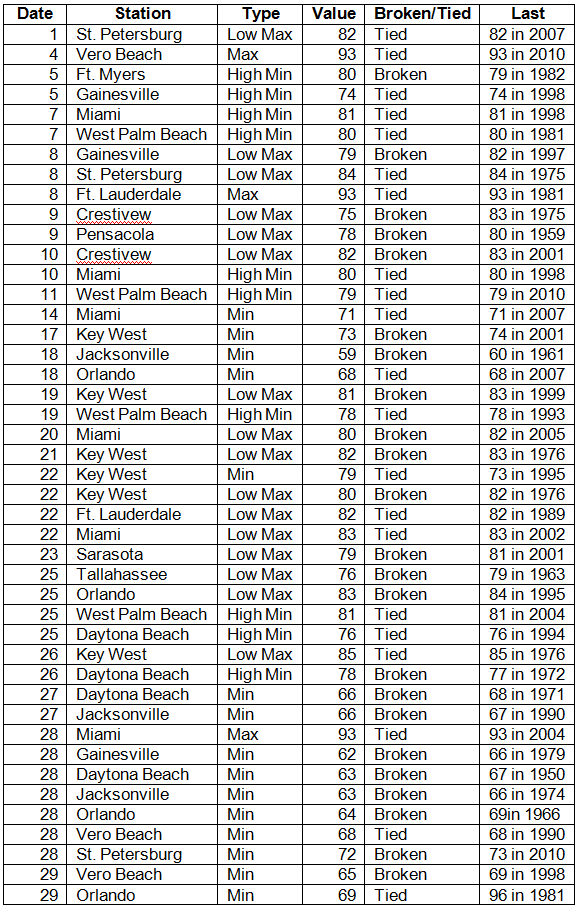
Average temperatures varied across the state in June. Average temperatures were below normal to slightly above normal for June across the entire state (Table 1 and Appendix 1). Departures from normal ranged from -1.6˚F at Key West to 0.2˚F at Miami. June 2012 was rather cool for Florida, especially toward the end of the month, when record heat affected most of the nation. Sea breeze rainfall, along with Tropical Storm Debby, helped keep temperatures from reaching record highs (only 3 record highs were broken in June). The month saw numerous records tied or broken (Appendix 2), with the majority of those being from low maximum or minimum temperatures.
Table 1: June average temperatures and departures from normal (° F) for selected cities.
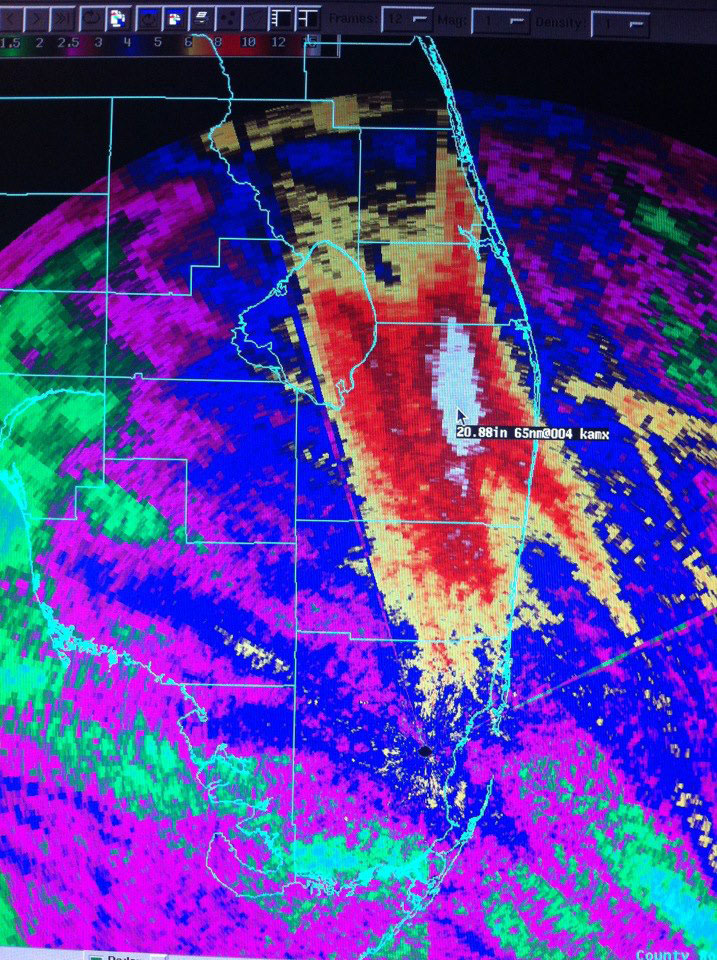
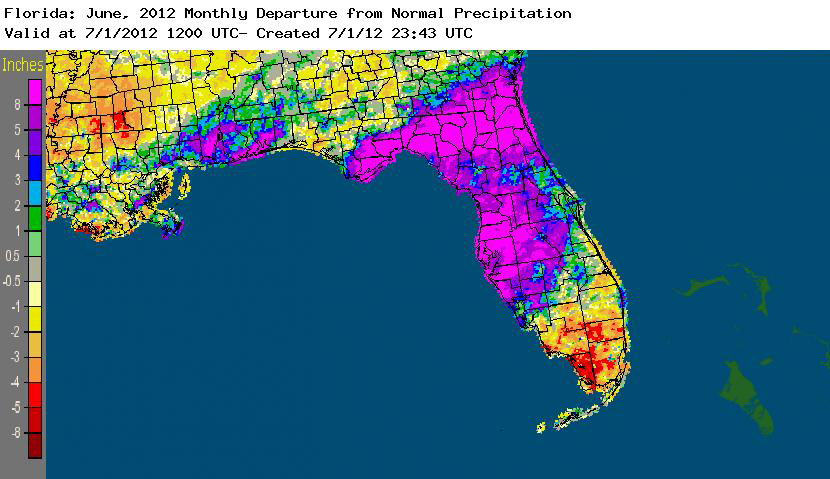
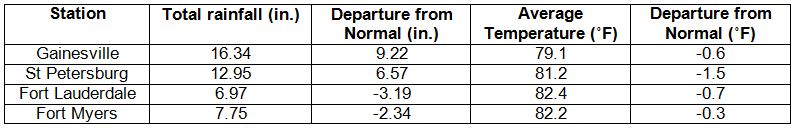
Rainfall totals were well above normal for the majority of the state in June. Rainfall totals at most locations in the state were well above normal in May (Table 2). Portions of the Big Bend, North and Central Florida, and along the west coast recorded rainfall totals that were in excess of 8.00” above normal, while parts of South Florida and the Panhandle saw below normal rainfall. June 2012 was the wettest on record in Tampa (the previous record June rainfall was 18.52” in 1945), the 2nd wettest at Pensacola, 3rd wettest at Jacksonville, and 7th at Tallahassee. Rainfall was also above normal at Fort Lauderdale and Gainesville (Appendix 1). On the 9th, Pensacola reported a record rain event of 13.31” in a 24-hour period (Table 3). Parts of southern Escambia and Santa Rosa counties experienced extensive flooding on the 9th (see Hazardous Weather section for storm pictures). A CoCoRaHS observer along Perdido Key reported a 24-hr rainfall total of 21.70” from the event (Figure 1). From June 23-29th, Tropical Storm Debby impacted the state, dumping an estimated 2.00” to 20.00” (Figure 2). Unofficial reports of over 30.00” were reported in Wakulla County. Areas that experienced the heaviest rains saw significant flooding. Some area rivers surpassed their record flood stage heights (see Hazardous Weather section for pictures). Areal patterns of monthly rainfall relative to normal are depicted in Figure 3.
Table 2: June precipitation totals and departures from normal (inches) for selected cities.
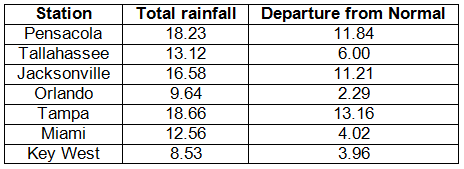
Table 3: Select daily rainfall records (inches) broken during June (compiled from NOAA, NWS).
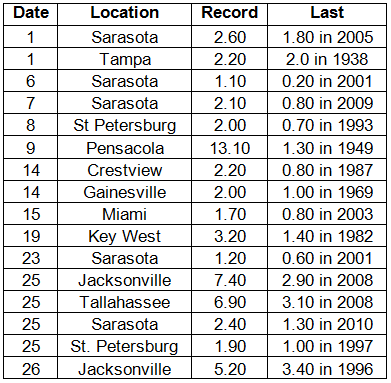
Figure 1: A graphical depiction of radar-estimated rainfall amounts from June 8 to 10 (courtesy of NWS Mobile).
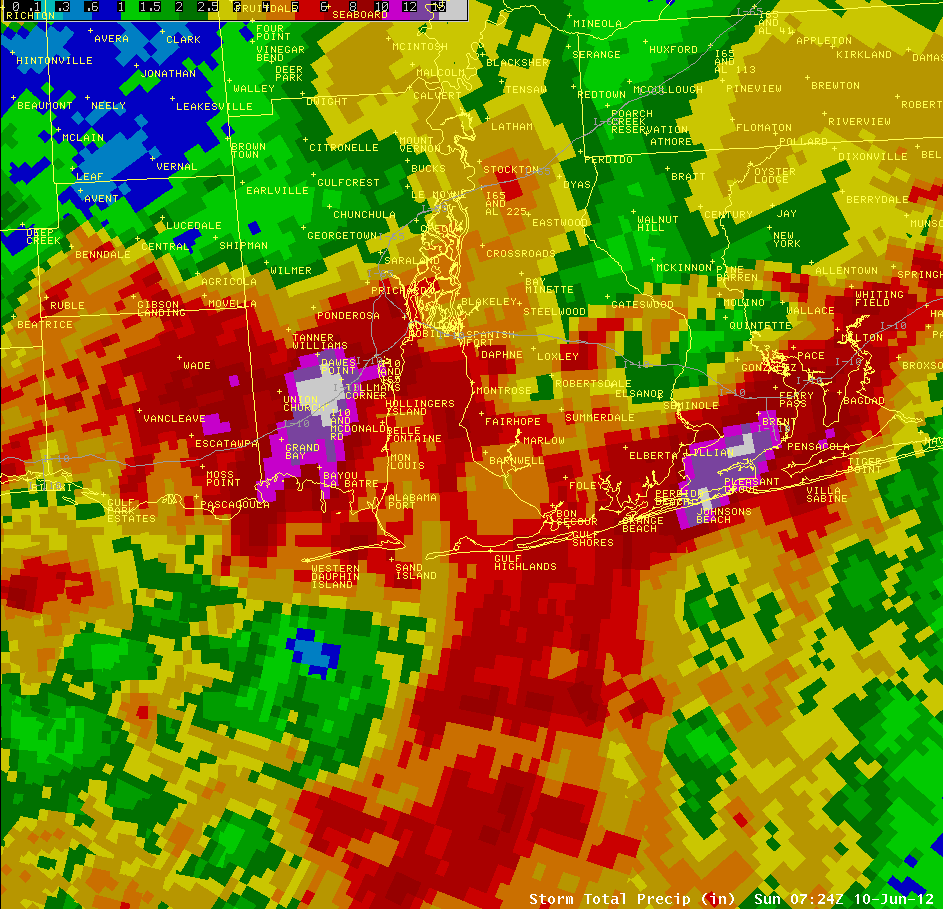
Figure 2: A graphical depiction of radar-estimated rainfall amounts from June 23 to 29, during the time that Tropical Storm Debby passed through the state (courtesy of NOAA, NWS).
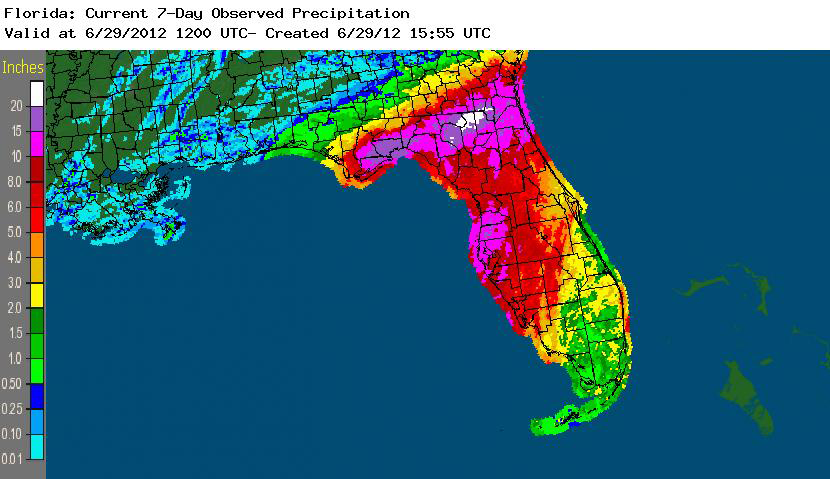
Figure 3: A graphical depiction of the monthly rainfall departure from normal (inches) for June is given in the figure below (courtesy of NOAA, NWS).
ENSO-neutral conditions continue in the Pacific. Neutral ENSO conditions continue to be reported for the equatorial Pacific. Equatorial sea surface temperatures (SST) are near average in the central Pacific but above average in the eastern Pacific Ocean. ENSO-Neutral conditions are expected to continue in the Northern Hemisphere through summer 2012. The Climate Prediction Center (CPC) continues to predict warmer than normal temperatures and is now predicting above normal precipitation through September. There is a 50% chance that the equatorial Pacific will warm enough that an El Niño could set up by the fall or winter of 2012.
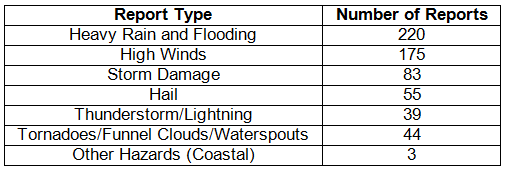
Hazardous weather events in June. June was a very active month for severe weather in Florida. In total, there were 619 storm reports made last month.
Table 4: Breakdown of storm reports submitted in Florida during the month of June. (Compiled from Southeast Regional Climate Center.)
Pensacola Flood - On June 9, tropical moisture streamed northward from the Gulf of Mexico over a small portion of the central Gulf Coast (from Jackson County, Mississippi, to Santa Rosa County, Florida), causing significant rainfall in a short period of time. Radar estimates from the event show two areas of rainfall in excess of 15”: Tillman’s Corner in Baldwin County, Alabama, and Southern Escambia County in Florida (Figure 1). The daily record rainfall for Pensacola was 13.13” in a 24-hour period. It’s the second highest single day rainfall total on record at the station. Pensacola’s only wetter day took place on October 5, 1934, when a tropical storm produced 15.29” of rain. Flooding was reported in numerous areas, while flash floods were reported in some of the hardest hit areas. Many local roads were covered by rising water; retention ponds overflowed; and many home and business, including a prison, were flooded.
 |
 |
|
Rain damage in the Woodridge Subdivision on June 9. (Courtesy L. Taylor) |
Retention pond overflowing onto Gulf Beach Highway. (Courtesy L. Taylor) |
 |
 |
|
Flooded road seen from the Cervantes Street Bridge. (Courtesy S. Grobstig) |
Flood waters seen around Escambia High School. (Courtesy S. Grobstig) |
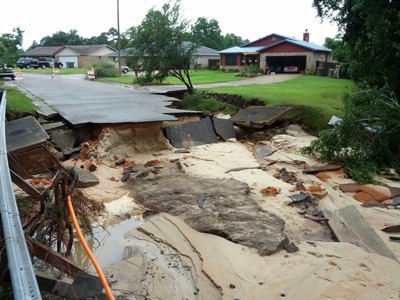
Tropical Storm Debby - On June 24th, a broad area of low pressure that had been persisting in the northwest Caribbean Sea and Gulf of Mexico became better organized and formed into Tropical Storm Debby in the Eastern Gulf. The storm moved slowly northeast, becoming nearly stationary south of Apalachicola on June 25. While Debby never strengthened significantly, the slow-moving storm brought a wide coverage of heavy rainfall to Central and North Florida on the 24th and 25th. The heaviest rains on June 25 occurred along the coastal areas of the eastern Panhandle, where portions of Franklin and Jefferson Counties and nearly all of Wakulla County received from 10 to over 15 inches of rainfall. Another strip of 10 to 15 inches fell later that evening over portions of Baker, Columbia, Suwannee, and Hamilton Counties. Debby finally made landfall on the morning of June 26 near Cedar Key, Florida, before traversing the state and moving off into the Atlantic Ocean. The rains from Tropical Storm Debby were a double-edged sword, bringing relief from over two years of drought to a majority of the state but also causing flooding where the heaviest rain fell. In Wakulla County, the Sopchoppy River had record flooding which damaged or destroyed many homes along the river bank. Many other parts of the county were also flooded due to the heavy nature of the rainfall and very little topography or drainage on the flat coastal plain. Flooding also occurred on the Suwannee and Santa Fe Rivers, and there was record flooding on the St. Mary's River in northeast Florida. Homes and businesses were damaged from standing water in Live Oak and the surrounding area. A storm surge up to 6 feet caused moderate damage to coastal communities, including East Point, St. George Island, St. Marks, and Cedar Key.
 |
|
|
Aerial view of Tropical Storm Debby west of Tallahassee on June 25. (Courtesy R. Weihs) |
|
 |
 |
|
View of coastal surge along US 98 on June 24. (Courtesy H. Holbach) |
View of coastal surge from a bridge on US 98 in Apalachicola on June 24. (Courtesy H. Holbach) |
 |
 |
|
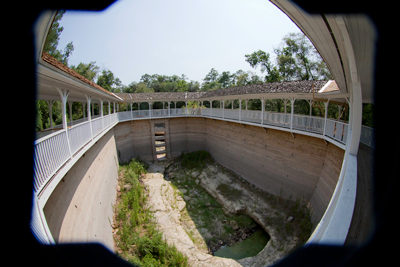
Picture of White Springs and springhouse in early 2012. The spring dried up in the 1990s. (Courtesy J. Moran) |
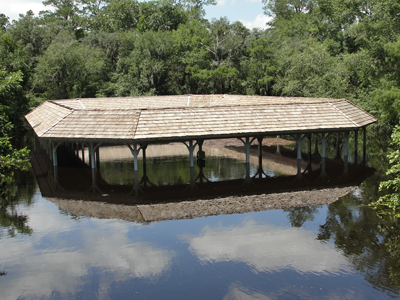
Picture of White Springs springhouse on June 27 with the Suwannee River at flood stage. (Courtesy C. Barnett) |
Agricultural and other climate-related impacts. At the beginning of the month, soil conditions were dry in most of the state, though some portions reported wet fields that delayed the harvest of some vegetables. Improvements of the drought conditions were seen over some of the citrus regions. Pastures still had not recovered from the ongoing drought, and some livestock managers were rotating their stock to prevent from overgrazing in fields. As the month progressed, rains in Escambia and Santa Rosa counties improved peanut and corn conditions. Rain across the state brought improvements to pastures and cattle conditions. By the 20th, early season planted corn showed signs of damage due to the dry weather, and cotton was being replanted in dry fields. Pastures benefited from the warm weather, and forage growth was seen due to the recent rains. Water levels in ponds were still low despite the rains. Prior to rains from Tropical Storm Debby, irrigated and non-irrigated fields were in good conditions across Florida.
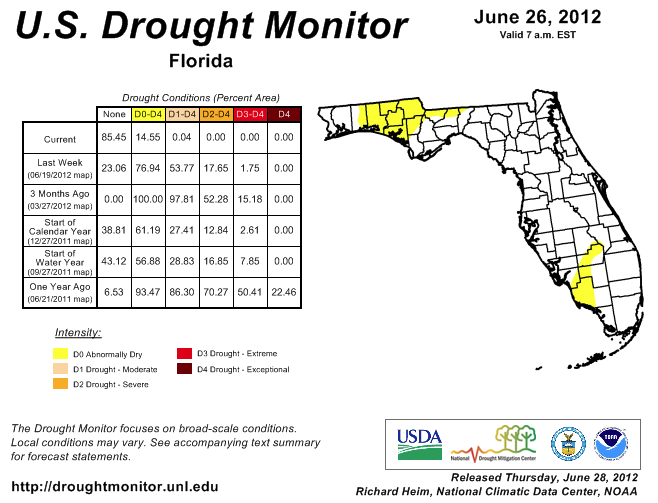
Drought conditions dramatically improved during the month of June. There were multiple rain events that impacted the state throughout the month that lead to an almost complete reduction of all drought classifications in Florida. Since May 29, the state has gone from 85% of the state categorized as in some type of drought to only 15%. The beginning of June saw improvement of the drought along Florida’s west coast. During the weekend of June 8-10, torrential rains in Escambia, Santa Rosa and portions of Okaloosa Counties alleviated the drought conditions. Other portions of the western Panhandle and Big Bend region saw a 1- to 2-category improvement in their drought designations. Sea breeze thunderstorms during the middle of the month helped ease the drought along portions of the east coast. However, it was Tropical Storm Debby that proved to be a drought buster for most of the state. Radar estimates and rain gauge data indicate that parts of north Florida had as much as 20” of rain from the slow moving tropical system. Numerous streams and rivers in the state are reported at or above flood stage. The only part of the state that did not see beneficial rainfall from Debby were the counties west of the Apalachicola River. Abnormally dry conditions are still being reported in Collier, Glades and Hendry Counties in South Florida and in Walton, Holmes, Washington, Bay, Jackson, and Calhoun Counties, along with northern portions of Gadsden, Leon and Jefferson Counties.
Figure 4: Drought conditions in Florida as of June 26, 2012 (courtesy of U.S. Drought Monitor).
Appendix 1: Additional June departures from normal data for Florida locations.
Appendix 2: Select daily maximum and minimum temperature records (° F) tied or broken during June (compiled from NOAA, NWS).
Prepared by Preston Leftwich, David F. Zierden, and Melissa Griffin
Florida Climate Center
The Florida State University
Tallahassee, FL
Average temperatures near normal for April. Monthly average temperatures in April were near normal across the entire state (Table 1). A daily maximum temperature of 86° F at Panama City on the 14th tied a record last observed in 2003.
Table 1: April average temperatures and departures from normal (°F) for selected cities.
| Station | Average Temperature | Departure from Normal |
| Pensacola | 67.2 | 0.3 |
| Tallahassee | 67.7 | 1.2 |
| Jacksonville | 67.1 | 0.5 |
| Orlando | 71.1 | -0.4 |
| Tampa | 72.8 | 1.2 |
| Miami | 76.3 | 0.6 |
| Key West | 75.9 | -1.1 |
April rainfall above normal in central and southern areas and below normal in northern area. Rainfall totals for April well above normal at most central and southern stations, while totals were below normal across northern Florida and at Key West (Table 2). Several daily rainfall records were broken during the month (Table 3). Of note, the daily rainfall (2.15 in) at Miami on the 12th broke a record in existence since 1900.
Table 2: April precipitation totals and departures from normal (inches) for selected cities.
| Station | Total Rainfall | Departure from Normal |
| Pensacola | 2.73 | -1.16 |
| Tallahassee | 3.58 | -0.01 |
| Jacksonville | 1.01 | -2.13 |
| Orlando | 4.73 | 2.31 |
| Tampa | 3.47 | 1.67 |
| Miami | 8.95 | 5.59 |
| Key West | 0.62 | -1.44 |
Table 3: Daily rainfall records (inches) set during April (compiled from NWS).
| Date | Station | Amount | Previous Record |
| 11 | Naples | 1.52 | 0.91 in 1956 |
| 12 | Miami | 2.15 | 2.00 in 1996 |
| 18 | Naples | 0.81 | 0.79 in 1996 |
| 18 | Vero Beach | 1.52 | 1.33 in 1959 |
| 25 | Orlando | 1.80 | 1.79 in 1953 |
| 26 | Melbourne | 1.54 | 1.40 in 1958 |
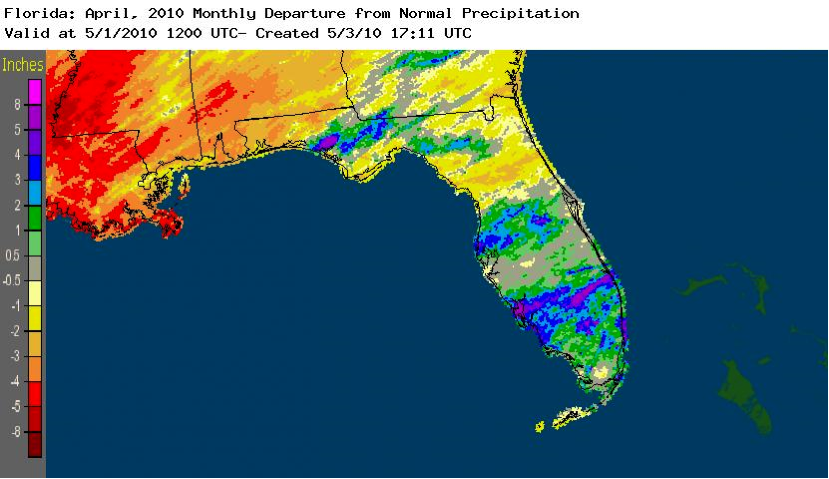
Figure 1. A graphical depiction of the monthly rainfall departure from normal (inches) for April is given in the figure below (courtesy of NOAA, NWS). Bands of well-above normal monthly rainfall are indicated in northern, central, and south-central parts of the state.
El Niño continues to impact Florida. Sea surface temperatures in the equatorial Pacific Ocean remained just above 0.5° C above normal, designating weak El Niño conditions. Heavy rain during late winter and early spring, associated with El Niño conditions, has eased a four-year long water deficit in southwestern Florida.
Hazardous weather. The 25th was an active severe weather day as a prefrontal squall line moved across northeastern and north-central parts of the state. There were numerous observations of one-inch diameter hail. Hail the size of golf balls (1.75 inches) was reported near Silver Springs. High winds caused structural damage and downed power lines and trees. As this squall line moved off the southeastern coast on the 26th, winds up to 60 mph were observed from south of Miami to near Key Largo. Along the southeastern coast, a wind gust of 77 mph was observed at Fowey Rocks. On the 30th thunderstorm winds downed power lines and trees near Ft. White, blew the roof off a barn near Ichetucknee Springs, and blew a tree onto a house near Gainesville.
Agricultural and other impacts. On April 15, 11 counties in northwest Florida were designated as primary natural disaster areas due to crop losses caused by excessive rain in November and December 2009. Warmer and drier weather during April aided forage growth and allowed peanut, corn, and tobacco planting to begin in northern areas. However, abnormally dry conditions that developed in extreme northwestern Florida by late in the month started to stress pasture and newly-planted crops. Heavy rains in southern areas continued to ease long-term water deficits.
Building A, Suite 292
Tallahassee, FL 32306-2741
Phone: (850) 644-3417 | (850) 644-0719
climate@coaps.fsu.edu