


The Florida Climate Center serves as the primary resource for climate data, information, and services in the state of Florida.

The Florida Climate Center achieves its mission by providing climate monitoring, research, and expertise to be applied by the people, institutions, and businesses of Florida and the surrounding region.
We provide direct service by fulfilling requests for climate and weather data and information in a variety of formats.
We perform research that advances the understanding of the climate variability and changes of Florida and the surrounding region.
We provide outreach in presentations and at events aimed at a variety of groups, interests, and ages.
Prepared by Florida Climate Center
The Florida State University
Tallahassee, FL

Key Points:
- With wide temperature swings throughout the month of December, monthly average temperature departures ended up near normal across the state.
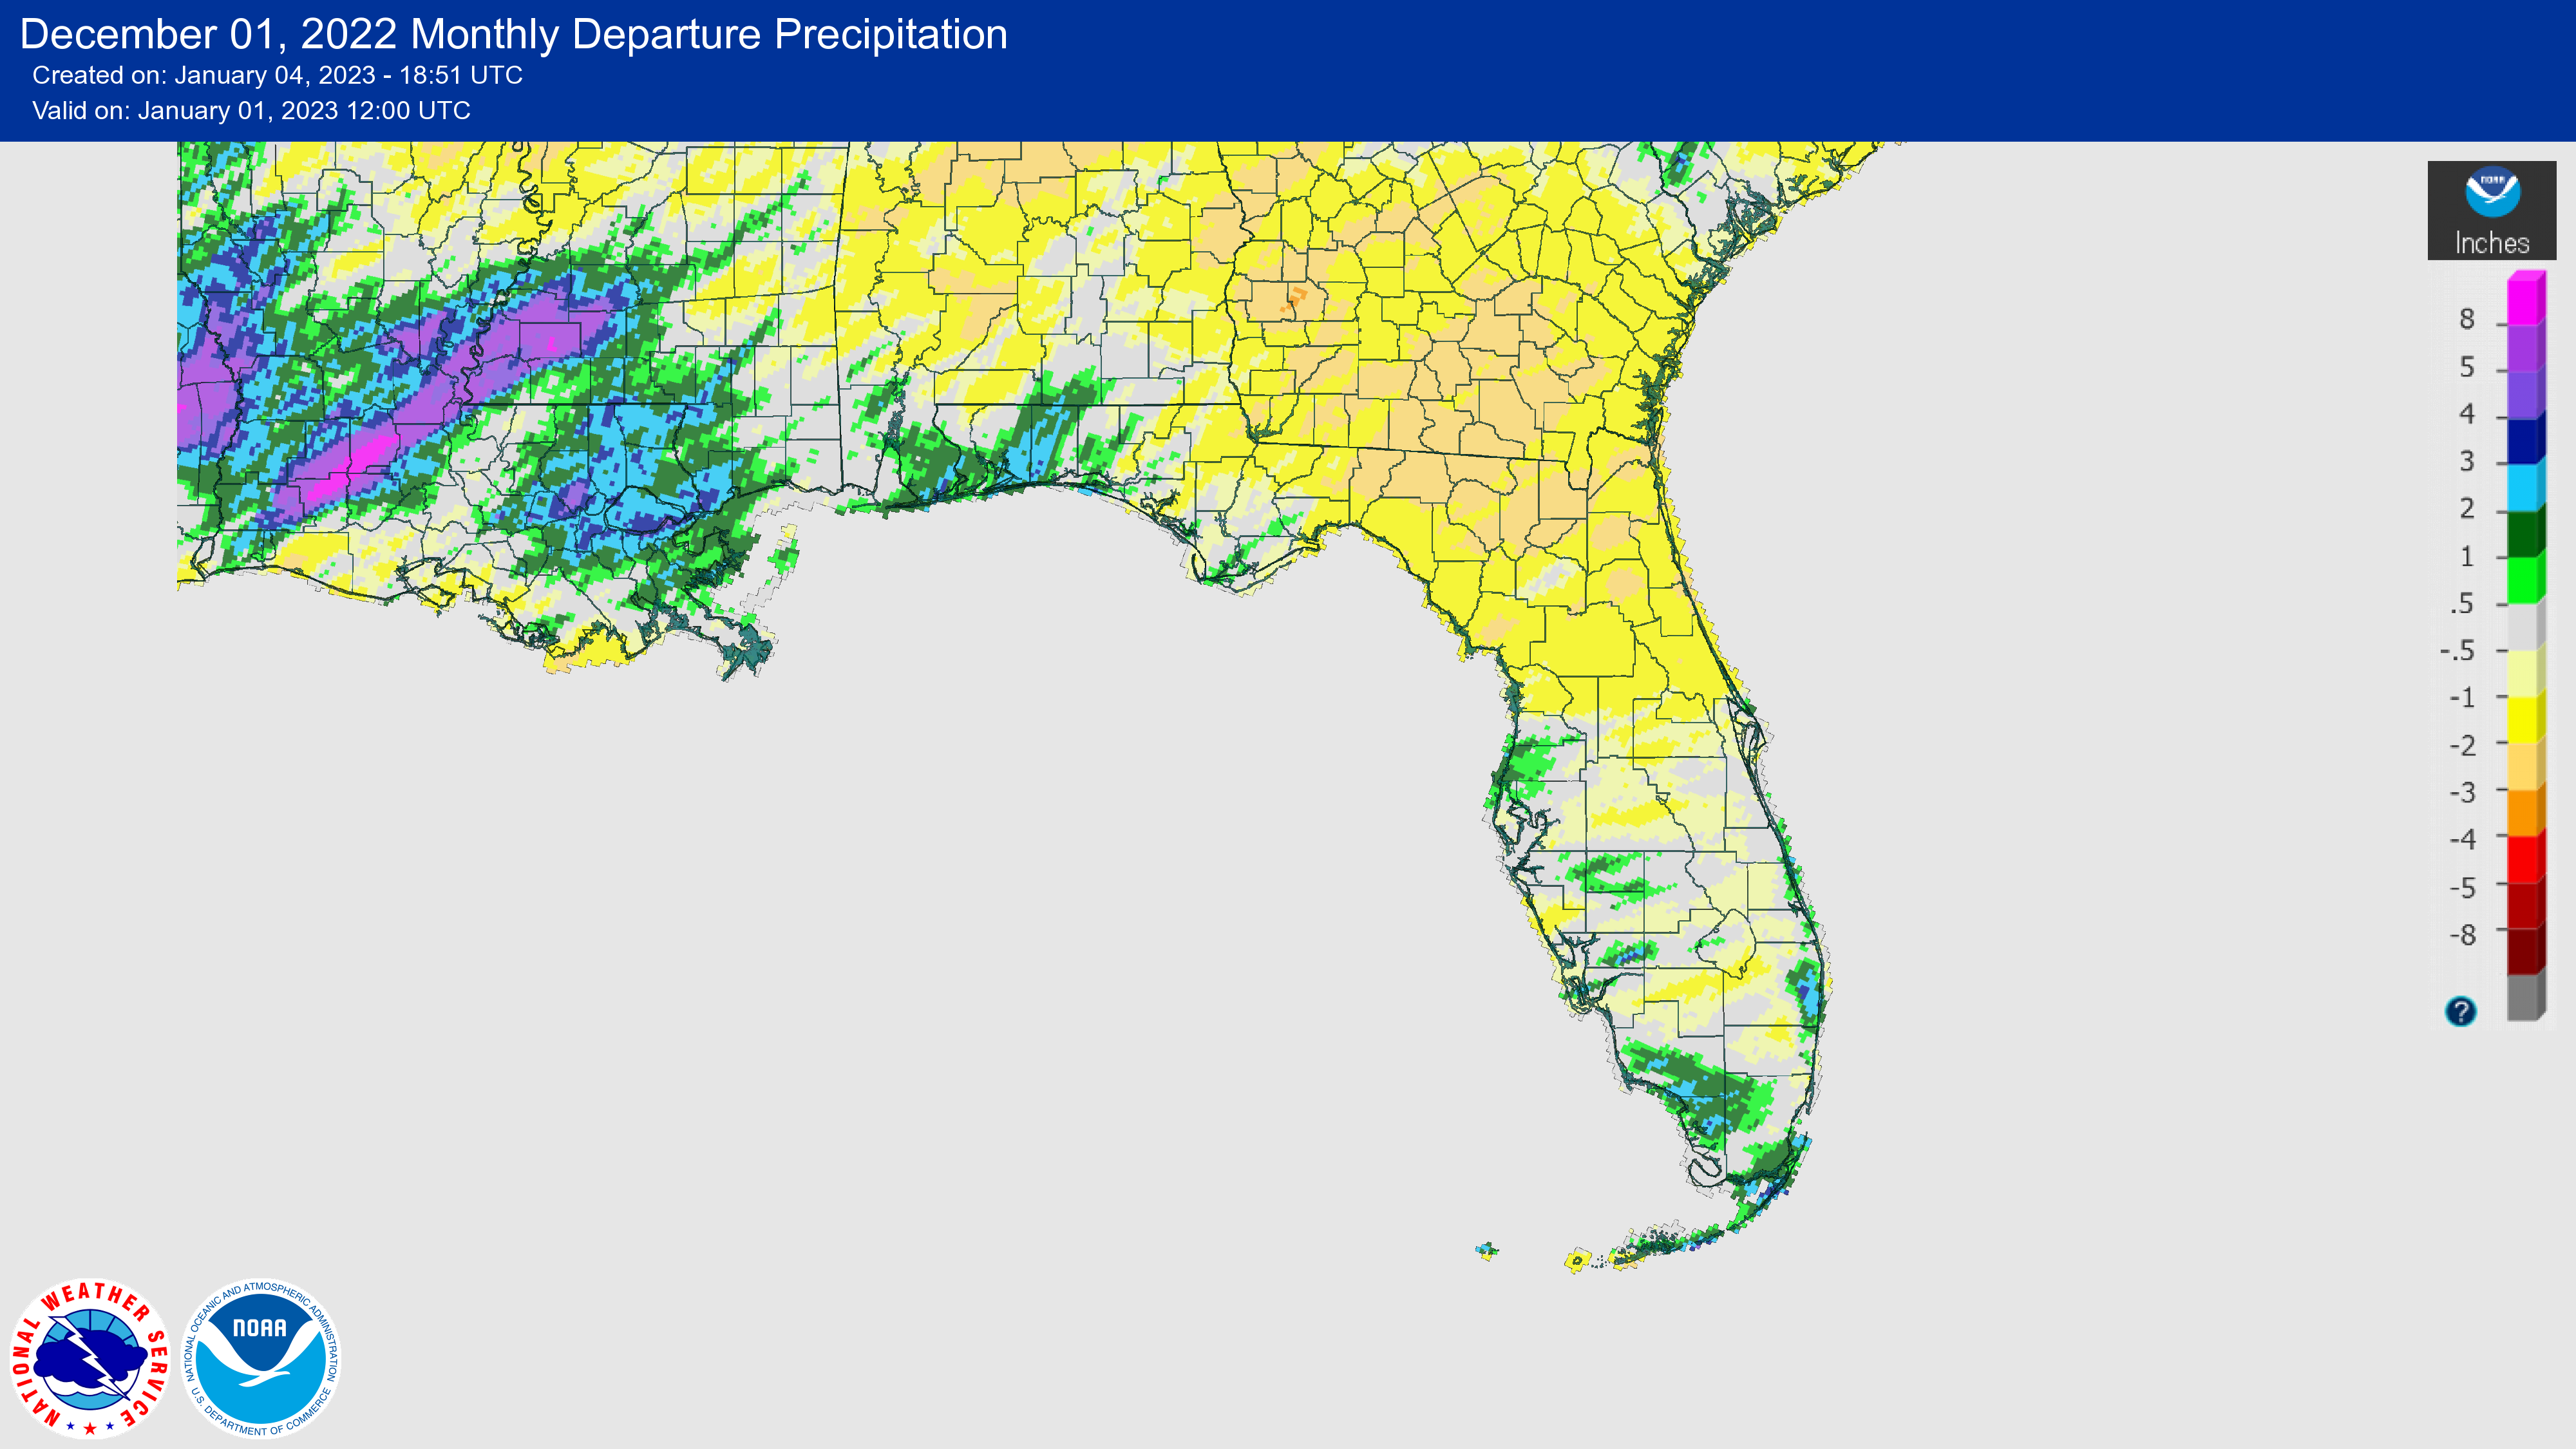
- Monthly precipitation for December was generally below normal, with exceptions in the western Panhandle and southern Peninsula.
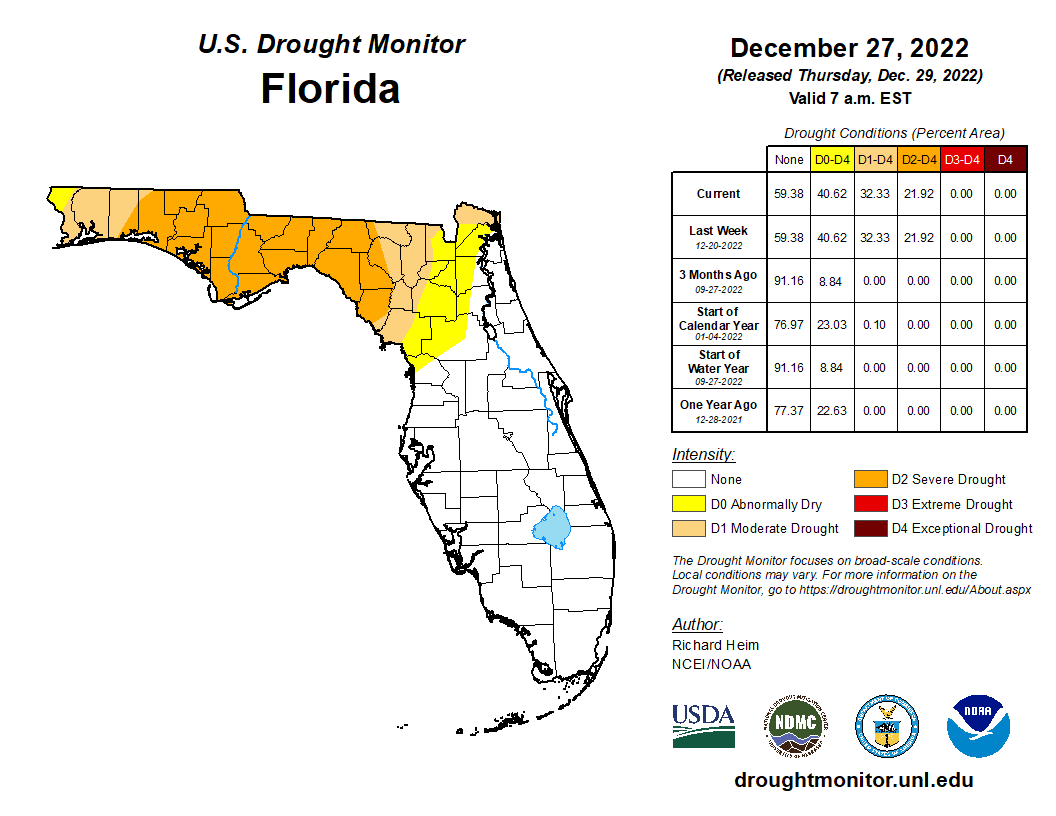
- Drought conditions persisted across the Panhandle throughout the month, and about 32% of the state remains in severe (D2) or moderate (D1) drought as of the end of December.
- We are in the third winter in a row with La Niña conditions in the equatorial Pacific Ocean, though chances for a transition to ENSO-neutral increase to 71% during February-April 2023.
December brought large swings in temperature but, overall, the average monthly temperatures in December were near to above normal across the state. Average temperature departures from normal ranged from -1.3 ̊F in Melbourne to +2.7 ̊F in Pensacola for the month (see Table 1 and Appendix 1 for select cities). The month started out warmer than normal, with record warm temperatures across the Panhandle during the first half of the month. A shift in the weather pattern brought a return to more seasonal temperatures mid-month, while the last week of December was much colder than normal. Many locations experienced frigid temperatures on the order of 20 ̊F or more below normal during the last week of December, including over Christmas. Many places in the Panhandle saw minimum temperatures in the teens, with wind chills in the single digits, including Tallahassee, which reached a low of 19 ̊ F and 18 ̊ F on the 25th and 26th, respectively; Crestview recorded a low of 18 ̊ F on the 24th; and Niceville got down to 17 ̊ F on the 24th and 25th. Select daily high maximum and low minimum temperature records tied or broken during the month are provided in Appendices 2 and 3, respectively.
Table 1. December average temperatures and departures from normal ( ̊F) for selected cities.
| Station | Mean Temperature | Departure from Normal |
| Pensacola | 58.2 | +2.7 |
| Tallahassee | 55.9 | +1.5 |
| Jacksonville | 56.3 | -0.4 |
| Orlando | 64.2 | +0.9 |
| Tampa | 64.7 | -0.2 |
| Miami | 72.3 | +1.1 |
| Key West | 73.5 | +0.5 |
Monthly rainfall totals in December were below to near normal for much of the state. The monthly precipitation departures from normal ranged from -2.53 inches in Jacksonville to +2.02 inches in Key West (see Table 2 and Appendix 1 for additional locations). Over the past three months, below normal rainfall has led to precipitation deficits across the Panhandle and north Florida and the expansion of drought.
Table 2. December precipitation totals and departures from normal (inches) for selected cities.
| Station | Total Rainfall | Departure from Normal |
| Pensacola | 5.61 | +0.21 |
| Tallahassee | 2.09 | -2.15 |
| Jacksonville | 0.25 | -2.53 |
| Orlando | 0.95 | -1.53 |
| Tampa | 2.35 | -0.21 |
| Miami | 1.73 | -0.71 |
| Key West | 4.18 | +2.02 |
Figure 1. A graphical depiction of the monthly rainfall departure from normal (inches) for December (courtesy of NOAA, NWS).
La Niña Advisory.
La Niña is expected to continue into the winter, but there are equal chances of La Niña and ENSO-neutral conditions during January-March 2023. In February-April 2023, the chance for ENSO-neutral conditions increases to 71%, reflecting higher confidence that ENSO-neutral will emerge during Spring 2023. Below-average sea surface temperatures persisted in the central and eastern Pacific Ocean over the past month, but negative subsurface temperature anomalies weakened in November 2022.
Hazardous Weather Events in December.
According to the Local Storm Reports issued by the local National Weather Service offices serving Florida, there were 111 individual local reports of hazardous weather events recorded across the state during the month of December (see Table 4 for a breakdown by event type). There were several reports of damage from strong wind gusts during the middle and end of the month, along with waterspouts and tornados reported in the central Panhandle area on the 14-15th.
Table 4. Breakdown of storm reports submitted in Florida during the month of December (compiled from Iowa State University/Iowa Environmental Mesonet).
| Report Type | Number of Reports |
| Heavy Rain | 9 |
| Flood | 0 |
| Coastal Flood | 1 |
| Hail | 1 |
| Marine Thunderstorm Wind | 21 |
| Non-Thunderstorm Wind Gust | 32 |
| Non-Thunderstorm Wind Damage | 3 |
| Tornado/Waterspout/Funnel Cloud | 9/5/2 |
| Thunderstorm Wind Damage | 11 |
| Thunderstorm Wind Gust | 13 |
| Rip Currents | 3 |
| Sleet | 1 |
Daily Record Events in December.
Table 5.Summary of daily records broken or set in Florida in December (source: NCEI Daily Weather Records).
| Category | Number of Records |
| Highest daily max. temp. | 20 |
| Highest daily min. temp. | 15 |
| Lowest daily max. temp. | 38 |
| Lowest daily min. temp. | 13 |
| Highest daily precipitation | 5 |
| Total | 91 |
Weather/Climate Highlight of the Month:
It was a very cold but dry Christmas across Florida – nearly every station in the state recorded one of their top 5 coldest Christmases on record, based on daily average temperatures.
Drought-Related Impacts.
By the middle of December, severe drought had expanded across the Panhandle and extended east to parts of Hamilton, Suwannee, and Dixie counties. About 26% of the state was in severe drought (D2) and 6% was in moderate drought (D1), according to the U.S. Drought Monitor. By the end of the month, 22% of the state was in severe drought (D2), 10% was in moderate drought (D1), and 8% was abnormally dry (D0) (Figure 2 below).
As of December 31, the Lake Okeechobee water level was 16.36 ft. above sea level (Feet-NGVD29), which is above average for this time of the year. At the first of the month, the water level was 16.48 ft. above sea level.
Figure 2. A graphical depiction of the current drought conditions in Florida according to the U.S. Drought Monitor (courtesy of the National Drought Mitigation Center, University of Nebraska-Lincoln).
Agriculture-Related Impacts.
During the month of December, Florida pasture conditions were mostly fair to good but the cold spell at the end of the month led to damage to pastures across the state. There were some reports of cattle deaths due to the cold spell. Little precipitation fell during the month, which worsened drought conditions in the northern part of the state. Sugarcane planting and harvest progressed well during the month, and citrus crops not damaged by the hurricanes in the fall were shipped out. Several vegetable crops were planted and harvested. For more information, consult the Crop Progress - State Stories reports, which are produced monthly December through March by the USDA’s National Agricultural Statistics Service.
Appendix 1
Additional December departures from normal data for select Florida locations (Source: NWS).
| Station | Average Temperature (˚F) | Departure from Normal (˚F) | Total Rainfall (in.) | Departure from Normal (in.) |
| Gainesville | 57.7 | +0.4 | 1.64 | -1.24 |
| Sarasota | 65.1 | -0.1 | 2.63 | +0.30 |
| Melbourne | 64.9 | -1.3 | 2.30 | -0.06 |
| Fort Myers | 68.8 | +1.5 | 1.10 | -0.80 |
| West Palm Beach | 70.2 | +1.8 | 3.51 | +0.03 |
Appendix 2
Select daily record high maximum temperatures (°F) broken or tied during December (compiled from NOAA).
| Location | Date | Record | Broken/Tied | Last |
| Fort Lauderdale Beach | 1 | 85 | Tied | 85 in 2020 |
| Key West | 1 | 89 | Broken | 85 in 2019 |
| Key West | 3 | 88 | Broken | 87 in 1994 |
| Key West | 6 | 89 | Broken | 86 in 1994 |
| Marianna | 7 | 82 | Broken | 80 in 2004 |
| Crestview | 7 | 84 | Broken | 83 in 1951 |
| Pensacola | 7 | 81 | Broken | 80 in 1951 |
| Niceville | 8 | 81 | Broken | 79 in 1951 |
| Pensacola | 8 | 81 | Broken | 80 in 1998 |
| Tallahassee | 8 | 82 | Broken | 81 in 2013 |
| Cross City | 10 | 85 | Broken | 82 in 2013 |
| Key West | 11 | 88 | Broken | 87 in 2021 |
| Key West | 30 | 89 | Broken | 86 in 2021 |
| Vero Beach | 31 | 87 | Broken | 85 in 2021 |
Appendix 3
Select daily record low minimum temperatures (°F) broken or tied during December (compiled from NOAA).
| Location | Date | Record | Broken/Tied | Last |
| Marianna | 23 | 21 | Broken | 23 in 2000 |
| Fort Lauderdale | 24 | 45 | Broken | 50 in 2012 |
| Niceville | 24 | 17 | Broken | 20 in 1960 |
| Tarpon Springs | 24 | 24 | Broken | 25 in 1906 |
| Marianna | 24 | 17 | Broken | 29 in 2005 |
| Cross City | 24 | 22 | Broken | 24 in 2010 |
| Orlando | 24 | 30 | Broken | 36 in 1963 |
| Daytona Beach | 25 | 28 | Broken | 31 in 1961 |
| Marianna | 25 | 19 | Broken | 28 in 2020 |
| Cross City | 25 | 19 | Broken | 27 in 2020 |
| Orlando | 25 | 28 | Broken | 31 in 1963 |
| Daytona Beach | 26 | 29 | Tied | 29 in 1963 |
| Wewahitchka | 26 | 17 | Tied | 17 in 1985 |
| Marianna | 26 | 18 | Broken | 25 in 2020 |
| Cross City | 26 | 20 | Broken | 22 in 2020 |
Prepared by Florida Climate Center
The Florida State University
Tallahassee, FL
Key Points:
- Monthly average temperatures in May were near to above normal across the state.
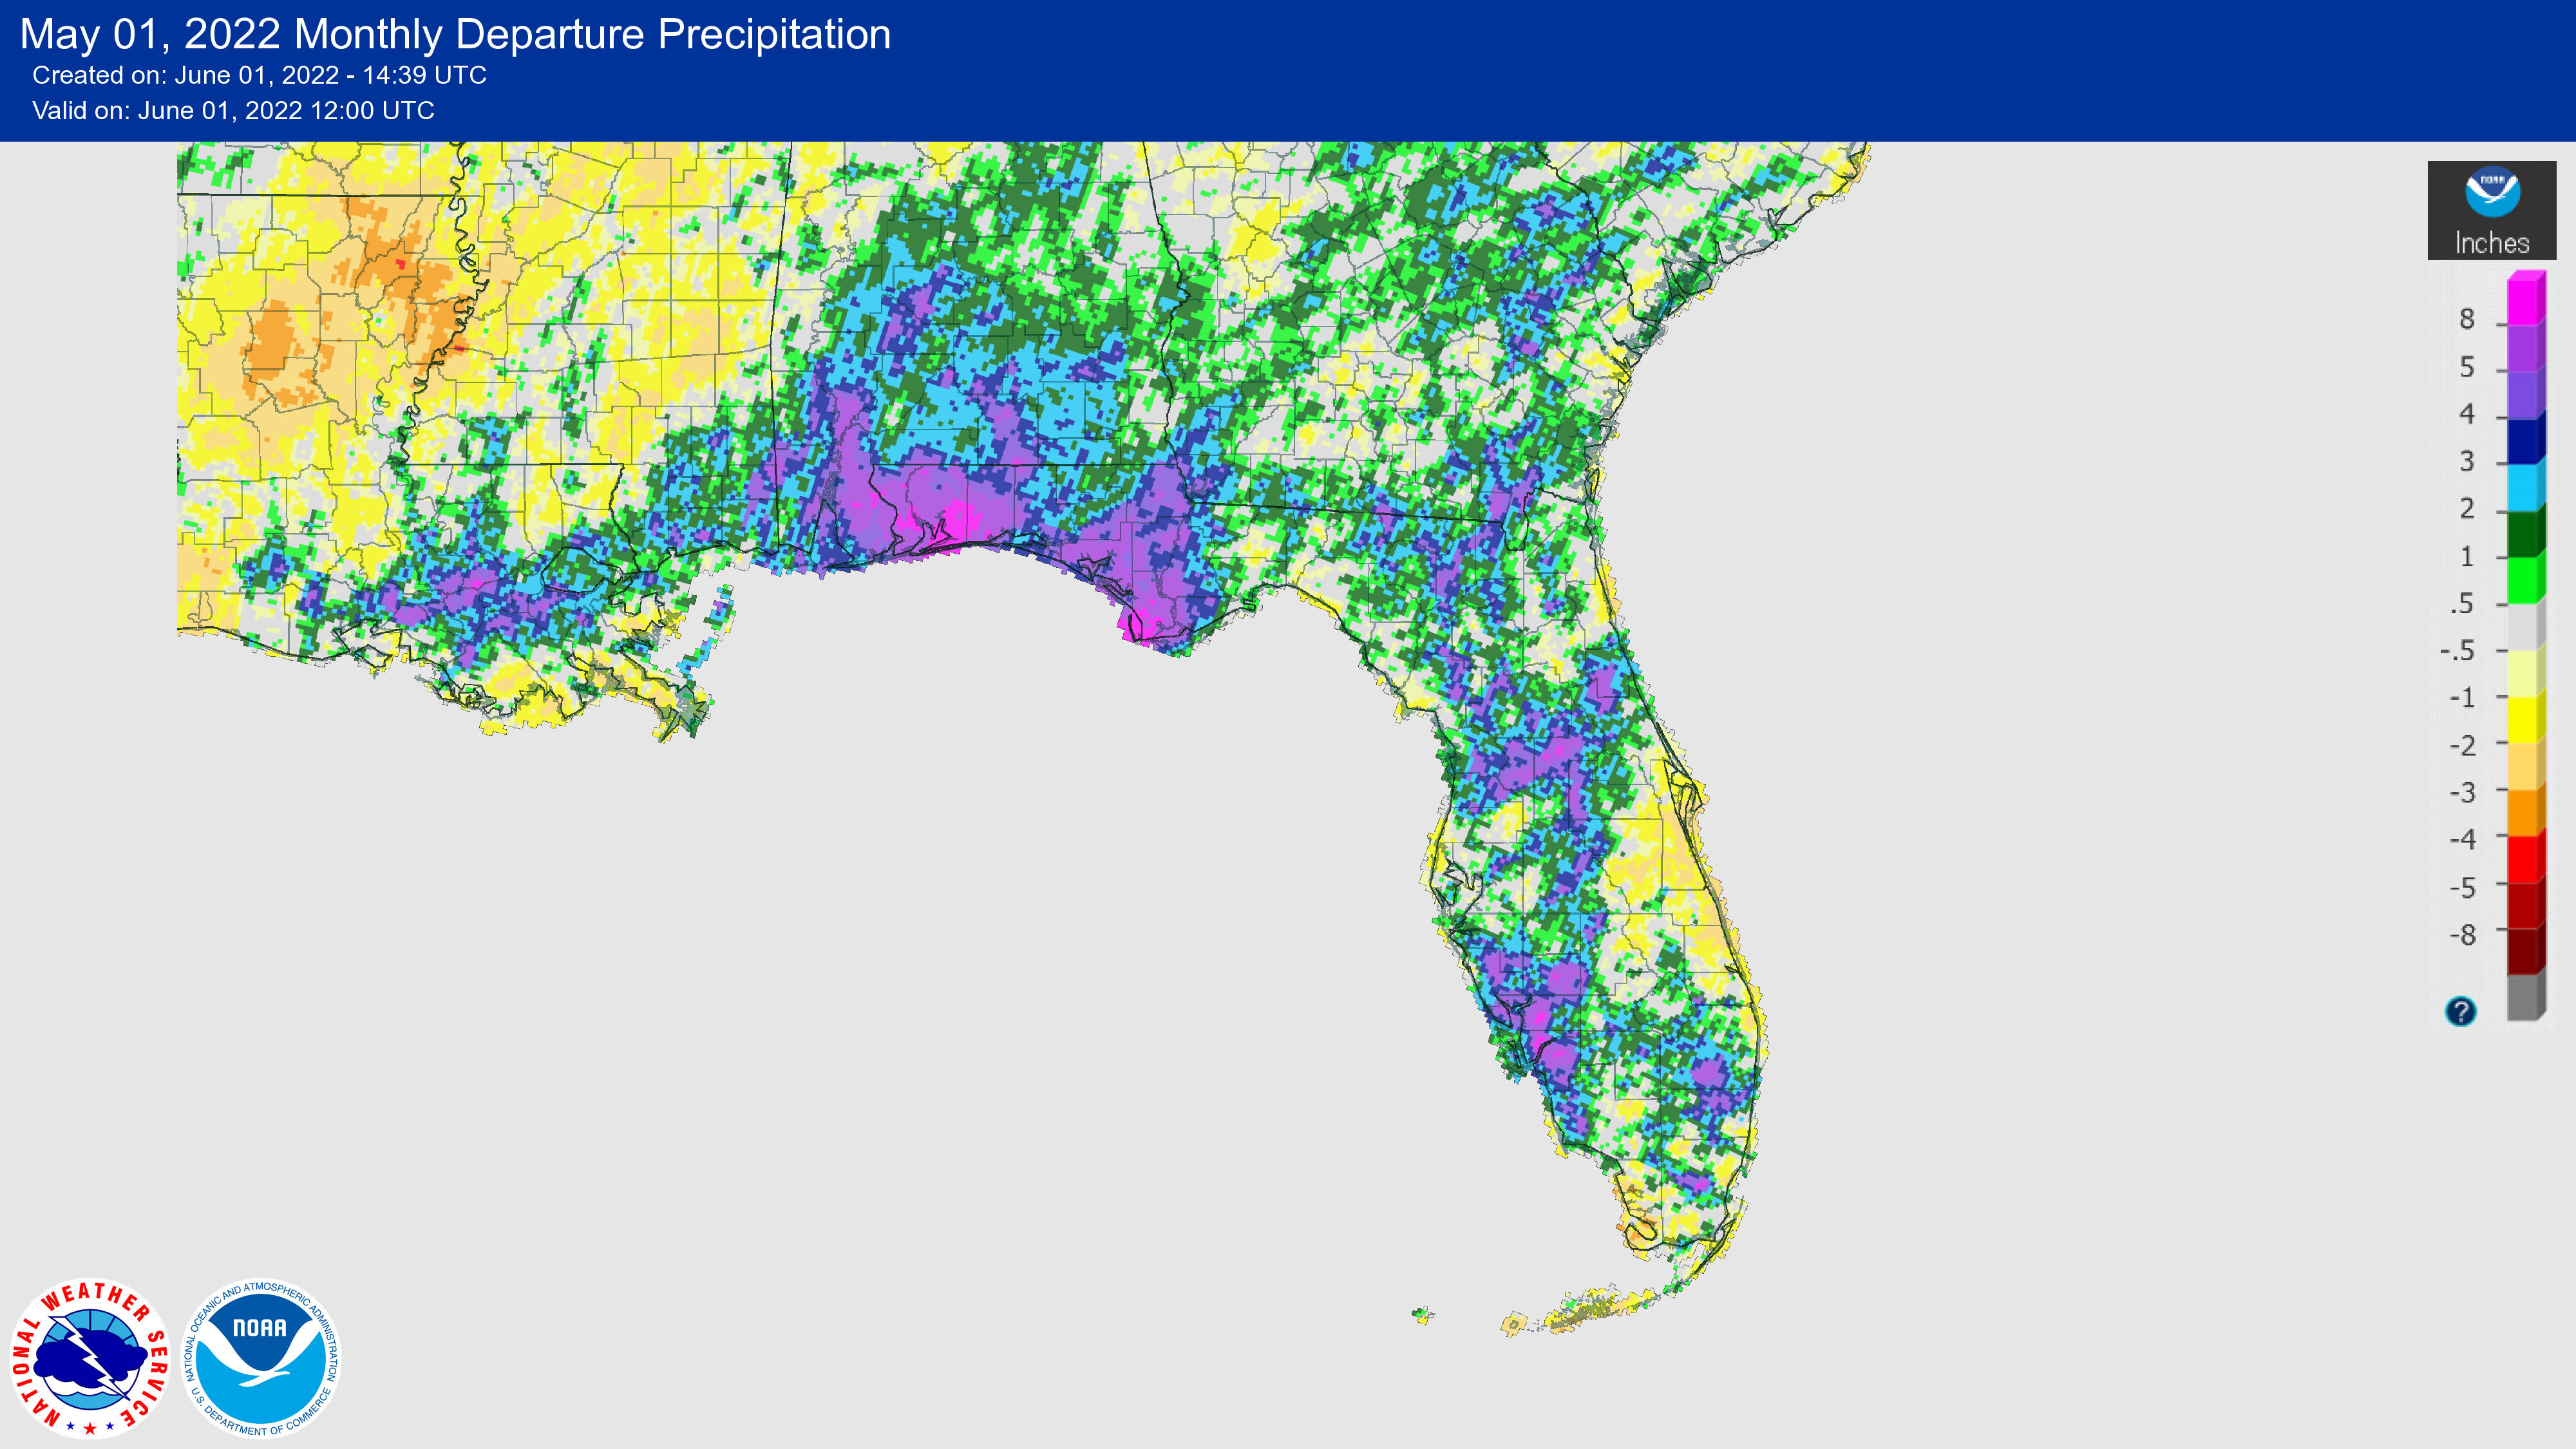
- Rainfall totals for the month were above normal for many areas, particularly in the Panhandle and southwest regions.
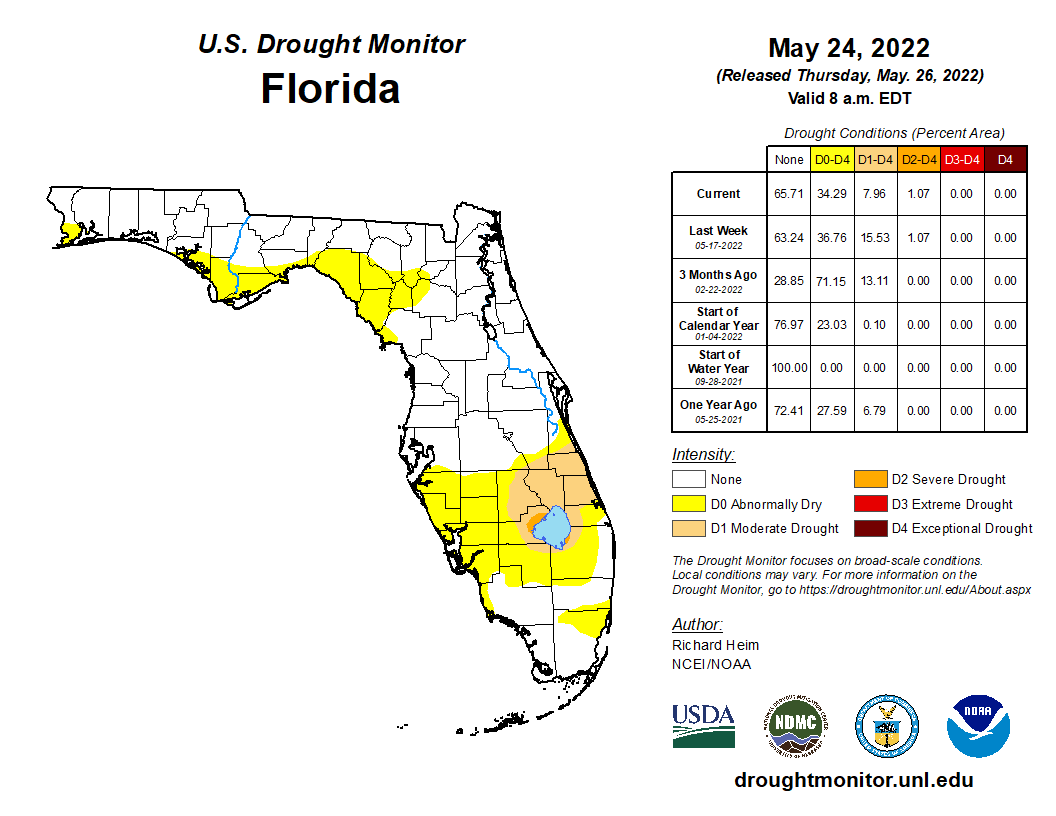
- As of May 24, severe drought (D2) has been removed for most places, while moderate drought (D1) and abnormally dry (D0) conditions continue to impact parts of the state.
- La Niña conditions are favored to continue into the summer and fall, with a 58% chance in August-October 2022. The chances of La Nina occurring this fall and into early winter have increased to 61%.
Average temperatures in May continued to be near to above normal across the state. Average temperature departures from normal ranged from 0.0 ̊F in Key West to +2.5 ̊F in Orlando for the month (see Table 1 and Appendix 1 for select cities). Many stations across Florida recorded one of their top 5 warmest Mays on record, including Tampa (2nd-warmest), Jacksonville Beach (2nd-warmest), Orlando (3rd-warmest), Pensacola (4th-warmest), and Miami (5th-warmest). Several daily high maximum temperature records were tied or broken throughout the month, though more daily high minimum temperature records were set (see appendix 2).
Table 1. May average temperatures and departures from normal ( ̊F) for selected cities.
| Station | Mean Temperature | Departure from Normal |
| Pensacola | 78.2 | +2.2 |
| Tallahassee | 76.5 | +1.3 |
| Jacksonville | 75.5 | +0.6 |
| Orlando | 79.8 | +2.5 |
| Tampa | 81.6 | +2.1 |
| Miami | 81.6 | +1.5 |
| Key West | 81.1 | 0.0 |
Rainfall totals in May were above normal across much of the state, particularly the western Panhandle, as well as parts of the Peninsula. The monthly precipitation departures from normal ranged from -1.87 inches in Orlando to +8.15 inches in Pensacola (Table 2 and Appendix 1). Pensacola recorded its wettest May on record at 12.05 inches (based on a 74-year record from the Pensacola Regional Airport station). The surplus of rainfall across the western Panhandle brought Pensacola out of deficit for the year, with a year-to-date departure from normal of +2.6 inches. However, several locations continue to see rainfall deficits for the year, including Venice at -3.5 inches of rainfall to date and Vero Beach at -7.8 inches to date. Ample rainfall during May helped to alleviate drought in some areas of southwest Florida, though abnormally dry conditions and moderate drought persist in some areas (see below).
Table 2. May precipitation totals and departures from normal (inches) for selected cities.
| Station | Total Rainfall | Departure from Normal |
| Pensacola | 12.05 | +8.15 |
| Tallahassee | 3.29 | -0.07 |
| Jacksonville | 4.88 | +1.46 |
| Orlando | 2.15 | -1.87 |
| Tampa | 2.71 | +0.11 |
| Miami | 4.47 | -1.85 |
| Key West | 1.72 | -1.40 |
Figure 1. A graphical depiction of the monthly rainfall departure from normal (inches) for May (courtesy of NOAA, NWS).
La Niña Advisory.
Chances for La Niña, the cool phase of the ENSO climate pattern, to return this fall and early winter for a third year in a row have increased (61% chance). La Niña is still favored to continue into the late Northern Hemisphere summer (58% chance in August-October 2022). Over the past month, the Niño index values ranged from -1.1°C and -1.5°C, and subsurface temperature anomalies remained negative reflecting a large area of below-average temperatures from the surface down to ~100m depth across the central and eastern equatorial Pacific Ocean. Overall, the coupled ocean-atmosphere system continues to reflect the presence of La Niña.
Hazardous Weather Events in May.
According to the Local Storm Reports issued by the local National Weather Service offices serving Florida, there were 399 individual local reports of hazardous weather events recorded across the state during the month of May (see Table 4 for a breakdown by event type). Severe storms with high wind gusts, hail, and localized heavy rain affected many areas throughout the month. A severe storm on May 6th produced straight line winds that were reported at 80-90 mph in Taylor County, resulting in damages to trees and structures in the vicinity. Heavy rain was reported across Gulf County on the 24th-26th, with rainfall totals as much as 13.6 inches over the three-day period. There was no tropical cyclone development in May, the first time in seven years since 2015, though Invest 90L came close on the 22nd as it formed in the Gulf of Mexico just before moving inland near Pensacola.
Table 4. Breakdown of storm reports submitted in Florida during the month of May (compiled from Iowa State University/Iowa Environmental Mesonet).
| Report Type | Number of Reports |
| Flash Flood | 6 |
| Heavy Rain | 15 |
| Flood | 11 |
| Hail | 106 |
| Lightning | 5 |
| Marine Thunderstorm Wind | 59 |
| Non-Thunderstorm Wind Gust | 1 |
| Non-Thunderstorm Wind Damage | 0 |
| Tornado/Waterspout/Funnel Cloud | 9/33/6 |
| Thunderstorm Wind Damage | 48 |
| Thunderstorm Wind Gust | 91 |
| Rip Currents | 1 |
| Wildfire | 7 |
Drought-Related Impacts.
At the beginning of May, nearly 4% of the state was in severe drought (D2), 14% was in moderate drought (D1), and 20% was abnormally dry (D0), according to the U.S. Drought Monitor. As of May 24, drought conditions had improved with only 1% of the state in severe drought (D2), roughly 7% in moderate drought (D1), and 26% of the state was experiencing abnormally dry conditions. Moderate drought and abnormally dry conditions continue to impact areas of the south-central Peninsula, and abnormally dry conditions exist in the coastal Panhandle and Big Bend regions (Figure 2 below).
As of May 31, the Lake Okeechobee water level was 12.60 ft. above sea level (Feet-NGVD29), which is below average for this time of the year. The water level declined throughout the month but remains well above the water shortage management threshold. At the first of the month, the water level was around 12.98 ft. above sea level.
Figure 2. A graphical depiction of the current drought conditions in Florida according to the U.S. Drought Monitor (courtesy of the National Drought Mitigation Center, University of Nebraska-Lincoln).
Agriculture-Related Impacts.
During mid-May, topsoil moisture conditions were adequate in 55% of the state, short in 32%, and very short in 10% of the state, while just 3% of the state had surplus moisture conditions. By the end of May, topsoil moisture had improved with levels adequate in 70% of the state, short in 15%, and very short in 2% of the state; 13% of the state was in surplus. For more information, consult the Crop Progress and Conditions report, which is published by the USDA's National Agricultural Statistics Service.
Appendix 1
Additional May departures from normal data for select Florida locations (Source: NWS).
| Station | Average Temperature (˚F) | Departure from Normal (˚F) | Total Rainfall (in.) | Departure from Normal (in.) |
| Gainesville | 76.0 | +1.0 | 3.77 | +0.69 |
| Sarasota | 78.8 | +1.0 | 4.26 | +1.68 |
| Melbourne | 78.5 | +0.4 | 0.78 | -2.75 |
| Fort Myers | 80.3 | +1.0 | 8.67 | +5.21 |
| West Palm Beach | 80.1 | +1.4 | 1.88 | -3.03 |
Appendix 2
Select daily record high minimum temperatures broken or tied during May (compiled from NOAA).
| Location | Date | Record (˚F) | Broken/Tied | Last |
| Key West | 6 | 83 | Broken | 82 in 1967 |
| Orlando | 7 | 75 | Broken | 74 in 1984 |
| Key West | 7 | 84 | Broken | 80 in 1978 |
| Lakeland | 7 | 71 | Broken | 70 in 1995 |
| Key West | 9 | 83 | Broken | 81 in 2019 |
| Orlando | 18 | 74 | Broken | 73 in 2003 |
| Tampa | 19 | 77 | Broken | 76 in 2016 |
| Pensacola | 19 | 76 | Tied | 76 in 2017 |
| Jacksonville Beach | 20 | 79 | Broken | 77 in 2017 |
| Melbourne | 20 | 75 | Broken | 74 in 1985 |
| Pensacola | 20 | 78 | Broken | 75 in 1957 |
| Niceville | 21 | 76 | Broken | 75 in 1938 |
| Perrine | 21 | 78 | Broken | 73 in 2021 |
| Wewahitchka | 21 | 73 | Broken | 72 in 1990 |
| Marianna | 21 | 74 | Broken | 73 in 2008 |
| Miami | 21 | 82 | Broken | 80 in 1991 |
| West Palm Beach | 21 | 79 | Tied | 79 in 1991 |
| Pensacola | 21 | 78 | Broken | 77 in 1957 |
| Fort Lauderdale | 22 | 79 | Broken | 77 in 2018 |
| Hialeah | 22 | 80 | Broken | 79 in 2001 |
| Perrine | 22 | 79 | Broken | 75 in 2018 |
| Royal Palm (RS) | 22 | 77 | Broken | 73 in 2018 |
| Stuart | 22 | 79 | Broken | 78 in 1957 |
| Ochopee | 22 | 76 | Broken | 73 in 2016 |
| Fort Myers | 22 | 78 | Broken | 75 in 2008 |
| Miami | 22 | 81 | Broken | 79 in 2011 |
| Vero Beach | 22 | 77 | Broken | 75 in 1964 |
| West Palm Beach | 22 | 80 | Broken | 78 in 2011 |
| Clermmont | 23 | 74 | Broken | 72 in 2017 |
| Fort Lauderdale | 23 | 79 | Broken | 78 in 1957 |
| Kissimmee | 23 | 76 | Broken | 74 in 2015 |
| Titusville | 23 | 77 | Broken | 76 in 2001 |
| Vero Beach | 23 | 77 | Broken | 76 in 2020 |
| Daytona Beach | 23 | 75 | Broken | 74 in 1997 |
| Fort Lauderdale | 24 | 79 | Broken | 78 in 1915 |
| Hastings | 24 | 72 | Broken | 71 in 1991 |
| Inverness | 24 | 75 | Broken | 74 in 2017 |
| Tampa | 24 | 79 | Broken | 78 in 2020 |
| West Palm Beach | 24 | 79 | Broken | 78 in 2019 |
| Key West | 25 | 85 | Broken | 81 in 1961 |
| Tampa | 26 | 74 | Broken | 72 in 2020 |
| Key West | 26 | 85 | Broken | 82 in 2020 |
| Orlando | 27 | 77 | Broken | 76 in 2000 |
Prepared by Florida Climate Center
The Florida State University
Tallahassee, FL
Key Points:
- Average temperatures in Florida were generally near to above normal in June; extreme heat with triple digit temperatures affected many locations during mid and late June.
- Rainfall totals for the month were variable, with south Florida receiving above normal rainfall.
- Tropical Storm Alex formed in the Atlantic Ocean on June 5 after passing over south Florida on June 4. The storm generated heavy rainfall and flash flooding; it passed quickly over Florida and eastward out over the Atlantic Ocean.
- La Niña conditions are still favored to continue into early fall, with a 60% chance in July-September 2022; the chances of La Niña increase into early winter to 62-66%.
Average temperatures in June were generally near to above normal. Based on average temperatures for the month, this June was the 7th-warmest June on record for Florida, with a statewide average temperature +2.4 ̊F above normal for the month. Average temperature departures from normal ranged from -1.5 ̊F in Key West to +2.9 ̊F in Tallahassee for the month (see Table 1 and Appendix 1 for select cities). June was warm particularly across northern and central Florida. Pensacola observed its second warmest June on record based on average temperatures, just 2 ̊F shy of the record warmest June which occurred in 1952, and it had its record warmest month based on average minimum temperatures. Many locations recorded triple digit temperatures mid to late June. Several daily high maximum and minimum temperature records were tied or broken throughout the month (see appendix 2 for select daily high maximum records).
Table 1. June average temperatures and departures from normal ( ̊F) for selected cities.
| Station | Mean Temperature | Departure from Normal |
| Pensacola | 84.4 | +2.7 |
| Tallahassee | 83.7 | +2.9 |
| Jacksonville | 80.7 | +0.4 |
| Orlando | 83.5 | +2.3 |
| Tampa | 85.2 | +2.3 |
| Miami | 82.4 | -0.4 |
| Key West | 82.6 | -1.5 |
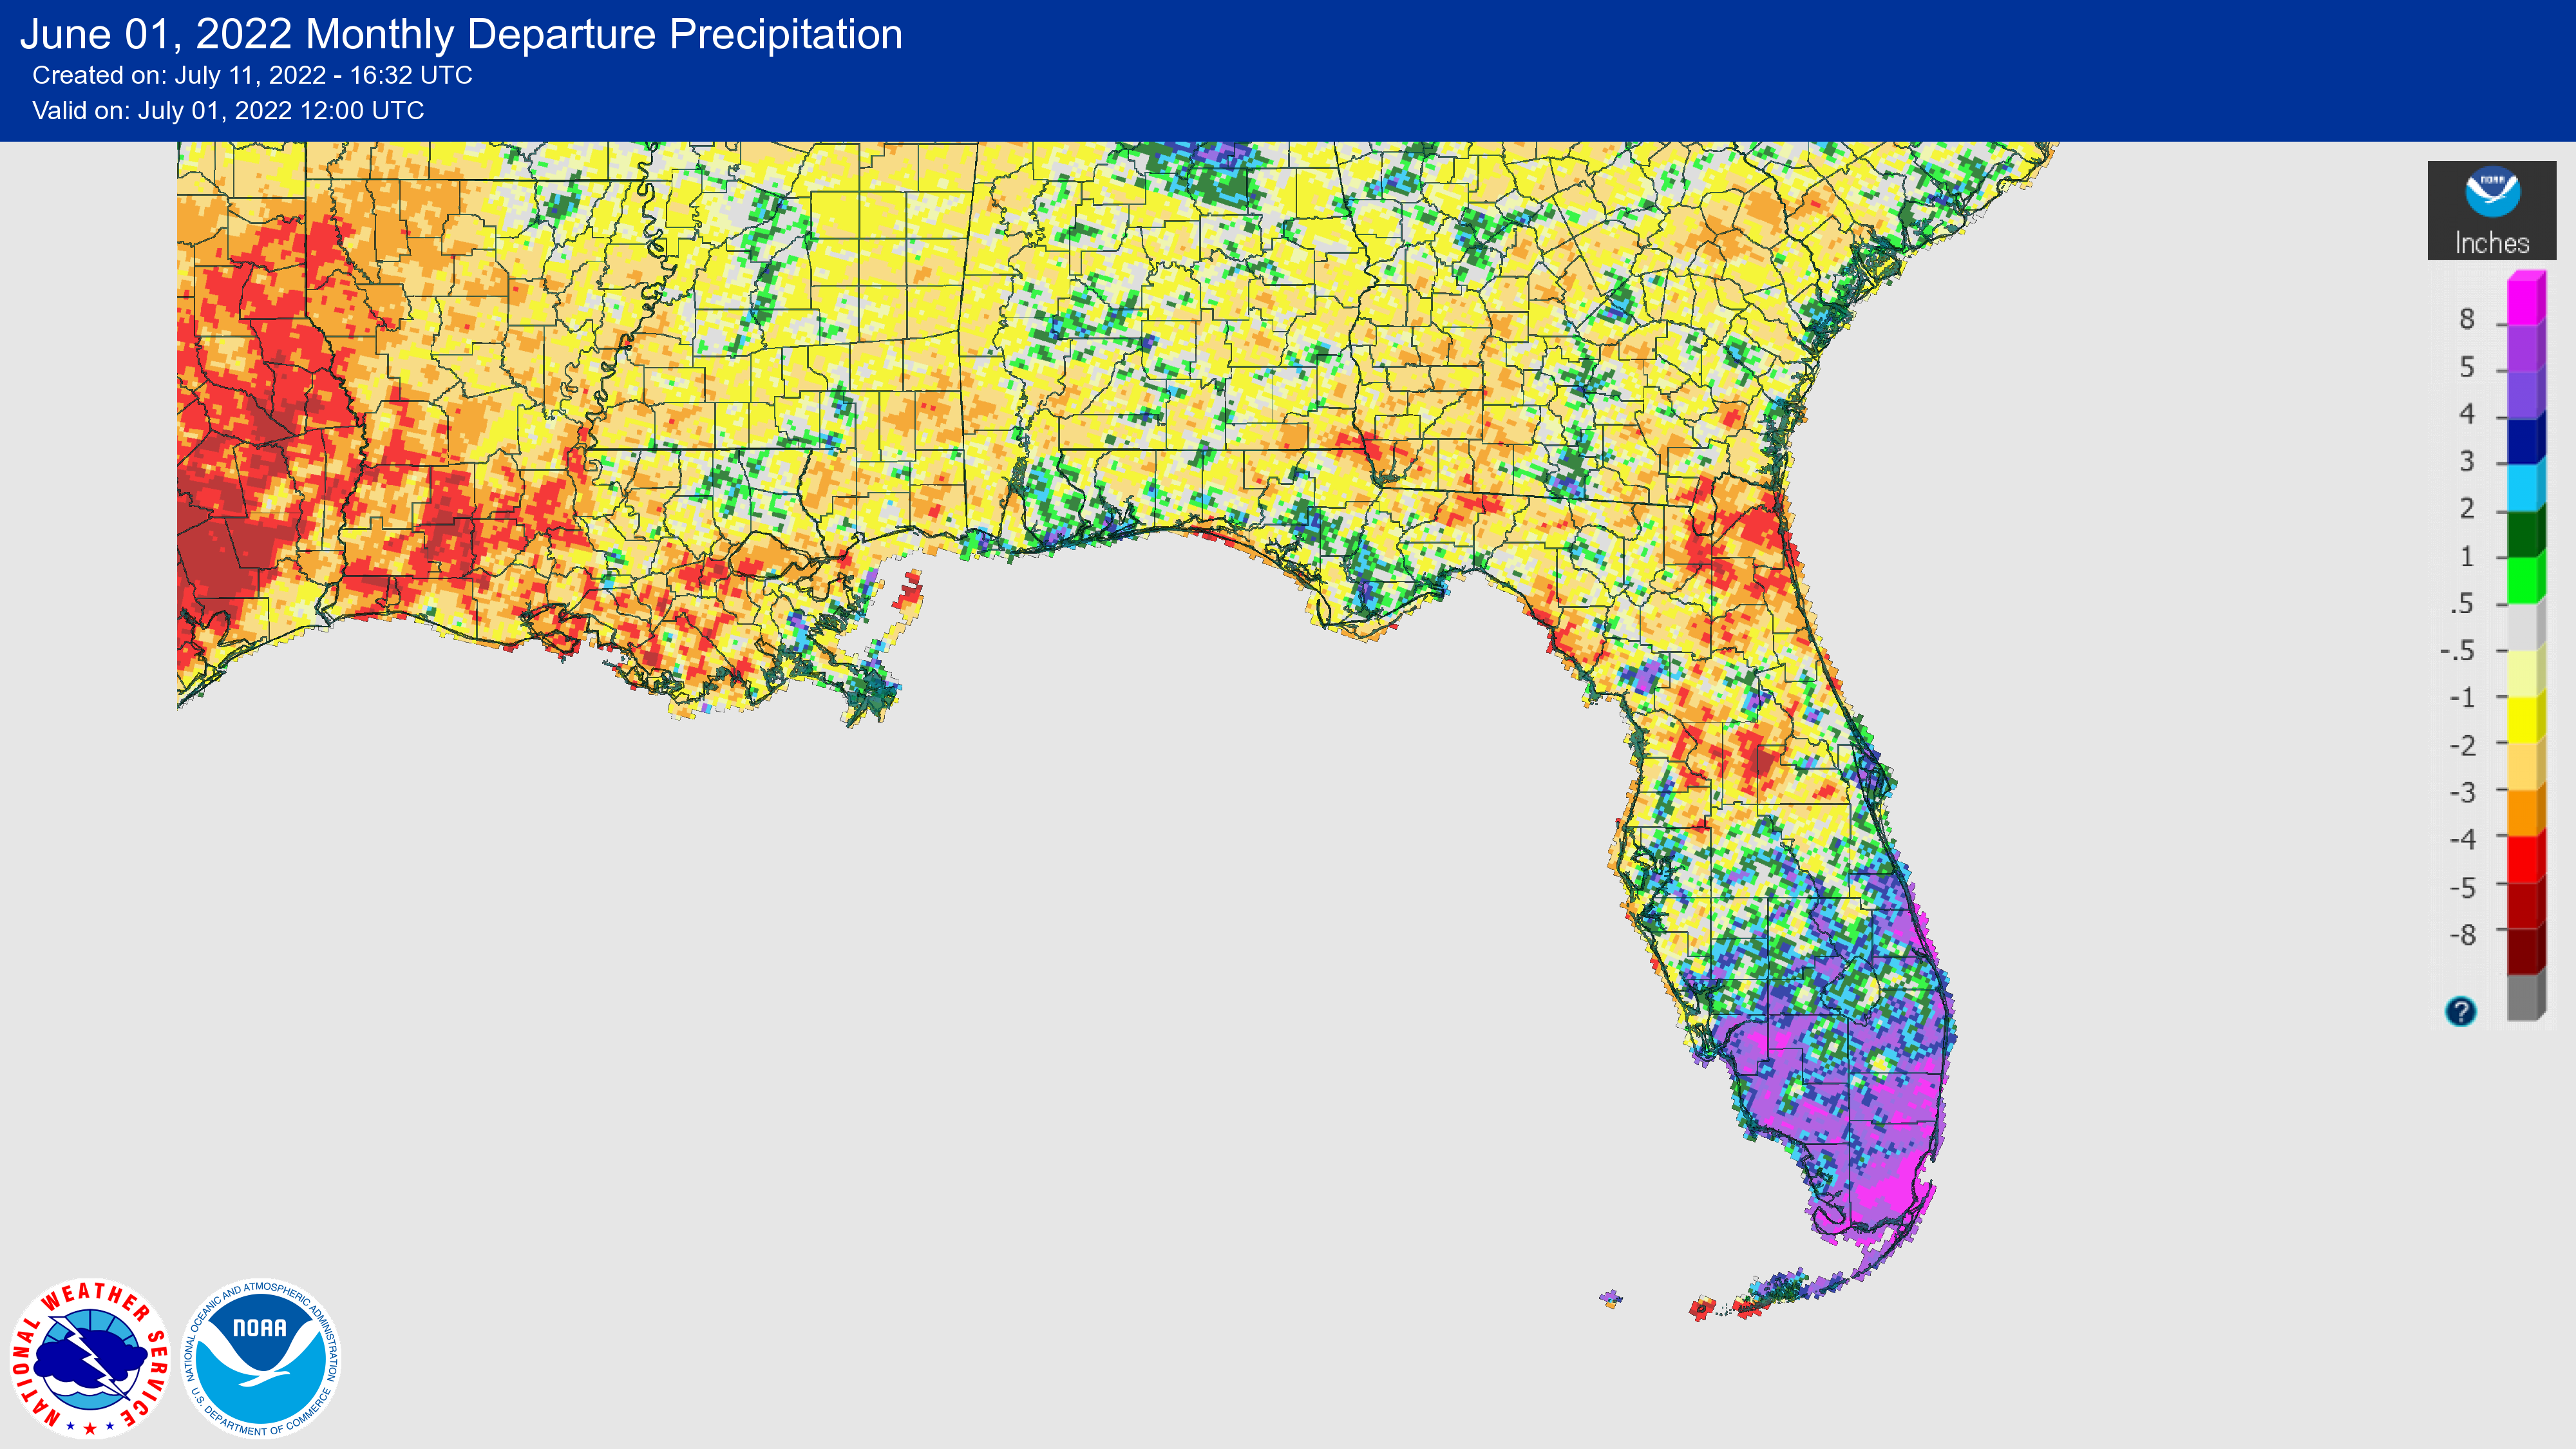
Rainfall totals in June were generally below normal in northern Florida, while south Florida was wetter than normal. Overall, June 2022 was the 62nd wettest June on record for the state. The monthly precipitation departures from normal ranged from -6.43 inches in Jacksonville to +5.10 inches in Miami (Table 2 and Appendix 1). Jacksonville had its driest June on record (based on a 75-year record), and Clermont had its second-driest June on record. Above normal rainfall in south Florida, including from Tropical Storm Alex, helped to alleviate drought in that area. Two-day rainfall totals from TS Alex, which passed over South Florida on June 4th, were as much as 14.85 inches in Hollywood, and 14.79 inches near Pompano Beach; Biscayne Park recorded 12.72 inches and Miami had over 11 inches.
Table 2. June precipitation totals and departures from normal (inches) for selected cities.
| Station | Total Rainfall | Departure from Normal |
| Pensacola | 7.39 | +0.07 |
| Tallahassee | 9.50 | +1.74 |
| Jacksonville | 1.17 | -6.43 |
| Orlando | 4.61 | -3.44 |
| Tampa | 8.07 | +0.70 |
| Miami | 15.61 | +5.10 |
| Key West | 6.61 | +2.38 |
Figure 1. A graphical depiction of the monthly rainfall departure from normal (inches) for June (courtesy of NOAA, NWS).
La Niña Advisory.
La Niña conditions in the equatorial Pacific Ocean continued in June. La Niña is now favored to continue into the late Northern Hemisphere summer (60% chance in July-September 2022), and it is expected to persist into the Northern Hemisphere winter 2022-23. The chances for La Niña to continue into the Northern Hemisphere fall and early winter have increased to a 62-66% chance. This will be the third year in a row with La Niña, which has only happened twice in the past ~70 years.
Hazardous Weather Events in June.
According to the Local Storm Reports issued by the local National Weather Service offices serving Florida, there were 483 individual local reports of hazardous weather events recorded across the state during the month of June (see Table 4 for a breakdown by event type). In early June, Tropical Storm Alex became the first named storm of the Atlantic hurricane season. The storm brought heavy rainfall and localized flash flooding to many parts of south Florida, including in Miami-Dade, Broward, Lee, and Collier counties. 2022 is expected to be the 7th year in a row with above normal hurricane activity in the Atlantic basin. The second named storm of the Atlantic Basin hurricane season occurs, on average, in mid-July.
Table 4. Breakdown of storm reports submitted in Florida during the month of June (compiled from Iowa State University/Iowa Environmental Mesonet).
| Report Type | Number of Reports |
| Flash Flood | 18 |
| Heavy Rain | 33 |
| Flood | 30 |
| Hail | 43 |
| Lightning | 5 |
| Marine Thunderstorm Wind | 49 |
| Non-Thunderstorm Wind Gust | 5 |
| Non-Thunderstorm Wind Damage | 0 |
| Tornado/Waterspout/Funnel Cloud | 4/18/5 |
| Thunderstorm Wind Damage | 95 |
| Thunderstorm Wind Gust | 145 |
| Rip Currents | 4 |
| Wildfire | 1 |
| High Sustained Winds | 1 |
| Tropical Storm | 27 |
Daily Record Events in June.
Table 5.Summary of daily records broken or set in Florida in June (source: NCEI Daily Weather Records).
| Category | Number of Records |
| Highest daily max. temp. | 40 |
| Highest daily min. temp. | 43 |
| Lowest daily max. temp. | 12 |
| Lowest daily min. temp. | 7 |
| Highest daily precipitation | 18 |
| Total | 120 |
Weather/Climate Highlight of the Month: Extreme Heat.
The state saw its first triple digit temperatures of the season in June. Clermont recorded a maximum temperature of 101 ̊F on the 16th, followed by Pensacola with a temperature of 100 ̊F on the 18th. Record heat affected the Panhandle and central Florida again from the 22nd-25th. The highest maximum temperature observed during the month was 104 ̊F in Crestview and Tallahassee on the 23rd and 24th, respectively, setting new daily records at both locations.
Drought-Related Impacts.
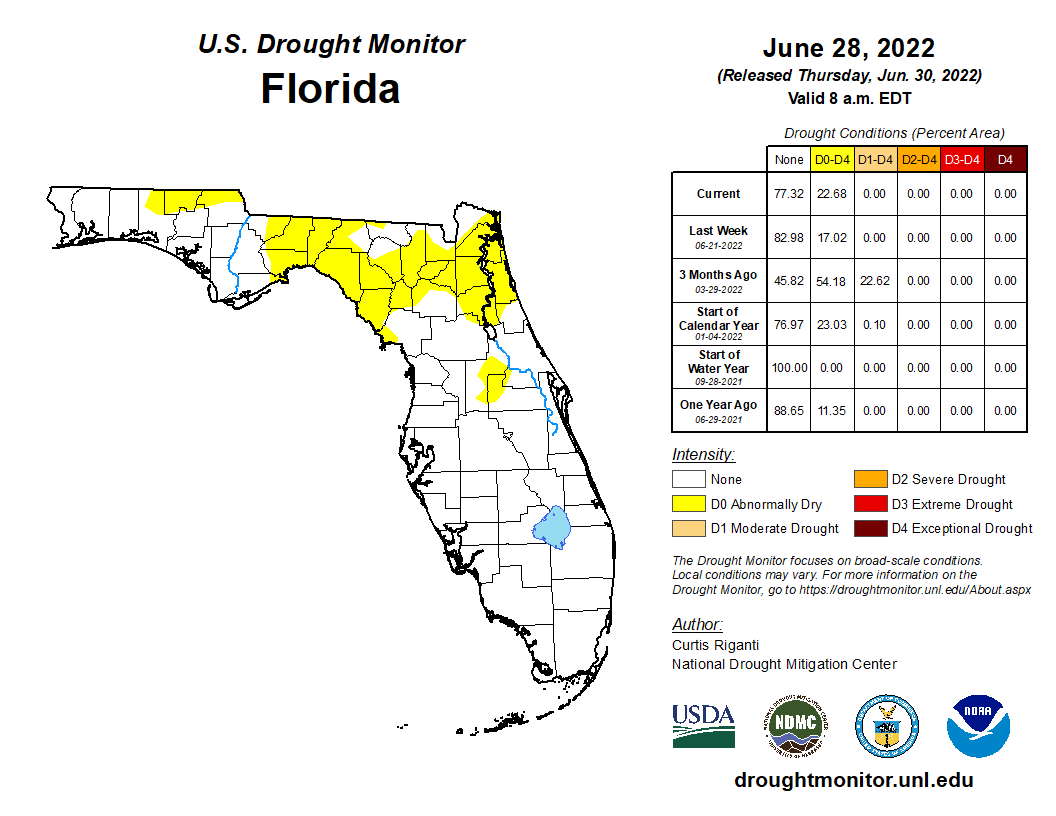
At the beginning of June, approximately 18% of the state was experiencing abnormally dry conditions (D0), and nearly 1% of the state was in moderate drought (D1), according to the U.S. Drought Monitor. As of June 28, moderate drought conditions had improved but about 23% of the state was in abnormally dry conditions (Figure 2 below).
As of June 30, the Lake Okeechobee water level was 12.92 ft. above sea level (Feet-NGVD29), which is below average for this time of the year. The water level remained below average throughout the month, though it did increase through mid-month to just below average levels before declining again. At the first of the month, the water level was 12.57 ft. above sea level.
Figure 2. A graphical depiction of the current drought conditions in Florida according to the U.S. Drought Monitor (courtesy of the National Drought Mitigation Center, University of Nebraska-Lincoln).
Agriculture-Related Impacts.
During mid-June, topsoil moisture conditions were adequate in 85% of the state, short in 12%, and very short in 2% of the state, while just 1% of the state had surplus moisture conditions. Near the end of June, topsoil moisture had declined somewhat with levels adequate in 68% of the state, short in 20%, and very short in 4% of the state; 8% of the state was in surplus. For more information, consult the Crop Progress and Conditions report, which is published by the USDA's National Agricultural Statistics Service.
Appendix 1
Additional June departures from normal data for select Florida locations (Source: NWS).
| Station | Average Temperature (˚F) | Departure from Normal (˚F) | Total Rainfall (in.) | Departure from Normal (in.) |
| Gainesville | 81.9 | +2.0 | 3.29 | -4.27 |
| Sarasota | 82.2 | +0.4 | 8.10 | +1.05 |
| Melbourne | 81.3 | +0.5 | 5.66 | -1.44 |
| Fort Myers | 82.8 | +0.5 | 14.08 | +4.42 |
| West Palm Beach | 82.1 | +0.4 | 9.02 | +0.54 |
Appendix 2
Select daily record high maximum temperatures broken or tied during June (compiled from NOAA).
| Location | Date | Record (˚F) | Broken/Tied | Last |
| Key West | 6 | 92 | Broken | 91 in 2020 |
| Orlando | 7 | 96 | Tied | 96 in 1993 |
| Clermont | 8 | 97 | Tied | 97 in 1951 |
| Jacksonville Beach | 8 | 98 | Broken | 97 in 1948 |
| Jacksonville Beach | 9 | 99 | Broken | 98 in 1981 |
| Key West | 13 | 95 | Broken | 94 in 2013 |
| Clermont | 15 | 98 | Tied | 98 in 1981 |
| Tampa | 15 | 95 | Tied | 95 in 2015 |
| Clermont | 16 | 101 | Tied | 101 in 1981 |
| Crestview | 16 | 99 | Broken | 98 in 2009 |
| Perry | 17 | 99 | Broken | 98 in 2010 |
| Tampa | 17 | 97 | Broken | 96 in 2009 |
| Pensacola | 18 | 100 | Broken | 99 in 1953 |
| Tampa | 18 | 98 | Broken | 96 in 2009 |
| Pensacola | 18 | 100 | Tied | 100 in 1953 |
| Clermont | 20 | 98 | Tied | 98 in 2000 |
| Key West | 21 | 95 | Broken | 93 in 1969 |
| Crestview | 22 | 103 | Broken | 102 in 2009 |
| Jacksonville Beach | 23 | 102 | Broken | 95 in 2020 |
| Marianna | 23 | 102 | Broken | 100 in 2009 |
| Mayport | 23 | 103 | Broken | 97 in 1991 |
| Orlando | 23 | 99 | Broken | 97 in 2011 |
| Cross City | 23 | 101 | Broken | 98 in 1998 |
| Daytona Beach | 23 | 101 | Broken | 100 in 1944 |
| Crestview | 23 | 104 | Broken | 101 in 2015 |
| Jacksonville | 23 | 100 | Broken | 99 in 1998 |
| Tallahassee | 23 | 103 | Tied | 103 in 1944 |
| Jacksonville | 23 | 103 | Broken | 102 in 1998 |
| Chipley | 24 | 100 | Tied | 100 in 2006 |
| Clermont | 24 | 100 | Broken | 99 in 1977 |
| Jacksonville Beach | 24 | 102 | Broken | 96 in 1950 |
| Plant City | 24 | 100 | Tied | 100 in 2020 |
| Quincy | 24 | 99 | Broken | 96 in 2000 |
| Marianna | 24 | 100 | Broken | 99 in 2010 |
| Orlando | 24 | 99 | Broken | 97 in 1998 |
| Gainesville | 24 | 98 | Broken | 97 in 2018 |
| Crestview | 24 | 103 | Broken | 99 in 2006 |
| Pensacola | 24 | 98 | Broken | 97 in 1998 |
| Tallahassee | 24 | 104 | Broken | 103 in 1944 |
| Chipley | 25 | 101 | Broken | 98 in 2010 |
| Clermont | 25 | 100 | Tied | 100 in 2016 |
| Lisbon | 25 | 98 | Tied | 98 in 1991 |
| Perry | 25 | 101 | Broken | 98 in 1996 |
| Wewahitchka | 25 | 101 | Broken | 98 in 1998 |
| Lisbon | 26 | 98 | Broken | 96 in 2020 |
| Key West | 29 | 94 | Broken | 93 in 2020 |
Prepared by Florida Climate Center
The Florida State University
Tallahassee, FL
Key Points:
- Average temperatures in July were near or above normal for the month.
- Drought conditions improved in July across Florida; however, small areas of northern Florida continued to experience abnormally dry conditions throughout the month.
- La Niña conditions are favored to continue into early fall, with a 68% chance August-October 2022; the chances of La Niña increase in fall and early winter to a 63-70% likelihood.
- The tropics were quiet in July, but we are entering the peak of the Atlantic Basin hurricane season over the next couple of months.
Average temperatures in July were about normal or above normal across Florida. Average temperature departures from normal ranged from -0.3 ̊F in Key West to +2.5 ̊F in Tampa for the month (see Table 1 and Appendix 1 for select cities). Jacksonville Beach, Tampa, and Plant City had their hottest Julys on record, and Orlando and Fort Lauderdale recorded their 2nd-hottest Julys on record. While Key West was near normal, it broke many daily high maximum and minimum temperature records throughout the month (see appendices 2 and 3 for select daily high maximum and minimum records).
Table 1. July average temperatures and departures from normal ( ̊F) for selected cities.
| Station | Mean Temperature | Departure from Normal |
| Pensacola | 83.5 | 0.0 |
| Tallahassee | 82.3 | -0.2 |
| Jacksonville | 82.6 | +0.1 |
| Orlando | 84.8 | +2.2 |
| Tampa | 86.3 | +2.5 |
| Miami | 84.7 | +0.6 |
| Key West | 85.1 | -0.3 |
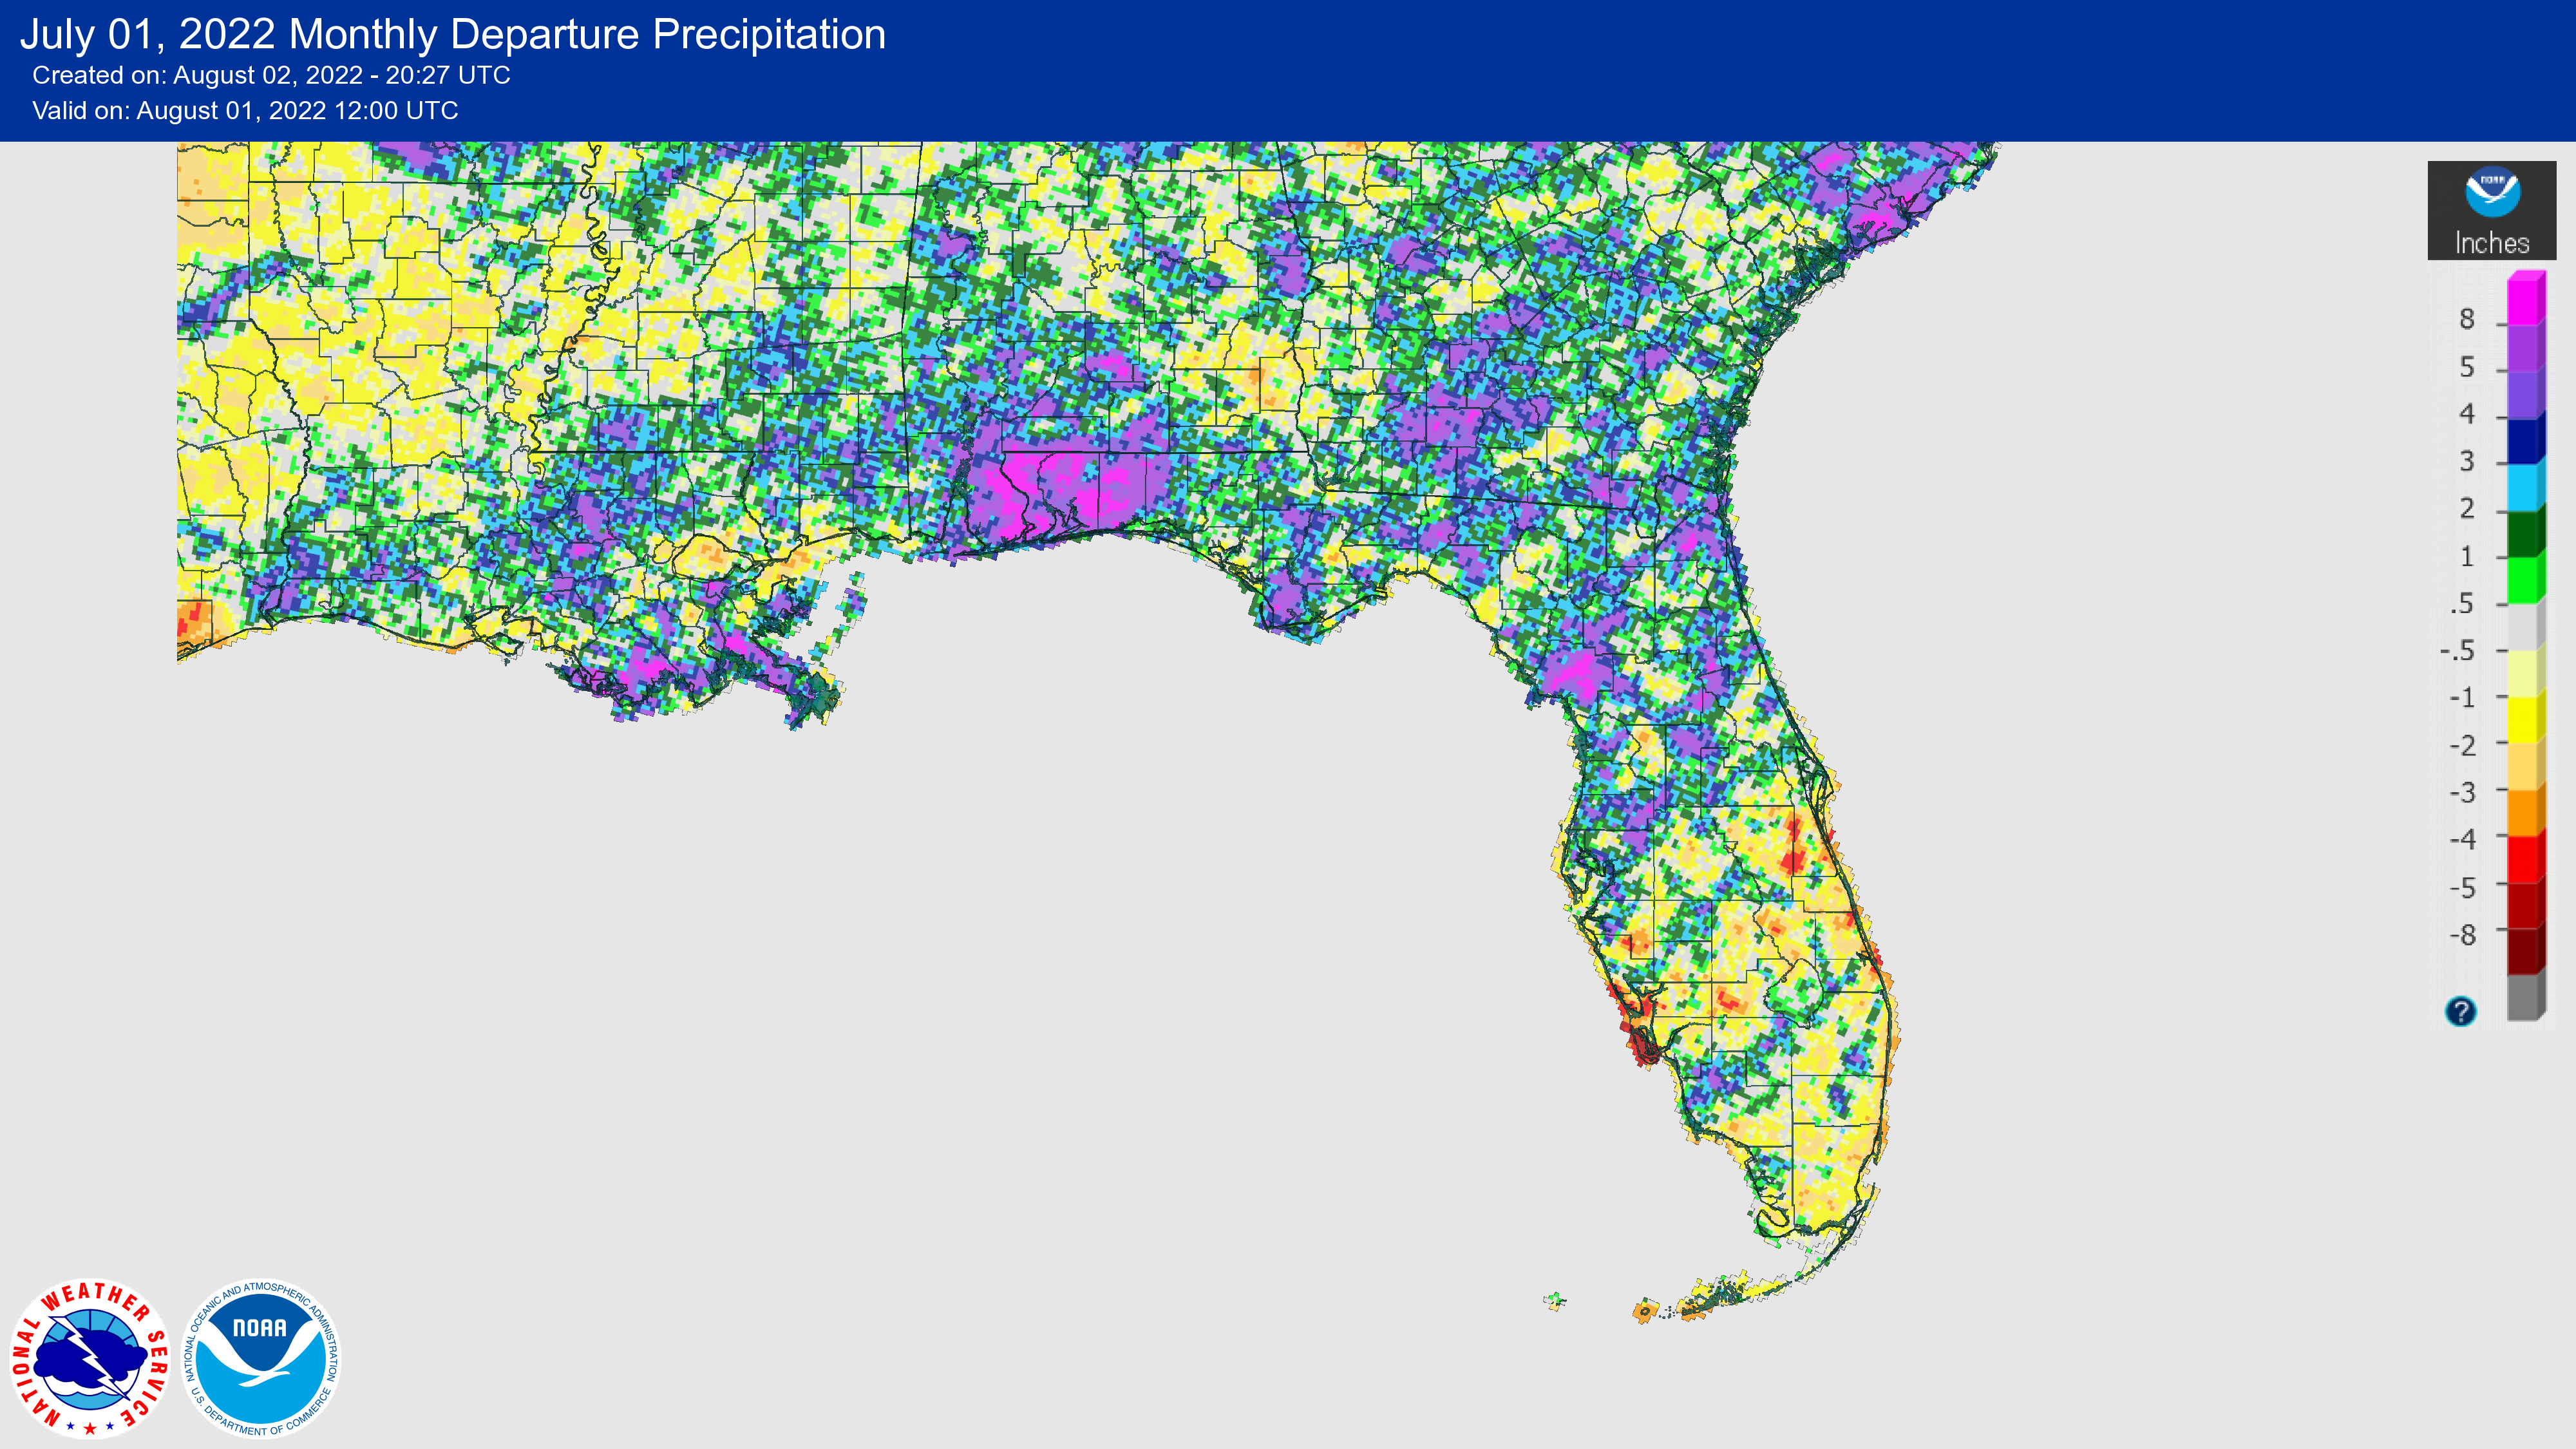
Rainfall totals in July were variable but generally above normal across the Panhandle and north Florida, and below normal in much of south Florida. The monthly precipitation departures from normal ranged from -4.53 inches in Melbourne to +5.86 inches in Tallahassee (Table 2 and Appendix 1). Ample rain fell across portions of northern Florida due to unsettled weather, with roughly 65% and 74% of the month with measurable rain in Pensacola and Tallahassee, respectively. Jacksonville had its 7th-wettest July on record. Conversely, a deficit of rain fell across southeastern and central Florida. This was the 3rd-driest July on record at Fort Pierce and Fort Lauderdale.
Table 2. July precipitation totals and departures from normal (inches) for selected cities.
| Station | Total Rainfall | Departure from Normal |
| Pensacola | 11.17 | +3.28 |
| Tallahassee | 13.00 | +5.86 |
| Jacksonville | 9.95 | +3.18 |
| Orlando | 4.91 | -2.55 |
| Tampa | 11.99 | +4.24 |
| Miami | 4.81 | -2.55 |
| Key West | 2.37 | -1.26 |
Figure 1. A graphical depiction of the monthly rainfall departure from normal (inches) for July (courtesy of NOAA, NWS).
La Niña Advisory.
La Niña is still favored to continue through 2022. By mid-July, sea surface temperatures in the central-eastern equatorial Pacific remained below average. La Niña conditions are expected to persist into the late Northern Hemisphere summer and early fall (68% chance August-October 2022). The chances for La Niña to continue into the Northern Hemisphere fall and early winter increase to a 63-70% likelihood. This will likely be the third year in a row with La Niña, which has only happened twice in the past ~70 years.
Hazardous Weather Events in July.
According to the Local Storm Reports issued by the local National Weather Service offices serving Florida, there were 297 individual local reports of hazardous weather events recorded across the state during the month of July (see Table 4 for a breakdown by event type). Thunderstorms and ample rainfall affected much of northern Florida throughout the month, with monthly rainfall totals over 10 inches in many places. A lightning strike resulted in a fatality in New Smyrna Beach on the 19th. While several waterspouts were reported, there were no tornado reports this month and there was no tropical activity in the Atlantic Basin. There are on average 7 tornadoes reported in Florida during July, based on climatology (1991-2010). While the tropics were quiet, we are on pace with the climatological average for hurricane season and are now entering the peak Atlantic Hurricane Season over the next couple of months.
Table 4. Breakdown of storm reports submitted in Florida during the month of July (compiled from Iowa State University/Iowa Environmental Mesonet).
| Report Type | Number of Reports |
| Flash Flood | 5 |
| Heavy Rain | 21 |
| Flood | 19 |
| Hail | 18 |
| Lightning | 10 |
| Marine Thunderstorm Wind | 60 |
| Non-Thunderstorm Wind Gust | 2 |
| Non-Thunderstorm Wind Damage | 0 |
| Tornado/Waterspout/Funnel Cloud | 0/18/4 |
| Thunderstorm Wind Damage | 28 |
| Thunderstorm Wind Gust | 105 |
| Rip Currents | 4 |
| Wildfire | 3 |
| Tropical Storm | 0 |
Daily Record Events in July.
Table 5.Summary of daily records broken or set in Florida in July (source: NCEI Daily Weather Records).
| Category | Number of Records |
| Highest daily max. temp. | 34 |
| Highest daily min. temp. | 45 |
| Lowest daily max. temp. | 9 |
| Lowest daily min. temp. | 11 |
| Highest daily precipitation | 28 |
| Total | 127 |
Weather/Climate Highlight of the Month.
Tropical Strom Colin was the only tropical system that formed in July (July 2-3) in the Atlantic Basin, which impacted the coastal Carolinas before moving out into the open ocean. It was a small, surprise storm that did not produce much rain. Maximum winds were around 40 mph. This was the third named storm of the season and occurred ahead of the climatological average for the Atlantic hurricane season.
Drought-Related Impacts.
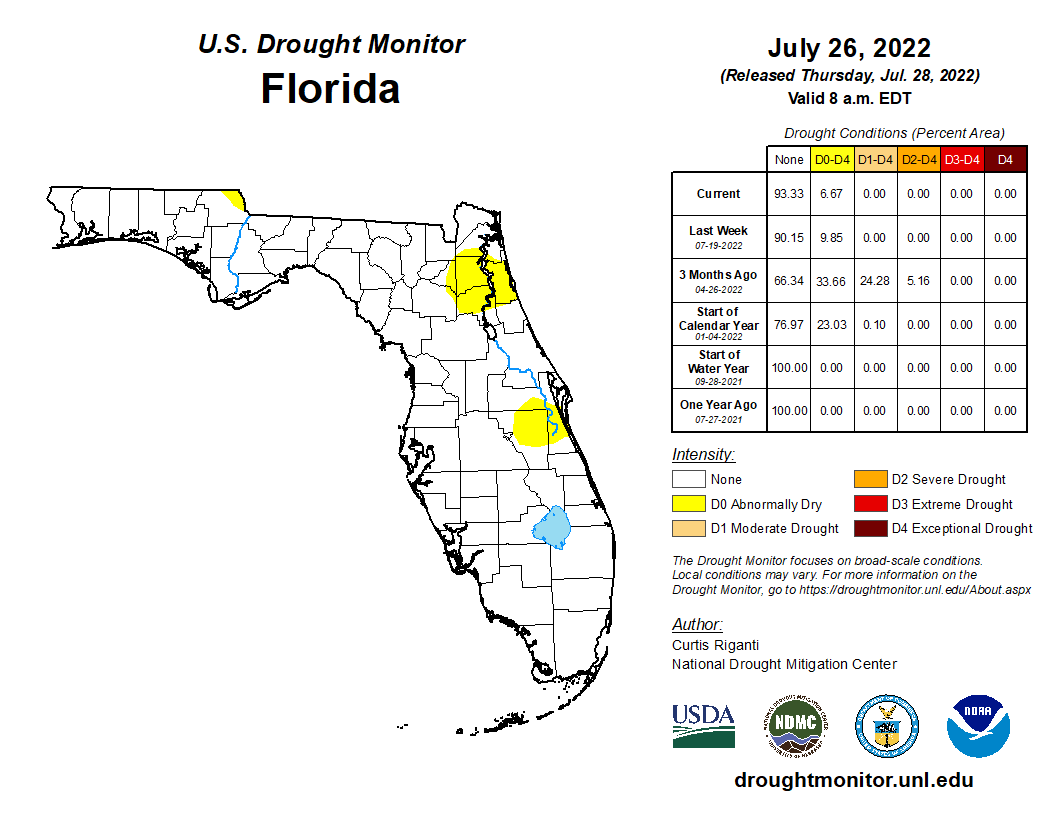
At the beginning of July, 23.5% of the state was experiencing abnormally dry conditions (D0), according to the U.S. Drought Monitor. Abnormally dry conditions steadily improved throughout the month, and as of July 26, only 6.7% of the state was in abnormally dry conditions (Figure 2 below).
As of July 31, the Lake Okeechobee water level was 12.96 ft. above sea level (Feet-NGVD29), which is below average for this time of the year. The water level remained below average throughout the month. At the first of the month, the water level was 12.90 ft. above sea level.
Figure 2. A graphical depiction of the current drought conditions in Florida according to the U.S. Drought Monitor (courtesy of the National Drought Mitigation Center, University of Nebraska-Lincoln).
Agriculture-Related Impacts.
During mid-July, topsoil moisture conditions were adequate in 84% of the state, short in 6%, and very short in 1% of the state, while 9% of the state had surplus moisture conditions. Near the end of July, topsoil moisture had declined somewhat with levels adequate in 79% of the state, short in 13%, and very short in 1% of the state; 7% of the state was in surplus. For more information, consult the Crop Progress and Conditions report, which is published by the USDA's National Agricultural Statistics Service.
Appendix 1
Additional July departures from normal data for select Florida locations (Source: NWS).
| Station | Average Temperature (˚F) | Departure from Normal (˚F) | Total Rainfall (in.) | Departure from Normal (in.) |
| Gainesville | 82.4 | +1.0 | 10.09 | +3.41 |
| Sarasota | 83.5 | +0.4 | 5.80 | -1.59 |
| Melbourne | 83.5 | +0.4 | 1.97 | -4.53 |
| Fort Myers | 85.3 | +2.1 | 9.52 | +0.14 |
| West Palm Beach | 85.4 | +2.3 | 2.00 | -3.63 |
Appendix 2
Select daily record high maximum temperatures broken or tied during July (compiled from NOAA).
| Location | Date | Record (˚F) | Broken/Tied | Last |
| Key West | 1 | 96 | Broken | 95 in 2019 |
| Key West | 3 | 95 | Broken | 93 in 2020 |
| Jacksonville Beach | 4 | 97 | Tied | 97 in 1978 |
| Key West | 4 | 96 | Broken | 95 in 2020 |
| Key West | 5 | 96 | Broken | 94 in 2020 |
| Clermont | 6 | 99 | Broken | 98 in 2019 |
| Plant City | 8 | 98 | Tied | 98 in 1969 |
| Key West | 8 | 96 | Broken | 95 in 2020 |
| Orlando | 9 | 97 | Tied | 97 in 1992 |
| Daytona Beach | 9 | 97 | Tied | 97 in 2010 |
| Vero Beach | 10 | 97 | Broken | 96 in 1995 |
| Key West | 11 | 96 | Broken | 94 in 2020 |
| Kissimmee | 13 | 99 | Broken | 98 in 1981 |
| Orlando | 13 | 99 | Broken | 98 in 1937 |
| Plant City | 14 | 99 | Tied | 99 in 1916 |
| Key West | 14 | 95 | Broken | 94 in 2020 |
| Key West | 17 | 95 | Broken | 94 in 2019 |
| Orlando | 18 | 97 | Tied | 97 in 1983 |
| Key West | 18 | 98 | Broken | 93 in 2021 |
| Key West | 19 | 97 | Broken | 93 in 2019 |
| Key West | 20 | 96 | Broken | 93 in 2021 |
| Orlando | 21 | 96 | Broken | 95 in 2012 |
| Clermont | 22 | 98 | Broken | 97 in 2021 |
| Key West | 22 | 95 | Broken | 94 in 2011 |
| Key West | 24 | 97 | Broken | 94 in 2011 |
| Key West | 25 | 96 | Broken | 94 in 2011 |
| Tampa | 29 | 97 | Tied | 97 in 1993 |
| Canal Point | 30 | 96 | Broken | 95 in 2017 |
| Tampa | 30/td> | 97 | Broken | 96 in 1961 |
| Plant City | 31 | 99 | Tied | 99 in 2019 |
| Tampa | 31 | 97 | Broken | 96 in 1958 |
Appendix 3
Select daily record high minimum temperatures broken or tied during July (compiled from NOAA).
| Location | Date | Record (˚F) | Broken/Tied | Last |
| Key West | 1 | 87 | Broken | 84 in 2019 |
| Perrine | 2 | 78 | Broken | 77 in 2006 |
| Key West | 2 | 87 | Broken | 86 in 2019 |
| Key West | 4 | 86 | Broken | 85 in 2019 |
| Fort Lauderdale | 5 | 80 | Tied | 80 in 2017 |
| Mayport | 5 | 78 | Tied | 78 in 2007 |
| Tampa | 5 | 81 | Tied | 81 in 2016 |
| Lakeland | 5 | 77 | Broken | 76 in 1995 |
| Fort Pierce | 6 | 80 | Broken | 79 in 1934 |
| Hastings | 6 | 77 | Broken | 76 in 2017 |
| Melbourne | 6 | 79 | Tied | 79 in 2011 |
| Stuart | 6 | 80 | Tied | 80 in 1967 |
| Marianna | 7 | 76 | Broken | 75 in 2017 |
| Key West | 8 | 87 | Broken | 84 in 2007 |
| Tallahassee | 8 | 78 | Broken | 76 in 2016 |
| Chipley | 9 | 77 | Broken | 76 in 2016 |
| Tampa | 9 | 81 | Tied | 81 in 2020 |
| West Palm Beach | 9 | 81 | Tied | 81 in 2015 |
| Key West | 9 | 87 | Broken | 84 in 2021 |
| Plant City | 10 | 80 | Broken | 79 in 2020 |
| Ochoppee | 10 | 82 | Broken | 79 in 2005 |
| Key West | 10 | 87 | Broken | 83 in 2016 |
| Lakeland | 11 | 77 | Broken | 76 in 1969 |
| Orlando | 12 | 80 | Broken | 79 in 2007 |
| Key West | 12 | 86 | Broken | 83 in 2020 |
| Clermont | 13 | 78 | Broken | 77 in 2011 |
| Miami | 13 | 82 | Tied | 82 in 2019 |
| Key West | 13 | 88 | Broken | 85 in 2020 |
| Key West | 17 | 87 | Broken | 85 in 2019 |
| Usher Tower | 18 | 78 | Broken | 76 in 1998 |
| Key West | 18 | 89 | Broken | 84 in 2021 |
| Tampa | 19 | 83 | Broken | 81 in 2018 |
| Pensacola | 19 | 82 | Broken | 79 in 2002 |
| Tampa | 20 | 83 | Broken | 81 in 1942 |
| Key West | 20 | 86 | Broken | 84 in 1962 |
| Key West | 21 | 88 | Broken | 84 in 2021 |
| Orlando | 22 | 80 | Broken | 79 in 2021 |
| Key West | 24 | 86 | Broken | 85 in 2011 |
| Stuart | 25 | 82 | Broken | 81 in 1993 |
| West Palm Beach | 25 | 83 | Broken | 82 in 2011 |
| Key West | 25 | 87 | Broken | 85 in 2011 |
| Daytona Beach | 26 | 81 | Broken | 80 in 2020 |
| Perrine | 30 | 79 | Broken | 77 in 1995 |
| Lakeland | 30 | 77 | Broken | 76 in 1970 |
| Key West | 31 | 87 | Broken | 85 in 2021 |
Prepared by Florida Climate Center
The Florida State University
Tallahassee, FL
Key Points:
- Average temperatures in August were near normal in the Panhandle and above normal in Peninsular Florida.
- Abnormally dry conditions expanded in east-central and southeastern Florida during the month, with moderate drought emerging in Brevard and Indian River Counties.
- La Niña is expected to continue through the winter, with chances decreasing to 60% during December-February 2022-23.
- Tropical activity remained quiet and August 2022 became the first time since 1997 with no named storms in the Atlantic basin.
Average temperatures in August were near normal in the Panhandle and above normal in Peninsular Florida. Average temperature departures from normal ranged from -0.6 ̊F in Key West to +2.4 ̊F in West Palm Beach for the month (see Table 1 and Appendix 1 for select cities). Many locations experienced their hottest August on record based on mean monthly temperatures, including Clermont, Tampa, Fort Myers, West Palm Beach, and Hollywood; many other locations recorded one of their top five warmest Augusts on record. Overnight temperatures have been especially warm in south Florida. Summer of 2022 (June-August) has been warmer than normal overall, and most stations in the state had one of their top ten hottest summers on record. Many daily high maximum and high minimum temperature records were set (see appendix 2 for select daily high maximum records).
Table 1. August average temperatures and departures from normal ( ̊F) for selected cities.
| Station | Mean Temperature | Departure from Normal |
| Pensacola | 82.8 | -0.2 |
| Tallahassee | 81.9 | -0.5 |
| Jacksonville | 81.6 | -0.5 |
| Orlando | 84.7 | +2.1 |
| Tampa | 85.6 | +1.6 |
| Miami | 85.6 | +1.4 |
| Key West | 84.9 | -0.6 |
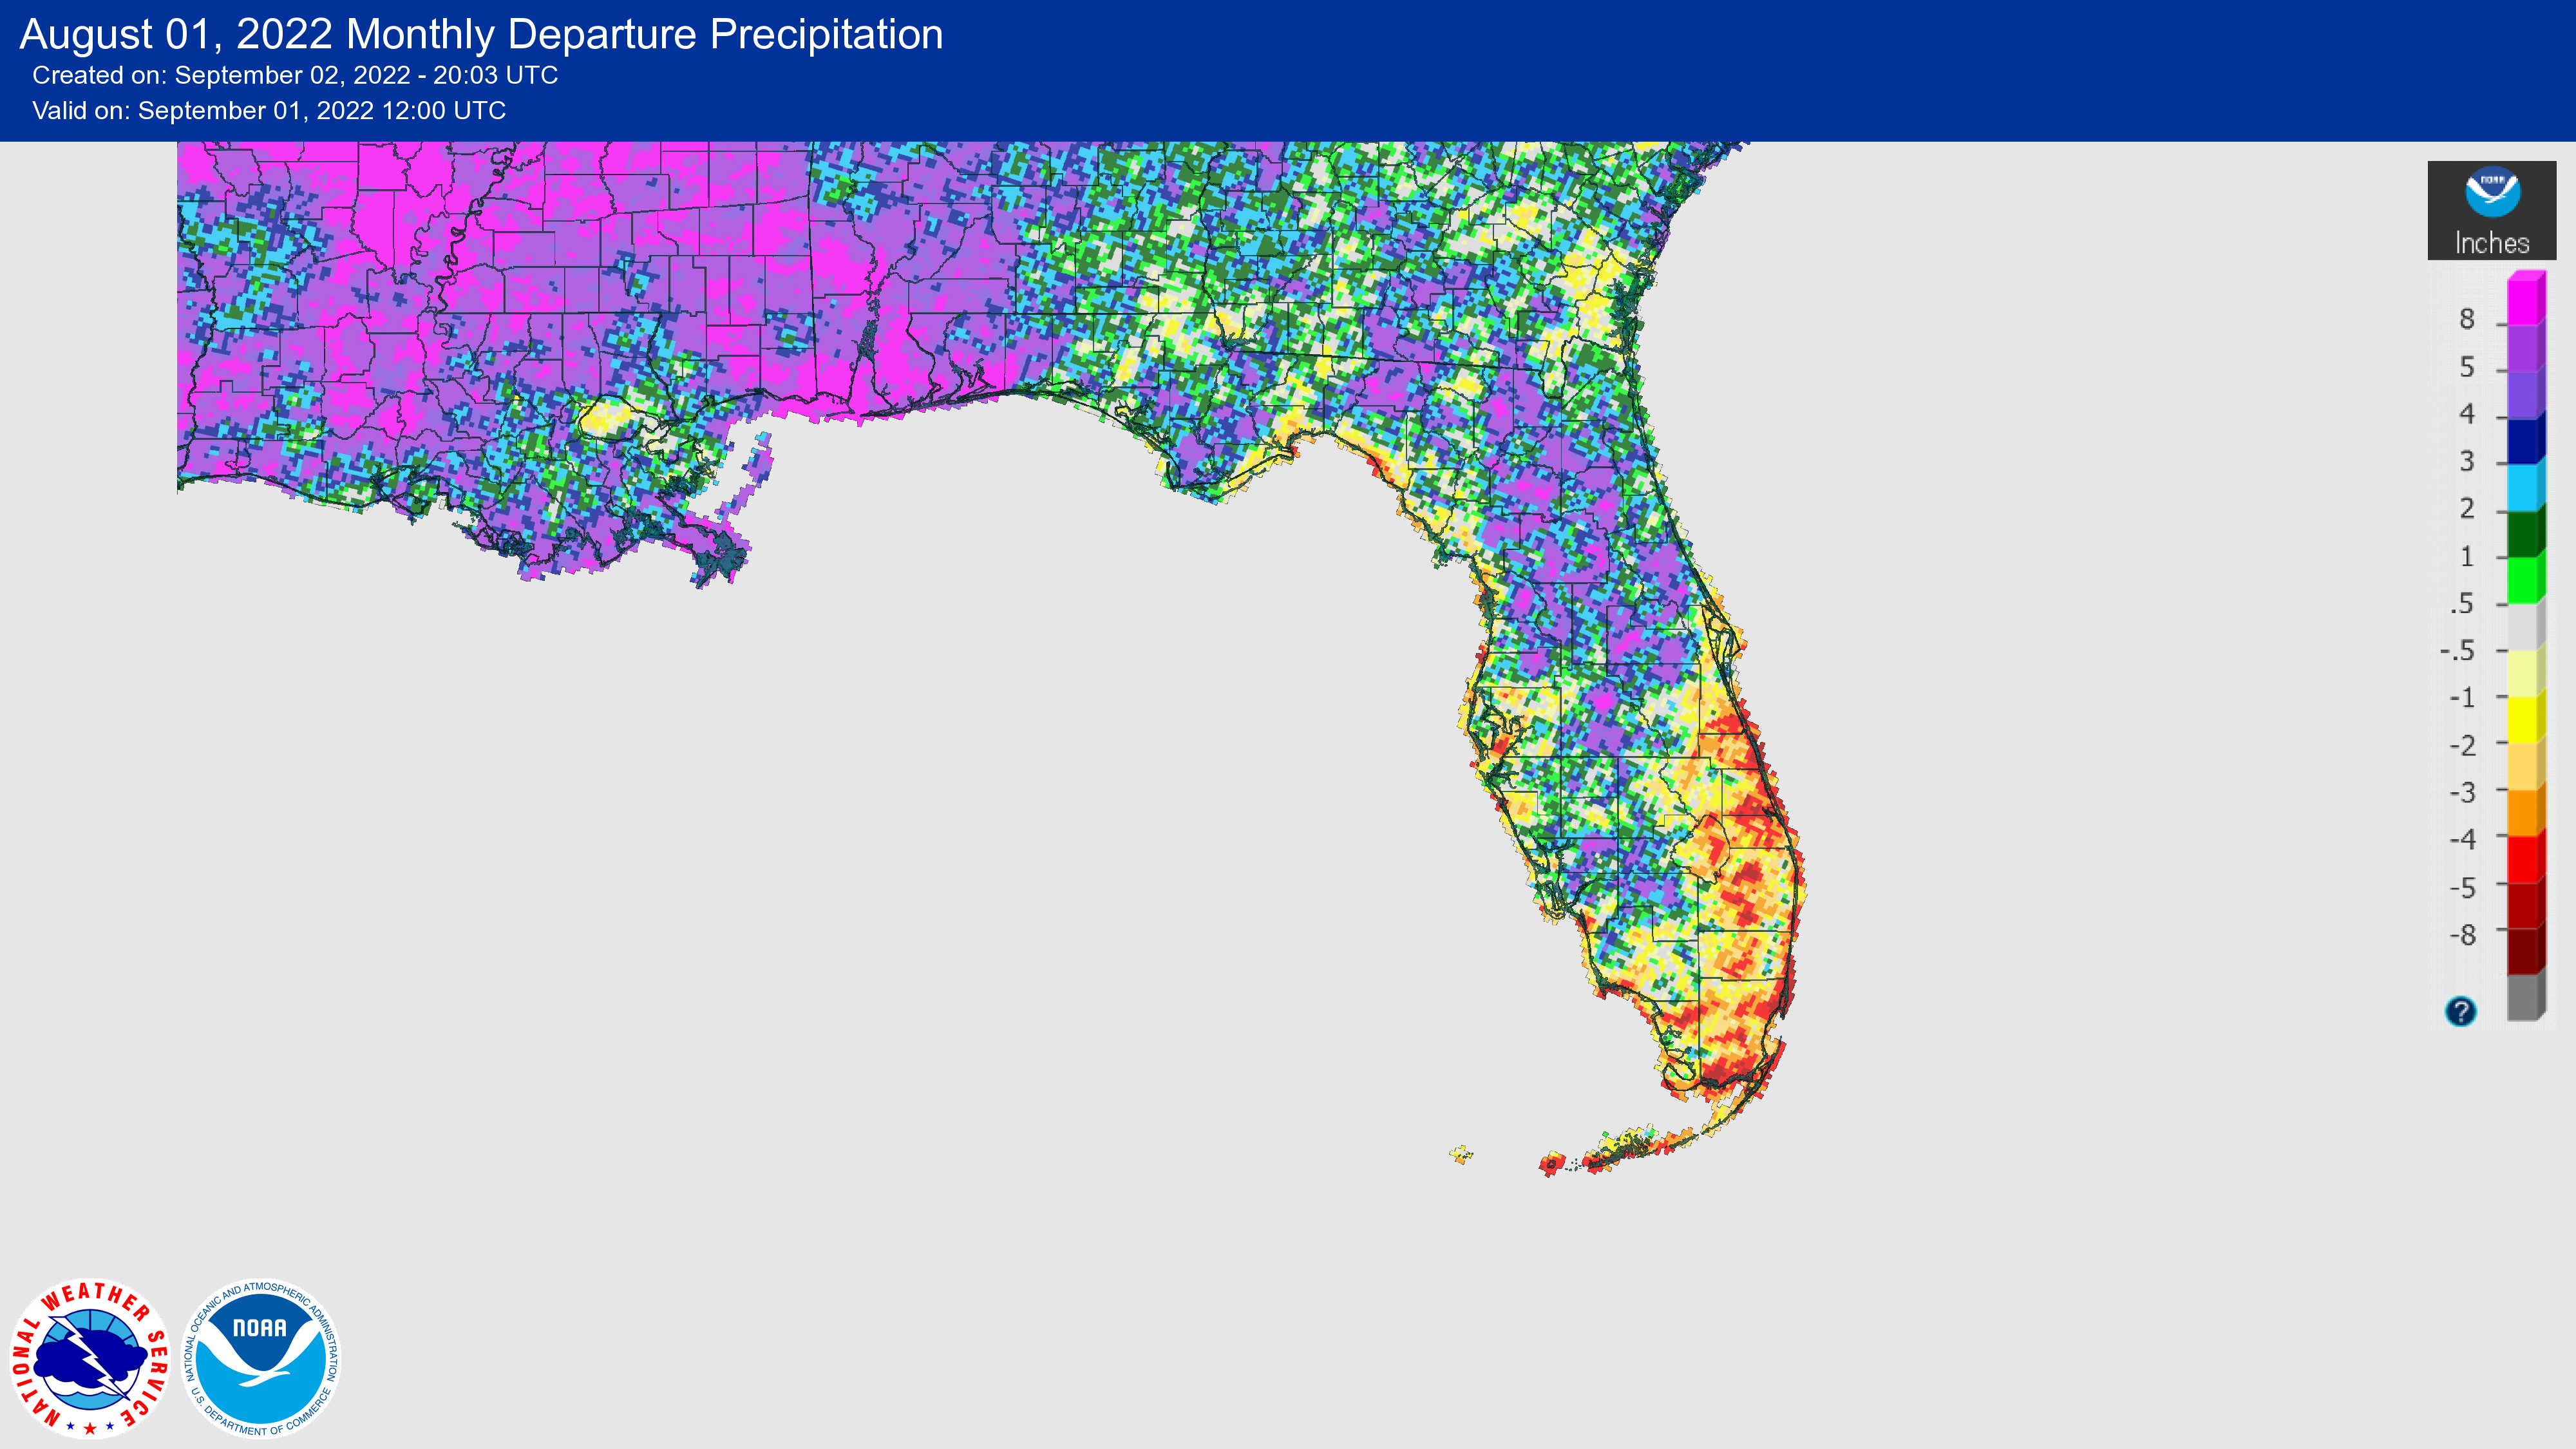
Rainfall totals in August were above normal across north Florida and below normal in central and south Florida. The monthly precipitation departures from normal ranged from -5.56 inches in West Palm Beach to +5.33 inches in Gainesville (Table 2 and Appendix 1). The pattern of unsettled weather continued in August across the Panhandle, with ample rain falling across much of northern Florida. Pensacola set a new daily rainfall record of 4.59 inches on the 11th (39% of its monthly rainfall total). The annual rainfall surplus to date is 10.2 inches in Pensacola, 8.0 inches in Tallahassee, and 9.6 inches in Gainesville. While thunderstorm activity picked up across the Florida Peninsula during the month, some areas continue to see below normal rainfall, especially in southeastern Florida. Year-to-date rainfall deficits include: 12.0 inches in Vero Beach, 13.2 inches in Stuart, 11.4 inches in West Palm Beach, and 5.2 inches in Orlando and Miami.
Table 2. August precipitation totals and departures from normal (inches) for selected cities.
| Station | Total Rainfall | Departure from Normal |
| Pensacola | 11.76 | +4.26 |
| Tallahassee | 8.47 | +0.87 |
| Jacksonville | 10.40 | +3.52 |
| Orlando | 7.88 | +0.19 |
| Tampa | 6.51 | +2.52 |
| Miami | 5.17 | -4.41 |
| Key West | 2.33 | -3.04 |
Figure 1. A graphical depiction of the monthly rainfall departure from normal (inches) for August (courtesy of NOAA, NWS).
La Niña Advisory.
La Niña is expected to continue through the winter, with chances decreasing to 60% during December-February 2022-23. Below average sea surface temperatures expanded across the central-eastern equatorial Pacific Ocean during the past month, and overall the coupled ocean-atmosphere system remained consistent with an ongoing La Niña. Looking ahead, La Niña is projected to be the most likely outcome during fall and winter, while most models suggest a transition to ENSO-neutral conditions in January-March 2023, though much uncertainty remains that far out.
Hazardous Weather Events in August.
According to the Local Storm Reports issued by the local National Weather Service offices serving Florida, there were 432 individual local reports of hazardous weather events recorded across the state during the month of August (see Table 4 for a breakdown by event type). Thunderstorms and locally heavy rainfall occurred throughout the month, with many locations reporting 3-5 inches of daily rainfall. Reports of 5.26 inches and 6.45 inches of rain in 2 hours were reported on the 14th in Gadsden County. Several waterspouts were reported, as well as two tornadoes, during the month.
Table 4. Breakdown of storm reports submitted in Florida during the month of August (compiled from Iowa State University/Iowa Environmental Mesonet).
| Report Type | Number of Reports |
| Flash Flood | 5 |
| Heavy Rain | 55 |
| Flood | 28 |
| Hail | 41 |
| Lightning | 20 |
| Marine Thunderstorm Wind | 60 |
| Non-Thunderstorm Wind Gust | 11 |
| Non-Thunderstorm Wind Damage | 0 |
| Tornado/Waterspout/Funnel Cloud | 2/28/11 |
| Thunderstorm Wind Damage | 55 |
| Thunderstorm Wind Gust | 115 |
| Wildfire | 1 |
Daily Record Events in August.
Table 5.Summary of daily records broken or set in Florida in August (source: NCEI Daily Weather Records).
| Category | Number of Records |
| Highest daily max. temp. | 42 |
| Highest daily min. temp. | 34 |
| Lowest daily max. temp. | 8 |
| Lowest daily min. temp. | 11 |
| Highest daily precipitation | 11 |
| Total | 106 |
Weather/Climate Highlight of the Month.
The tropics remained quiet with no named storms in August. This is the first time since 1997 with no named storms in the Atlantic basin in August, and only the third time since record keeping began.
Drought-Related Impacts.
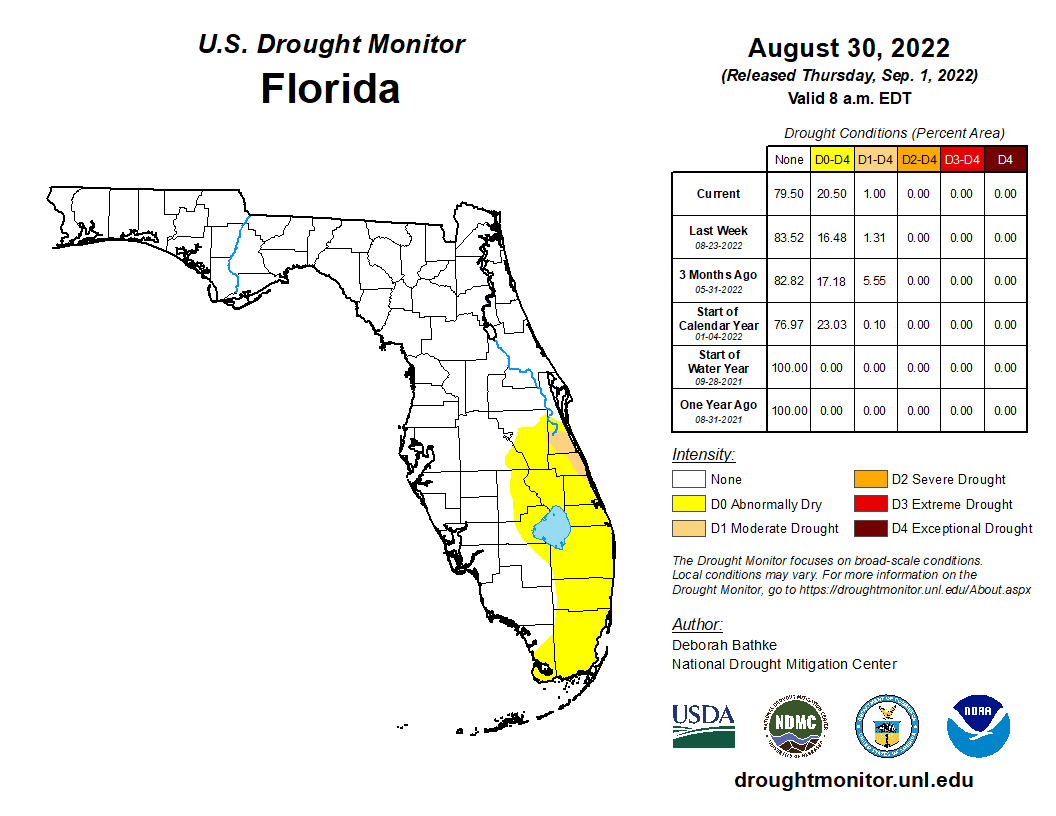
At the beginning of August, small pockets of abnormally dry conditions (D0) impacted parts of the state. As of August 2, approximately 6.7% of the state had abnormally dry conditions, according to the U.S. Drought Monitor. Abnormally dry conditions expanded throughout the month across the eastern Florida Peninsula and southeast Florida and a small area of moderate drought (D1) emerged. As of August 30, 19.5% of the state was in abnormally dry conditions and 1% was in moderate drought (Figure 2 below).
As of August 31, the Lake Okeechobee water level was 12.57 ft. above sea level (Feet-NGVD29), which is below average for this time of the year and is approaching water shortage management levels. At the first of the month, the water level was 12.94 ft. above sea level.
Figure 2. A graphical depiction of the current drought conditions in Florida according to the U.S. Drought Monitor (courtesy of the National Drought Mitigation Center, University of Nebraska-Lincoln).
Agriculture-Related Impacts.
In mid-August, topsoil moisture conditions were adequate in 79% of the state, short in 13%, and very short in 3% of the state, while 5% of the state had surplus topsoil moisture conditions. Near the end of August, topsoil moisture had slightly improved with levels adequate in 78% of the state, short in 7%, and very short in 1% of the state; 14% of the state was in surplus. Warm overnight temperatures in South Florida affected some crops during the month, like corn. For more information, consult the Crop Progress and Conditions report, which is published by the USDA's National Agricultural Statistics Service.
Appendix 1
Additional August departures from normal data for select Florida locations (Source: NWS).
| Station | Average Temperature (˚F) | Departure from Normal (˚F) | Total Rainfall (in.) | Departure from Normal (in.) |
| Gainesville | 82.1 | +0.8 | 11.73 | +5.33 |
| Sarasota | 82.9 | -0.5 | 8.91 | -0.20 |
| Melbourne | 83.5 | +0.1 | 4.87 | -1.80 |
| Fort Myers | 85.2 | +1.8 | 10.52 | +0.09 |
| West Palm Beach | 85.6 | +2.4 | 3.12 | -5.56 |
Appendix 2
Select daily record high maximum temperatures broken or tied during August (compiled from NOAA).
| Location | Date | Record (˚F) | Broken/Tied | Last |
| Bradenton | 1 | 96 | Broken | 95 in 2010 |
| Plant City | 1 | 99 | Broken | 98 in 1961 |
| Orlando | 1 | 98 | Broken | 97 in 2010 |
| Key West | 1 | 96 | Broken | 94 in 2021 |
| Clermont | 2 | 99 | Broken | 97 in 2016 |
| Plant City | 2 | 100 | Broken | 97 in 2020 |
| Miles City | 2 | 97 | Tied | 97 in 2006 |
| Tampa | 2 | 96 | Broken | 95 in 2005 |
| Clermont | 3 | 99 | Broken | 97 in 2016 |
| Plant City | 3 | 100 | Broken | 96 in 2020 |
| Key West | 3 | 96 | Broken | 94 in 2021 |
| Plant City | 4 | 99 | Broken | 98 in 1899 |
| Key West | 4 | 96 | Broken | 94 in 2020 |
| Clermont | 5 | 98 | Broken | 97 in 1972 |
| Tampa | 5 | 96 | Broken | 95 in 1993 |
| Key West | 5 | 95 | Tied | 95 in 2011 |
| Tampa | 6 | 95 | Tied | 95 in 1987 |
| Key West | 6 | 95 | Broken | 94 in 2019 |
| Plant City | 7 | 98 | Tied | 98 in 2021 |
| Tarpon Springs | 7 | 97 | Broken | 96 in 2017 |
| Jacksonville Beach | 16 | 97 | Broken | 95 in 2020 |
| Vero Beach | 16 | 96 | Tied | 96 in 1945 |
| Clermont | 17 | 98 | Tied | 98 in 1951 |
| Miami | 17 | 96 | Broken | 95 in 1991 |
| Vero Beach | 17 | 98 | Broken | 95 in 1987 |
| Key West | 17 | 95 | Broken | 94 in 2020 |
| Vero Beach | 18 | 96 | Broken | 94 in 1984 |
| Plant City | 18 | 99 | Broken | 98 in 1896 |
| Miami | 18 | 96 | Broken | 95 in 2017 |
| Fort Lauderdale | 19 | 95 | Broken | 93 in 1964 |
| Tampa | 20 | 97 | Broken | 96 in 2007 |
| Gainesville | 20 | 95 | Tied | 95 in 2021 |
| Fort Myers | 20 | 98 | Tied | 98 in 1987 |
| Key West | 20 | 97 | Broken | 95 in 2010 |
| Clermont | 21 | 99 | Broken | 98 in 2021 |
| Key West | 21 | 97 | Broken | 93 in 2021 |
| Plant City | 23 | 100 | Broken | 98 in 2021 |
| Key West | 23 | 95 | Broken | 94 in 2020 |
| Key West | 24 | 96 | Broken | 94 in 2021 |
| Plant City | 26 | 99 | Broken | 97 in 1914 |
| Key West | 26 | 96 | Broken | 94 in 2007 |
| Key West | 30 | 95 | Broken | 93 in 2020 |
| Plant City | 31 | 100 | Tied | 100 in 2017 |
Building A, Suite 292
Tallahassee, FL 32306-2741
Phone: (850) 644-3417 | (850) 644-0719
climate@coaps.fsu.edu