


The Florida Climate Center serves as the primary resource for climate data, information, and services in the state of Florida.

The Florida Climate Center achieves its mission by providing climate monitoring, research, and expertise to be applied by the people, institutions, and businesses of Florida and the surrounding region.
We provide direct service by fulfilling requests for climate and weather data and information in a variety of formats.
We perform research that advances the understanding of the climate variability and changes of Florida and the surrounding region.
We provide outreach in presentations and at events aimed at a variety of groups, interests, and ages.
Prepared by Melissa Griffin and David F. Zierden.
Special thanks to Lauren Zuromski.
Florida Climate Center
The Florida State University
Tallahassee, FL

Disclaimer: Due to the Government Shutdown of 2013, certain data was not available for use in the October Climate Summary. This summary may be updated once data becomes available. We apologize for any inconvenience. Thank you.
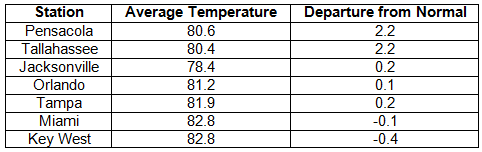
Average temperatures varied across the state in September. Average temperatures varied during September across the entire state (Table 1 and Appendix 1). Departures from normal ranged from -0.4˚F in Key West to 2.2˚F at Pensacola and Tallahassee. Average temperatures for September 2013 were the 8th warmest at Tallahassee and Gainesville, 9th warmest in Pensacola, and 10th warmest in Orlando. The average maximum temperatures were the 5th warmest in Gainesville, and minimum temperatures were the 3rd warmest on record at St. Petersburg. At the time of press, there were only a number of record temperatures that were available from September (Appendix 2).
Table 1: September average temperatures and departures from normal (°F) for selected cities.
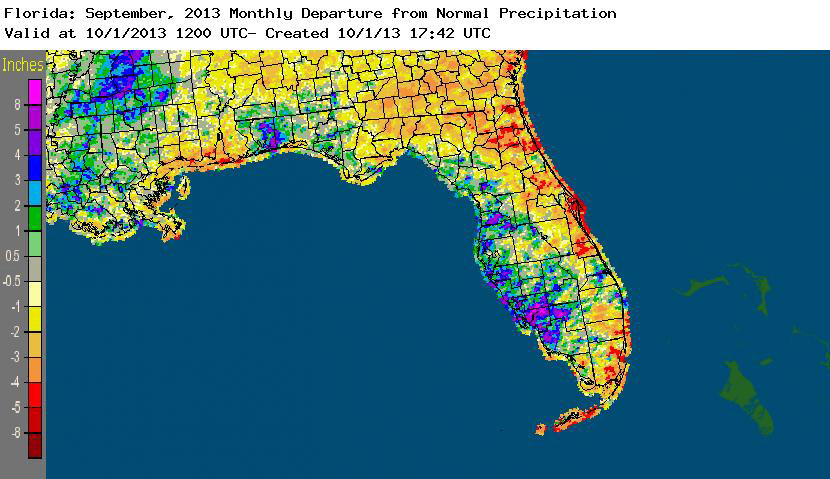
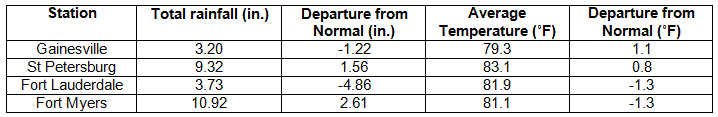
Rainfall totals varied across the state in September. Rainfall totals across the state varied in September (Table 2). Since the unusual heavy rains this summer that removed drought in the state, precipitation across the state has been closer to normal at most locations. However, rainfall totals along the East Coast (from Jacksonville to the Space Coast and from West Palm Beach to the Keys) were up to 5” below normal (Figure 1). On the opposite coast, areas from Hernando to Collier counties reported rainfall totals over 8” inches above normal. Santa Rosa and Walton counties in the Panhandle also reported above normal rainfall for September. At the time of press, there were only a number of precipitation records that were available from September (Table 3).
Table 2: September precipitation totals and departures from normal (inches) for selected cities.
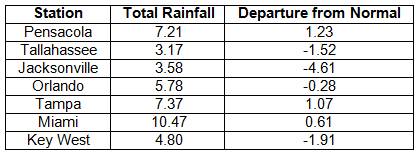
Table 3: Select daily rainfall records (inches) broken during September (compiled from NOAA, NWS).
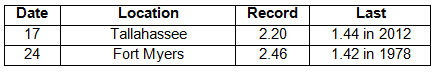
Figure 1: A graphical depiction of the monthly rainfall departure from normal (inches) for September is given in the figure below (courtesy of NOAA, NWS).
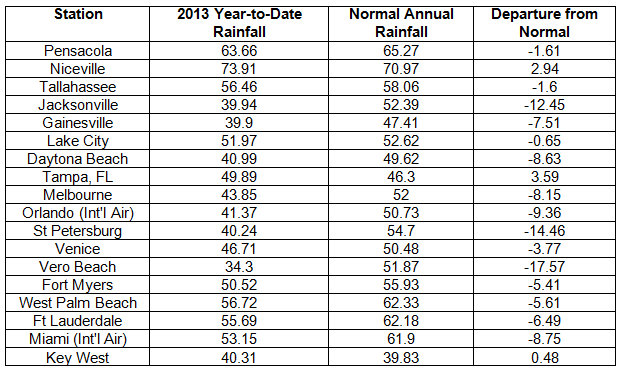
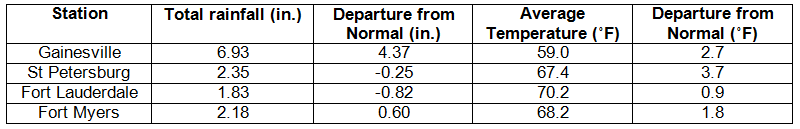
Year-to-Date Rainfall. With the above normal rainfall during the summer of 2013, here are the current year-to-date rainfall totals from select locations around the state, including their departures from the normal annual precipitation total. With the exception of the East Coast of the state, most locations are on pass to have normal to above normal rainfall amounts for 2013. There are three months left in the year and two months left in the 2013 Hurricane Season.
ENSO-neutral conditions continue in the Pacific. Neutral ENSO conditions continue to be reported for the equatorial Pacific with equatorial sea surface temperatures (SST) near average across much of the equatorial Pacific. ENSO-neutral conditions are favored to continue through the winter of 2013-2014. The Climate Prediction Center (CPC) predicts normal precipitation and temperatures through December for the state.
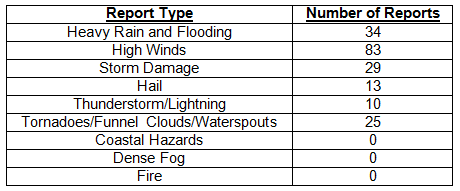
Hazardous weather events in September. There were 194 hazardous weather reports in Florida during September 2013. On September 6th, there were numerous high wind reports between Tampa and Fort Myers, with storm damage in Gainesville with lightning strikes and storm damage and high winds reported in nearby Lakeside. During the same day, flooding was also reported in Orlando. On the 15th, multiple reports of high winds and storm damage were reported in the Tampa area, and hail was reported in Ocala. Reports came in from the general public of a waterspout off the shore of Gifford, Florida. Damage consistent with a very weak EF-0 tornado was observed in Palm Beach County on the 16th; this same day, high winds were reported along the southeastern coast of Florida. On the 17th, heavy rains caused sporadic flooding in Naples, Panama City Beach, and Jupiter, Florida. From the 23rd through the 25th, tropic moisture from the Gulf of Mexico flowed onshore into portions of the western Florida peninsula, bringing heavy rains and flooding in and around the area of Brooksville, FL. The month was closed out by a few purely ornamental waterspouts putting on a show for tourists along the lower Keys.
Table 4: Breakdown of storm reports submitted in Florida during the month of September (compiled from Southeast Regional Climate Center).
Agricultural and other climate related impacts. At the beginning of September, roughly 90% topsoil and subsoil moistures levels were adequate to surplus across the state. Escambia and Santa Rosa counties sprayed and harvested peanuts, while there were reports of white mold on peanuts in Suwannee County. Hay was being cut in Gulf, Walton, Dixie, Pasco and Levy counties, and pasture conditions ranged from fair to excellent statewide. There were still some pastures that had standing water from the excessive summer rains, and horses in Dixie County showed signs of colic and thrush. Toward the middle of the month, many counties were waiting on dry days to bale hay that had been cut earlier in the month. Cotton boils opened (no defoliation), corn and snap bean harvesting continued, and sugarcane was planted. Wet conditions led to delays in field preparation and planting in Southwest Florida. The impact of the summer rains continued to show, from limited forage conditions to calves not gaining weight due to the lack of nutrients in pastures. The hay that was baled was of poor quality. However, the citrus area remained drought free, and grove activities (resetting trees, herbicide application, and brush removal) continued throughout the month. By the end of the month, greens, tomatoes, strawberries and cabbage were actively being planted, while hay and peanuts were harvested. Land preparation for winter crops and forage started across the state.
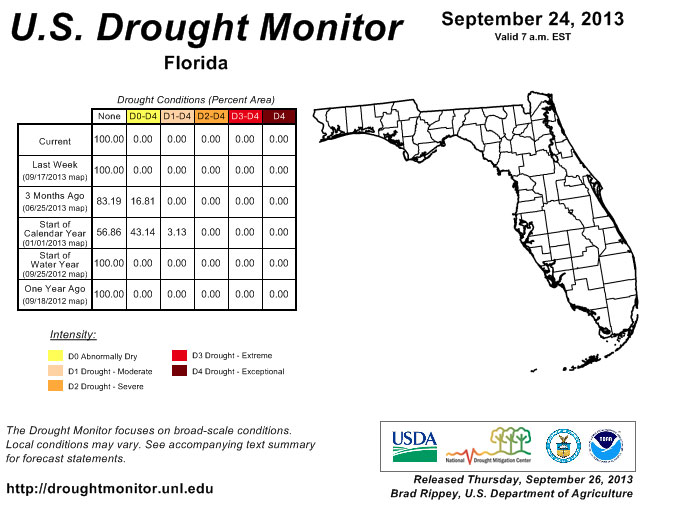
Despite below normal rainfall in portions of the state during September (Figure 1), the entire state remained drought free since July 9th. Normal rainfall totals in October and November are typically lower for the state; however, there are still two months left in the 2013 Hurricane Season. The potential for a late season storm impacting the state cannot be ruled out, especially with the recent activity in the Caribbean Sea. Lake Okeechobee remains at maximum capacity, allowed during hurricane season by the Corps, and most of the stream flow gauges across rivers statewide showed normal stream flow activity, though a few gauges in the western Peninsula were above normal due to recent rains.
Figure 2: Drought conditions in Florida as of September 24, 2013 (courtesy of U.S. Drought Monitor).
Appendix 1: Additional September departures from normal data for Florida locations.
Appendix 2: Select daily maximum and minimum temperature records (° F) tied or broken during September (compiled from NOAA, NWS).
Prepared by Melissa Griffin and David F. Zierden. Thanks to L. Zuromski.
Florida Climate Center
The Florida State University
Tallahassee, FL
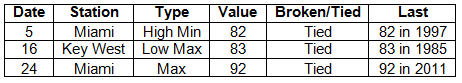
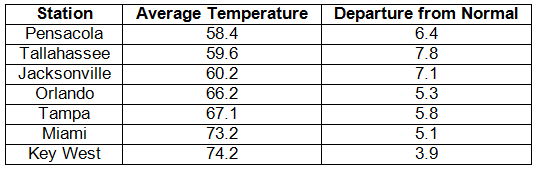
Average temperatures were above normal across the state in January. Average temperatures were well above normal for January across the entire state (Table 1 and Appendix 1). Departures from normal ranged from 3.9˚F at Key West to 7.8˚F in Tallahassee. January 2013 was the 4th warmest on record in Miami and the 8th warmest on record for both Pensacola and Tampa. A review of the historical rankings of January average temperatures showed that January 1937 and January 1974 were the warmest Januarys on record at most locations. Multiple maximum temperature or high minimum temperature records were either tied or broken (Appendix 2); there were no record minimum or low maximum temperatures tied or broken in January.
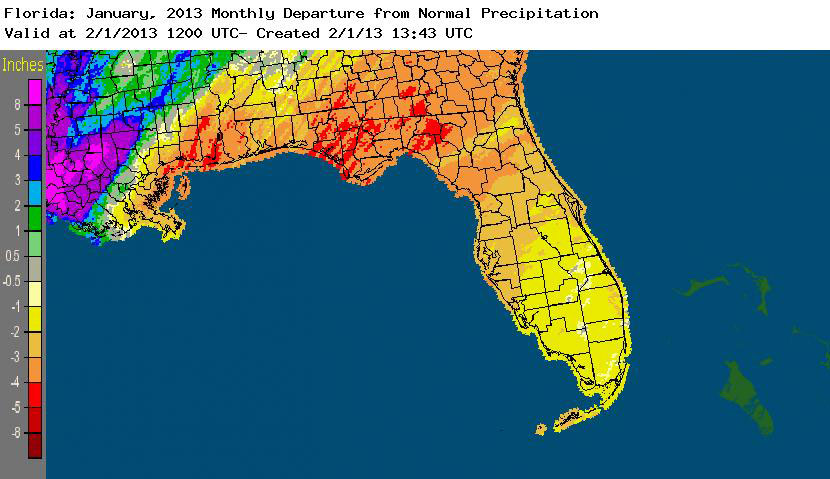
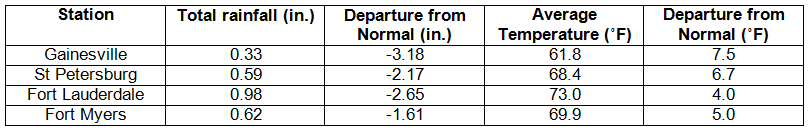
Rainfall totals were below normal across the state in January. Rainfall totals across the state were below normal in January (Table 2), with the northern part of the state reporting 3 to 5 inches below normal rainfall, while portions of the peninsula and south Florida were 1 to 3 inches below normal precipitation (Figure 1). January 2013 was the 5th driest on record for Gainesville and the 8th driest on record for both Orlando and Tallahassee. Only a few precipitation records were broken in January (Table 3), and only one of those records was for a rainfall total over 0.50”. The below normal rainfall has already raised concerns for the upcoming wildfire season and worsening drought conditions across the state.
Table 2: January precipitation totals and departures from normal (inches) for selected cities.
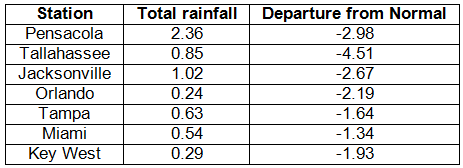
Table 3: Select daily rainfall records (inches) broken during January (compiled from NOAA, NWS).
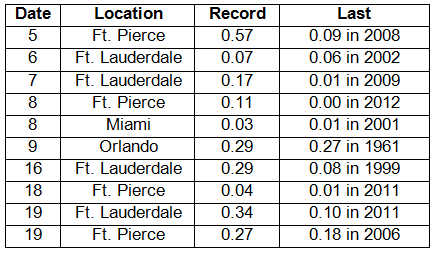
Figure 1: A graphical depiction of the monthly rainfall departure from normal (inches) for January is given in the figure below (courtesy of NOAA, NWS).
ENSO-neutral conditions continue in the Pacific. As of January 29th, neutral ENSO conditions continue to be reported for the equatorial Pacific. Equatorial sea surface temperatures (SST) are near average to below average across the Pacific Ocean. ENSO-neutral conditions are expected to continue through the spring 2013. The Climate Prediction Center (CPC) predicts normal temperatures for the state, and they are also predicting below normal precipitation in the western Panhandle and north Florida through April.
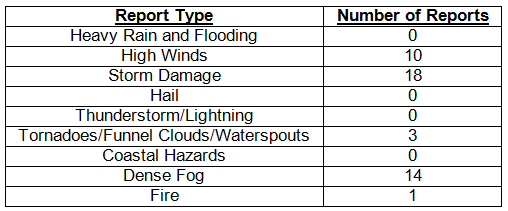
Hazardous weather events in January. January was a fairly quite month for severe weather across the state with only 46 severe weather reports. Areas south and southwest of Lake Okeechobee saw numerous days during the beginning of the month with dense fog, especially along portions of Alligator Alley, where visibilities were reduced to less than ¼ of a mile. On the 12th, a brush wildfire near Port Saint John in Brevard County burned over 1,000 acres and caused some road closures. Most of the severe weather reports for the month were made during the 29th and 30th as a vigorous cold front moved through the state. Multiple reports of storm damage (downed power lines and trees) came in from various locations along the Panhandle, such as Fort Walton Beach, Chipley, Quincy, and Dowling Park, just to name a few. A waterspout was also reported on the 30th just off the coast of Pensacola Beach, FL. High winds were recorded with the front as it pushed through the northern part of the state. Wind gusts ranged from 42mph reported at Fernandina Beach to 66mph recorded at Tyndall Air Force Base near Panama City Beach, FL.
Table 4: Breakdown of storm reports submitted in Florida during the month of January (compiled from Southeast Regional Climate Center).
Agricultural and other climate-related impacts. Winter crops did well despite the slow start to the season due to lack of rain. Sugar cane harvesting continued through January, and areas of the state began preparations for spring planting. The warm weather at the beginning of the month caused some trees/plants to start budding early, such as mangoes, avocadoes, peaches, and pecans, while the strawberry crop thrived in the warm temperatures. Many fruit trees needed more chill hours to produce good yields. During the month, there were a few nights where lows were near/below freezing, but fruit and tree damage was either light or avoided. The sparse rainfall worsened conditions in citrus producing areas and limited the growth and production of winter forage.
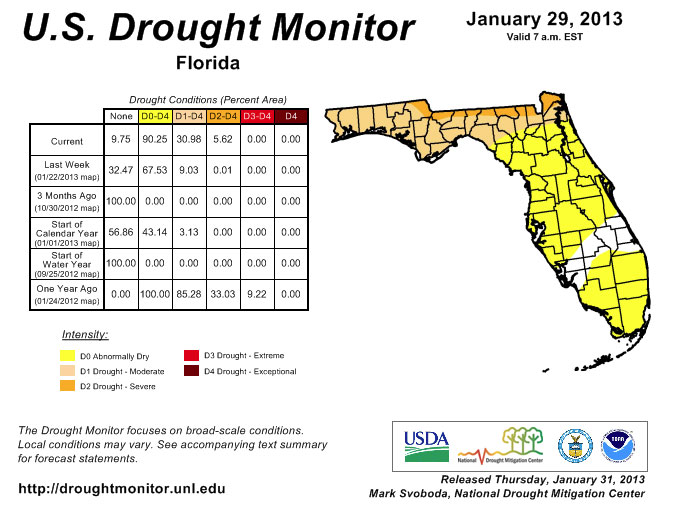
Statewide rainfall totals were roughly 25% of normal over the last few weeks, causing negative effects on drought conditions in the state. Many rivers across the state are reporting below average stream flow levels. Winter is an important recharge season for portions of north Florida (Panhandle and the north part of the peninsula), while south Florida is typically dry during the season. Due to the below normal rainfall totals, the area of dry/drought coverage expanded from about 43% on December 25th to roughly 90% as of the January 29th release of the Drought Monitor. The biggest changes were seen in the Panhandle and especially along the state lines between Florida and Alabama/Georgia. Most of the area north of a line from the Steinhatchee Conservation Area to St. Augustine is listed as having moderate drought conditions (D1), while along the state line, conditions are worse with severe drought conditions (D2). The peninsula has not escaped the deteriorating conditions either. Only a few counties (Charlotte, Lee, Glades, Highlands, Okeechobee, Indian River, St. Lucie and Martin) still have areas that are not listed as experiencing dry conditions.
Figure 2: Drought conditions in Florida as of January 29, 2013 (courtesy of U.S. Drought Monitor).
Appendix 1: Additional January departures from normal data for Florida locations.
Appendix 2: Select daily maximum and minimum temperature records (° F) tied or broken during January (compiled from NOAA, NWS).
Prepared by Melissa Griffin and David F. Zierden
Thanks to L. Zuromski
Florida Climate Center
The Florida State University
Tallahassee, FL
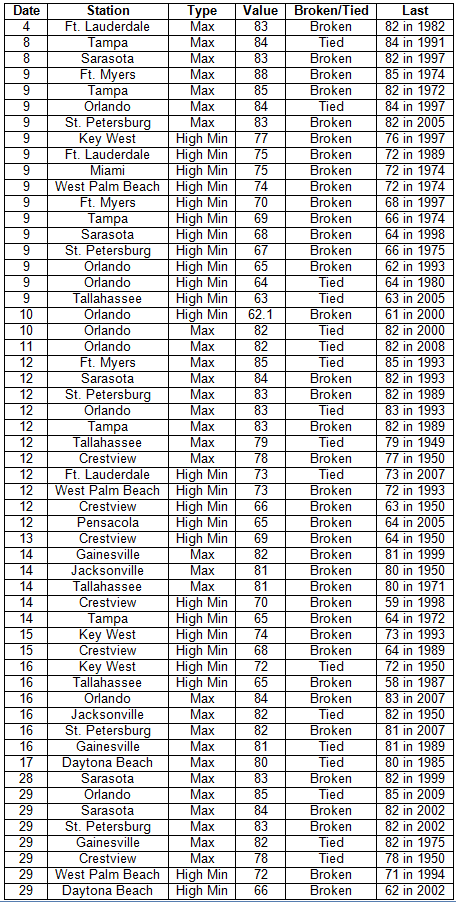
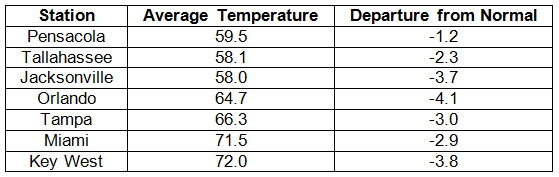
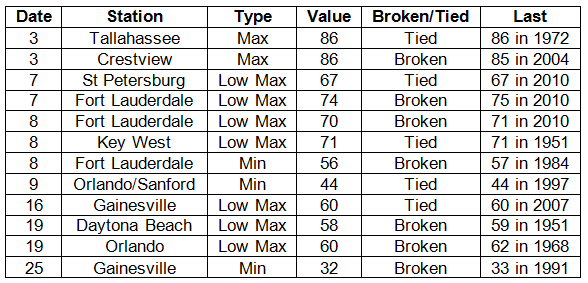
Average temperatures were below normal across the state in November. Average temperatures were below normal for November across the entire state (Table 1 and Appendix 1). Departures from normal ranged from -4.2˚F at Fort Lauderdale to -1.2˚F in Pensacola. While temperatures were cooler than normal, none of the monthly averages were within the top 10 coldest Novembers on record (at each specific location). Most of the coldest Novembers in the state happened during the 1970s. Multiple temperature records were either tied or broken (Appendix 2); however, only 2 of those records were for maximum temperatures, and those both occurred on the 3rd of the month.
Table 1: November average temperatures and departures from normal (° F) for selected cities.
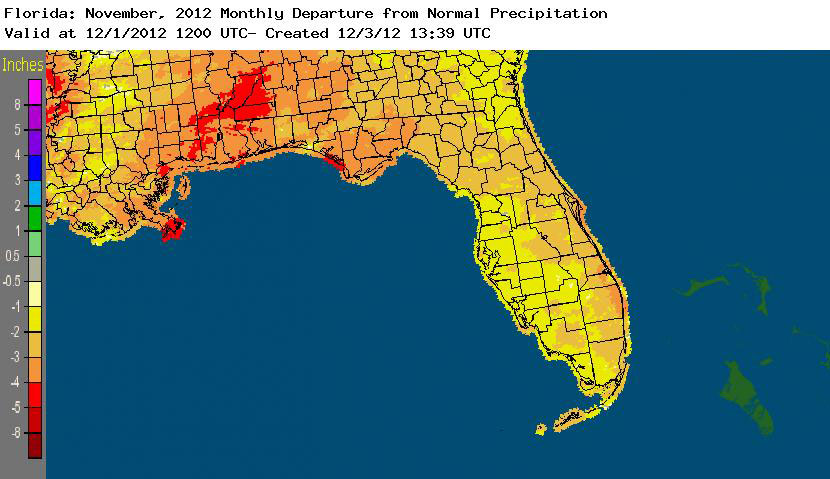
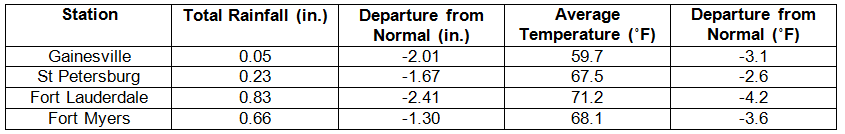
Rainfall totals were below normal across the state in November. Rainfall totals across the state were well below normal this month (Table 2), with departures ranging from -1.46” at Tampa to -3.52” in Tallahassee. The late fall to early spring is typically the second wet season for the northern part of the state, and rainfall totals from November reflect the lack of these ‘winter rains’. November 2012 was the 4th driest November on record at Tallahassee. The dry conditions across the state (Figure 1), especially in the Panhandle and northeast Florida, prompted the National Drought Monitor to reintroduce drought designations for portions of the state. Due to the fact there were only 9 precipitation records broken in November, and only one of them was over 0.50”, they will not be highlighted this month.
Table 2: November precipitation totals and departures from normal (inches) for selected cities.
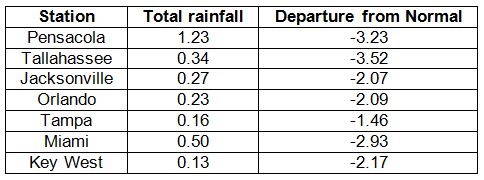
Figure 1: A graphical depiction of the monthly rainfall departure from normal (inches) for November is given in the figure below (courtesy of NOAA, NWS).
ENSO-neutral conditions continue in the Pacific. As of November 26th, the Climate Prediction Center (CPC) has discontinued the El Niño Watch they issued earlier this year as neutral ENSO conditions continue to be reported for the equatorial Pacific. Equatorial sea surface temperatures (SST) are above average across much of the Pacific Ocean. ENSO-neutral conditions are expected to continue through the winter of 2012-2013. The Climate Prediction Center (CPC) predicts normal temperatures for the northern part of the state and below normal temperatures for the peninsula; they are also predicting above normal precipitation in the western Panhandle and north Florida through February.
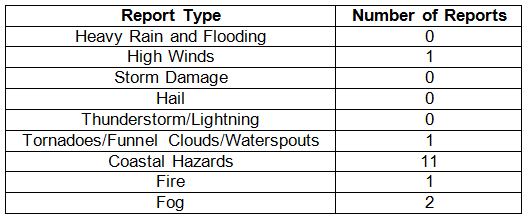
Hazardous weather events in November. November was an extremely quiet month for severe weather across the state with only 16 severe weather reports. Dense fog was reported by law enforcement officials at the Seminole Indian Reservation in Collier County, as well as other locations in Collier County, during the early morning hours of November 4th. Astronomically high tides were recorded along the northeast coast, from the Florida/Georgia line to St. Augustine, from November 14 to 17. Tides were reported between 0.5’ and 1’ above normal tide levels. Visibility was reported at .25 mile at the Naples Municipal Airport, while other parts of the county had zero visibility. On the morning of the 17th, a trained NWS spotter saw a waterspout offshore of Pompano Beach, FL. The Forest Service reported a wildfire on Nov 19th near Interstate 10 in Osceola National Forest near the Baker and Columbia county line. By the 21st, the fire had burned about 45 acres.
Table 3: Breakdown of storm reports submitted in Florida during the month of November (compiled from Southeast Regional Climate Center).
Agricultural and other climate-related impacts. At the beginning of the month, good progress was being made with the harvesting of hay, cotton and peanuts across the state. Vegetable producers were preparing fields for planting potatoes. Sugarcane planting/harvesting was on schedule and the citrus region remained drought free. The quantity and quality of grass had declined seasonally, though the majority of pastures across the state were in good condition. Fall calving began and cattle conditions were fair to good. Peanut harvesting was nearly complete and cotton harvesting continued through the middle of the month. The last bit of hay was being cut in some counties before the first frost/freeze of the season could impact the crop. The dry weather pressured pasture and winter grazing establishments, as parts of the Panhandle were unable to plant winter forage due to dry soils. Toward the end of November the dry weather had caused some late cotton bolls to open prematurely in northwestern Florida, while the dry and mild weather proved to be beneficial for vegetable producers. Most pasture conditions were fair to good, though pasture conditions continued to deteriorate in portions of northern Florida.
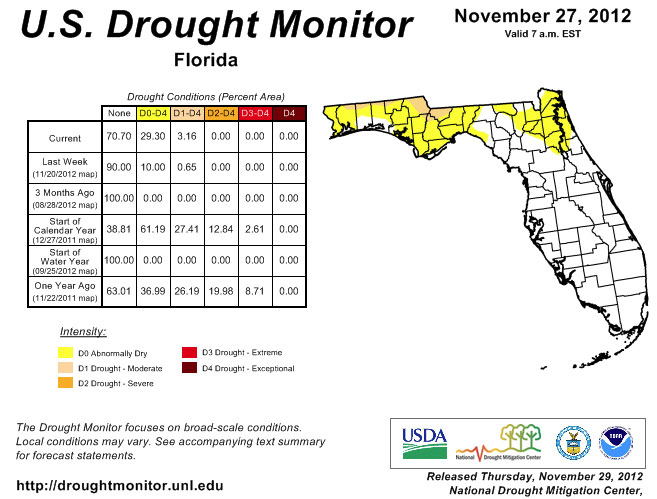
The week after the October Climate Summary was released, the authors of the National Drought Monitor, with insight from a variety of contributors, decided to start adding the ‘dry conditions’ designation back to Florida. After about 2 months of being drought free, parts of northern Leon, Gadsden, Walton, and Holmes counties saw a reintroduction of dry conditions as the drought in Georgia and southeastern Alabama spread across the state line. By the 13th, all of the northern parts of Panhandle counties that share a border with Alabama or Georgia were labeled as dry. And as the dry month persisted, and with little to no rain falling over these already dry areas, moderate drought was introduced back into the state by the end of the month. Portions of central and south Florida remained drought free during November, as the fall and winter months are usual drier than the northern tier of the state.
Figure 2: Drought conditions in Florida as of November 27, 2012 (courtesy of U.S. Drought Monitor).
Appendix 1: Additional November departures from normal data for Florida locations.
Appendix 2: Select daily maximum and minimum temperature records (° F) tied or broken during November (compiled from NOAA, NWS).
Prepared by Melissa Griffin and David F. Zierden
Florida Climate Center
The Florida State University
Tallahassee, FL
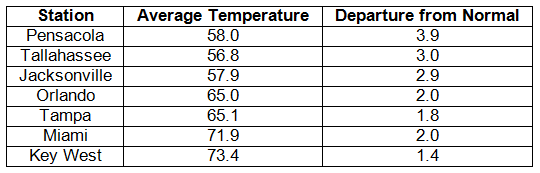
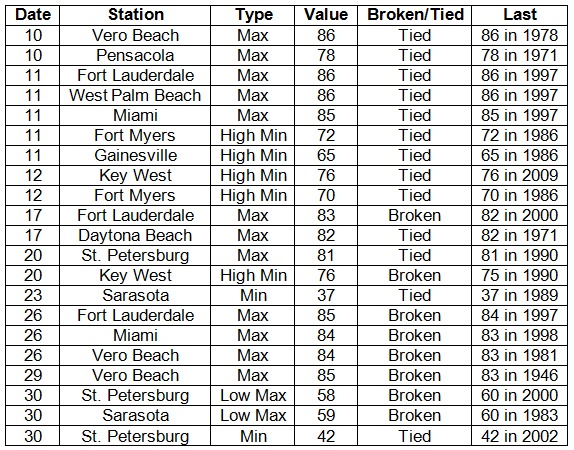
Average temperatures were above normal across the state in December. Average temperatures were well above normal for December across the entire state (Table 1 and Appendix 1). Departures from normal ranged from 0.9˚F at Fort Lauderdale to 3.9˚F in Pensacola. This was the 6th warmest December on record in Pensacola. Multiple temperature records either tied or broken (Appendix 2), with most of those being associated the maximum temperatures.
Table 1: December average temperatures and departures from normal (° F) for selected cities.
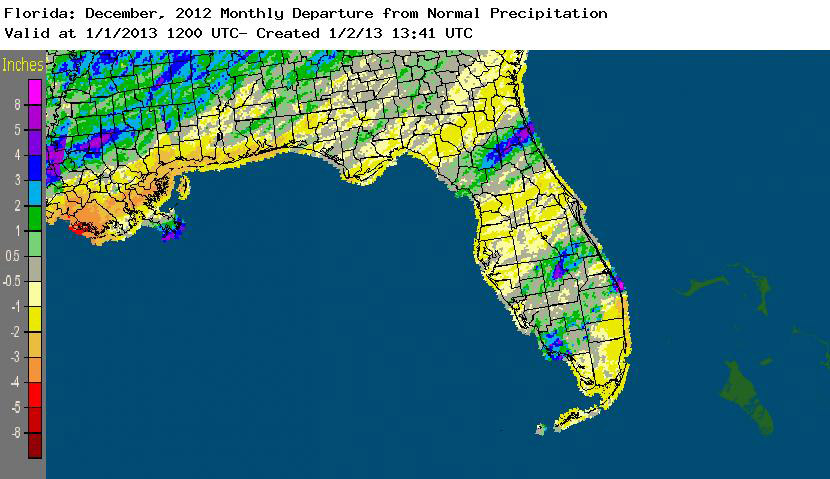
Rainfall totals varied across the state in December. While most of the state recorded below normal rainfall totals for the month (Table 2), some small portions of the state actually had above normal precipitation in December (Figure 1). Coastal portions of Collier County, along with Palm Beach and Martin counties, areas around the northern shore of Lake Okeechobee, and a line from Gainesville to St. Augustine recorded monthly rainfall totals that were more than 2” above normal. However, most of the state saw between 1” and 2” below normal, and December 2012 was the 10th driest December on record in Pensacola.
Table 2: December precipitation totals and departures from normal (inches) for selected cities.
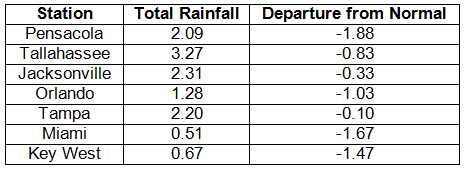
Table 3: Select daily rainfall records (inches) broken during December (compiled from NOAA, NWS).
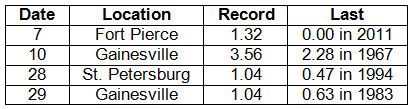
Figure 1: A graphical depiction of the monthly rainfall departure from normal (inches) for December is given in the figure below (courtesy of NOAA, NWS).
ENSO-neutral conditions continue in the Pacific. As of December 30th, the Climate Prediction Center (CPC) reported that ENSO neutral conditions continue for the equatorial Pacific. Equatorial sea surface temperatures (SST) were near average across much of the Pacific Ocean. ENSO-neutral conditions are favored to continue through the winter of 2012-2013 and into spring 2013. CPC predicts above normal temperatures for the state, with above normal precipitation for northern Florida in January, but below normal precipitation in peninsular Florida through March.
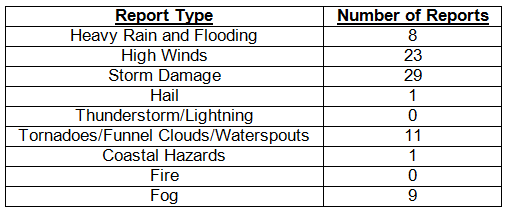
Hazardous weather events in December. December was a quiet month for severe weather across the state with only 81 severe weather reports. Dense fog was reported along coastal portions of Nassau, Duval and St. Johns counties during the early morning hours of December 8th, reducing visibility to less than ¼ mile in some locations. On December 10th, a storm system caused multiple severe weather reports in portions of inland and coastal central Florida. Waterspouts were observed over New Smyrna Beach and Lake Apopka, while a funnel cloud was reported in Lakewood, FL, and a tornado in Edgewater, FL. Areas of Alachua, Marion and Orange counties saw heavy rain and storm damage from the same storm system. Multiple flooding reports were made on the 11th in the Jupiter, FL, area after unofficial rainfall totals measured 3-10” in portions of Palm Beach County. Law enforcement officials in Hendry, Glades and Collier counties reported widespread dense fog on the 13th, with visibilities reduced to ¼ mile. Storms caused damage in portions of the Panhandle on the 17th, with multiple reports of storm damage and wind gusts over 40 mph. A strong cold front moved through the state on the 20th – 22nd, which spawned a tornado near Perry, FL, and caused storm damage across Florida. Trees were knocked down from Freeport to Jacksonville, and high wind reports were made from every portion of the state, with the highest reported wind speed being 45 mph at Shell Point. Another vigorous cold front pushed through the portions of the state on the evening of 25th through the morning of the 26th. The squall line produced a waterspout near Santa Rosa Beach on the 25th, and caused storm damage and high winds as it pushed through north Florida.
Table 4: Breakdown of storm reports submitted in Florida during the month of December (compiled from Southeast Regional Climate Center).
Agricultural and other climate-related impacts. The lack of rainfall at the beginning of the month further depleted the topsoil moisture levels across the state. Some citrus trees were straining to keep the fruit set healthy and growing, and some growers were beginning to irrigate their groves to keep moisture levels from becoming too short. The winter field crops struggled due to the lack of rainfall; however, the above-normal temperatures resulted in good growing conditions for numerous vegetable varieties across the state. Strawberries were already being marketed. By mid-month, some rainfall in central Florida had reduced the need for irrigation for citrus and winter crops, but slowed some of the work in the fields. Other portions of the state still relied heavily on irrigation, as parts of the state were still dry due to the lack of rainfall. However, by the end of the month, two rounds of rainfall boosted soil moisture levels and further eased some of the irrigation demands on Florida agricultural. Some of the storms associated with the two strong cold fronts did cause localized wind damage. The passage of the fronts did bring sub-freezing temperatures to parts of the state and growers prepared to check the damage done to crops. Fruit and vegetable growers continued to market a variety of crops, and orange harvesting continued at a rapid pace.
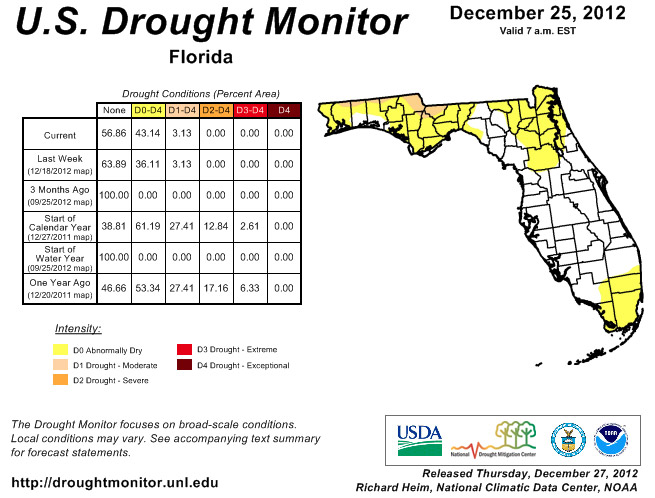
As the dry conditions continued from November, the authors of the National Drought Monitor expanded some of the dry conditions in north Florida by the beginning of the month, to include most of the southwest coast of the state and portions of north central Florida. Mid-December, the dry conditions had been removed from Charlotte, Collier, Glades, Hendry, and Lee counties, though the dryness was kept in Monroe County. The moderate drought conditions along the Florida/Alabama and Florida/Georgia line persisted through the end of the month, while Dade and Broward counties are now reporting dry conditions.
Figure 2: Drought conditions in Florida as of December 25, 2012 (courtesy of U.S. Drought Monitor).
Appendix 1: Additional December departures from normal data for Florida locations.
Appendix 2: Select daily maximum and minimum temperature records (° F) tied or broken during December (compiled from NOAA, NWS).
Prepared by Melissa Griffin and David F. Zierden
Thanks to L. Zuromski
Florida Climate Center
The Florida State University
Tallahassee, FL
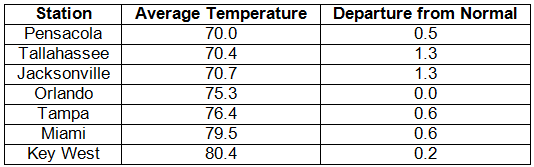
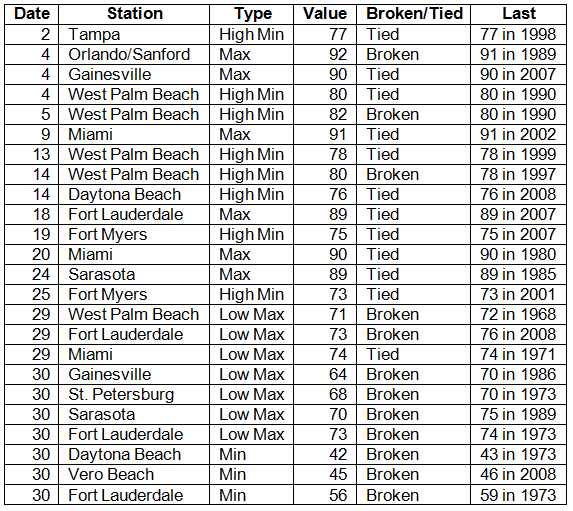
Average temperatures above normal across the state in October. Average temperatures were normal to above normal for October across the entire state (Table 1 and Appendix 1). Departures from normal ranged from 0.0˚F at Orlando to 1.3˚F in Jacksonville and Tallahassee. The average monthly temperatures at the beginning of the month were warmer than normal, but the latter part of the month saw most of the state with colder than normal temperatures. From the 18th-31st, average temperatures ranged from -0.2˚F to -2.6˚F below normal, and for the last week in October (25th-31st) temperatures across many locations in the state were more than -2.0˚F below normal, with average temperatures at Orlando for the week reported at -6.0˚F below normal. Multiple temperature records were either tied or broken (Appendix 2).
Table 1: October average temperatures and departures from normal (° F) for selected cities.
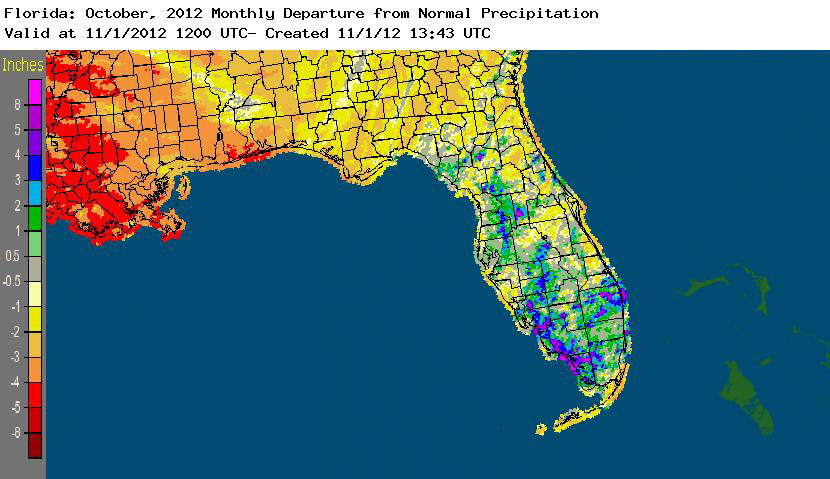
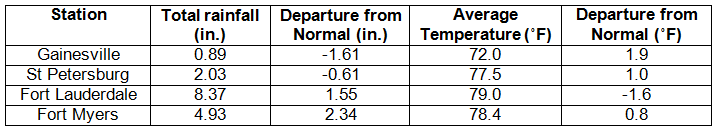
Rainfall totals varied across the state in October. Rainfall totals across the state varied in October (Table 2), with the northern part of the state seeing below normal rainfall, while portions of the interior peninsula and southeastern and southwestern coastal areas seeing above normal precipitation (Figure 1). Only a few precipitation records were broken in October (Table 3). The year to date (01/01/12 to 10/31/12) rainfall total of 85.93” (+32.93”) for Miami puts the 10-month period as the wettest on the 118-year record for the location, and 76.85” (+24.05”) at West Palm Beach is the 3rd wettest 10-month period.
Table 2: October precipitation totals and departures from normal (inches) for selected cities.
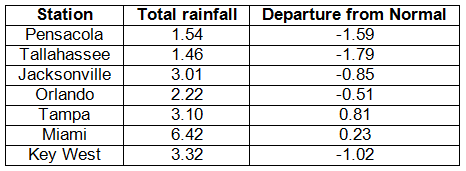
Table 3: Select daily rainfall records (inches) broken during October (compiled from NOAA, NWS).
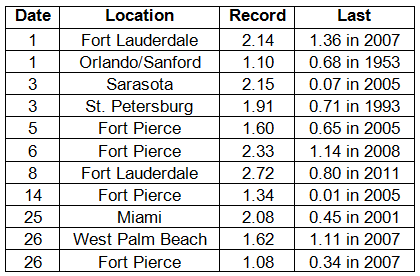
Figure 1: A graphical depiction of the monthly rainfall departure from normal (inches) for October is given in the figure below (courtesy of NOAA, NWS).
ENSO-neutral conditions continue in the Pacific. As of October 29th, neutral ENSO conditions continue to be reported for the equatorial Pacific. Equatorial sea surface temperatures (SST) are greater than 0.5˚C above average across the western and central Pacific Ocean. ENSO-neutral/weak El Nino conditions are expected to continue through the winter of 2012-2013. The Climate Prediction Center (CPC) predicts normal temperatures for the northern part of the state, and below normal temperatures for the peninsula; they are also predicting above normal precipitation in the western Panhandle and north Florida through January.
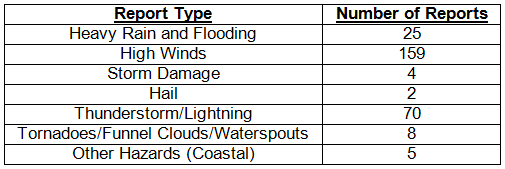
Hazardous weather events in October October was a fairly quiet month for severe weather across the state with only 273 severe weather reports. On October 1st, a man was injured after being struck by lightning in Villano Beach. Hail (0.50") was observed in Palatka, while winds up to 40 knots (46 mph) were reported in the Tampa area on October 4th. The following day, multiple reports of heavy rain were made in Jacksonville and a waterspout was seen offshore of St. Augustine. On October 6th, a waterspout was reported off Sugarloaf Key, and a funnel cloud was reported in Wellington. Heavy rains were observed on the 7th in Okeechobee and in the Jacksonville-Gainesville area (along with numerous reports of storm damage), with hail reported in Gainesville. Flooding and heavy rain was reported in the same areas on the 8th. Between October 14th and 15th, high winds (40 mph) were reported in southern portions of the Keys and high tides were observed on the 15th in southeast Florida. Heavy rain and high winds were reported along portions of the eastern coast from Boynton Beach to St. Augustine on the 17th. Of the 273 severe weather reports for the month of October, 224 of these reports were made from the 25th-31st, which coincides with when Hurricane Sandy, despite being well offshore of the East Coast of Florida, impacted the state. 141 of those reports were categorized as high wind, 15 were of coastal hazards and flooding, and the remaining 68 were thunderstorm hazards. Combined with high tides, waves from Hurricane Sandy battered portions of the East Coast of Florida. Below are some pictures taken by the National Weather Service in Miami of some of the coastal impacts on Fort Lauderdale and Deerfield Beach on October 28th.
Figure 2: Waves from Hurricane Sandy crashing against the pier in Deerfield Beach.
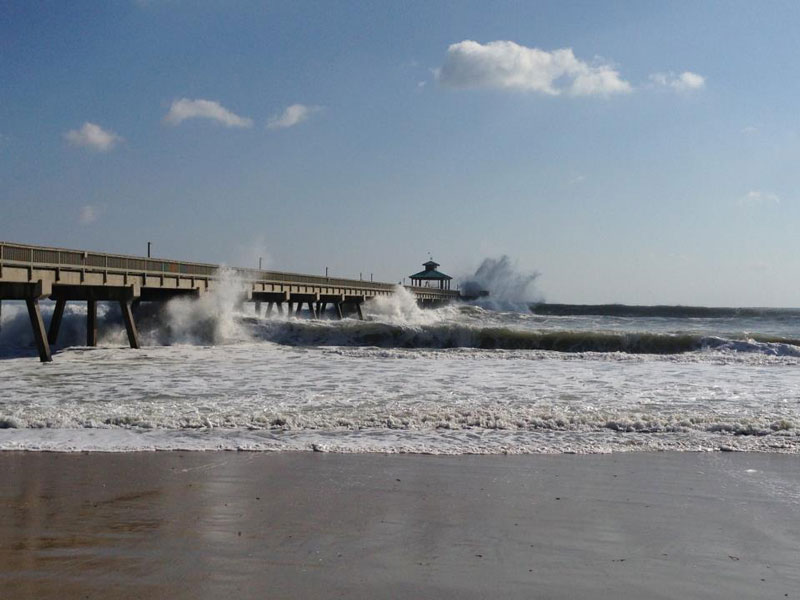
Figure 3: Taken on the morning of October 28th: coastal flooding during high-tide along A1A in Fort Lauderdale Beach.
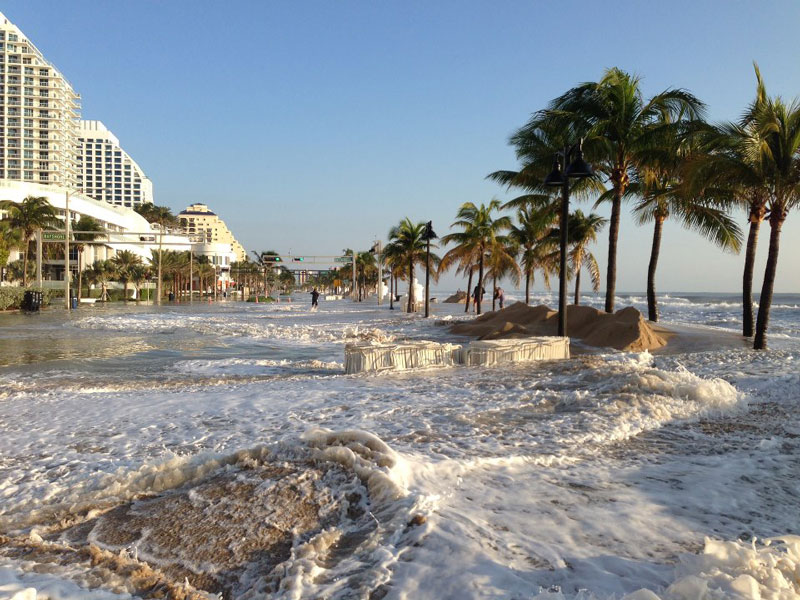
Figure 4: Northbound lanes of A1A in Fort Lauderdale Beach, FL blocked by sand.
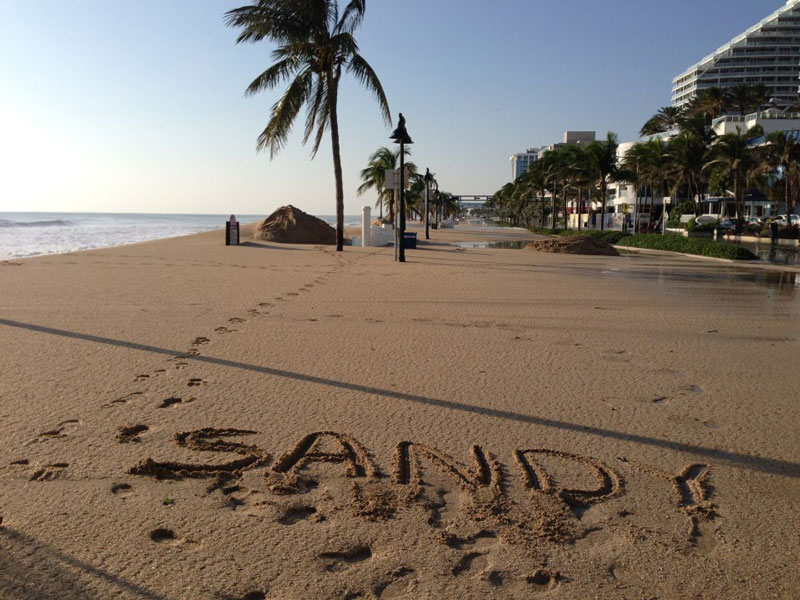
Figure 5: Example of extreme beach erosion caused by large waves from Hurricane Sandy in Fort Lauderdale Beach.
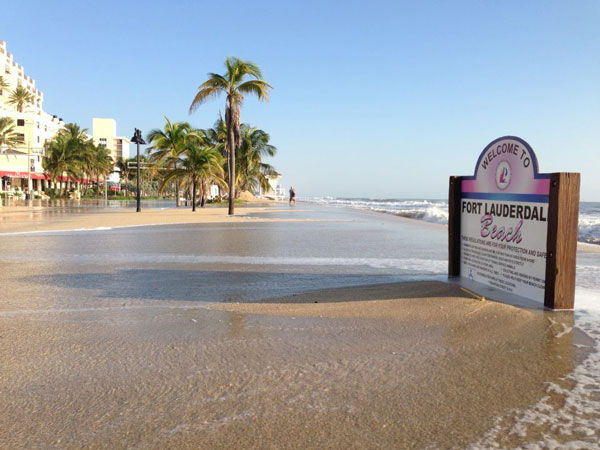
Table 4: Breakdown of storm reports submitted in Florida during the month of October (compiled from Southeast Regional Climate Center).
Agricultural and other climate-related impacts. Sugar cane harvesting began early in Hendry and Glades counties due to anticipated high yields, while wet conditions in Palm Beach County delayed harvesting and replanting. Fall vegetable harvest started in the early part of October and some growers in South Florida began planting winter crops. General grove maintenance continued in central and southern parts of the state. Cattle and pasture conditions ranged from poor to excellent, with most of the conditions being fair to good. By mid month, peanut, cotton, hay and corn harvesting began in Escambia, Gadsden, Jackson, Santa Rosa and Washington counties. Dry conditions at the end of the month aided in the continued harvesting of crops in the Panhandle. All of the hay had been cut in Columbia County, and most of the hay had been cut in Bradford, Highlands and Seminole counties, and Columbia and Suwannee counties began planting winter forage. Pasture conditions are beginning to decline seasonally and growth has slowed. Strawberry planting has begun and processing plants and packinghouses are now open.
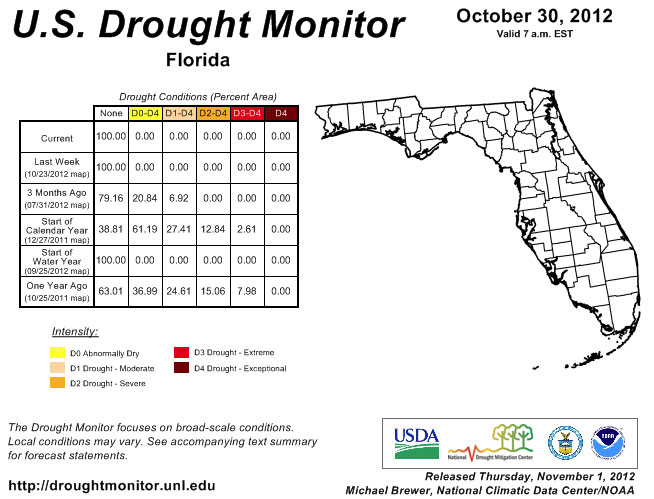
October is typically a dry month for Florida and the observed rainfall varied from below normal to above normal across the state. This was the second month in a row that there was no drought designation in the state. Other areas of the Southeast U.S. saw an expansion of some of the dry conditions, especially in parts of Georgia and South Carolina. Normal rainfall is expected in Florida during the month of November but the recent dry weather has put the state under an increased fire risk for the next few weeks, as we will remain fairly dry over the next month. Despite the dry weather, Lake Okeechobee's level has risen to 15.87 ft, and most of the rivers in the state are reporting normal river levels.
Figure 6: Drought conditions in Florida as of October 30, 2012 (courtesy of U.S. Drought Monitor).
Appendix 1: Additional October departures from normal data for Florida locations.
Appendix 2: Select daily maximum and minimum temperature records (° F) tied or broken during October (compiled from NOAA, NWS).
Building A, Suite 292
Tallahassee, FL 32306-2741
Phone: (850) 644-3417 | (850) 644-0719
climate@coaps.fsu.edu