


The Florida Climate Center serves as the primary resource for climate data, information, and services in the state of Florida.

The Florida Climate Center achieves its mission by providing climate monitoring, research, and expertise to be applied by the people, institutions, and businesses of Florida and the surrounding region.
We provide direct service by fulfilling requests for climate and weather data and information in a variety of formats.
We perform research that advances the understanding of the climate variability and changes of Florida and the surrounding region.
We provide outreach in presentations and at events aimed at a variety of groups, interests, and ages.
Prepared by Melissa Griffin and David F. Zierden. Thanks to A. Griffin and L. Zuromski.
Florida Climate Center
The Florida State University
Tallahassee, FL

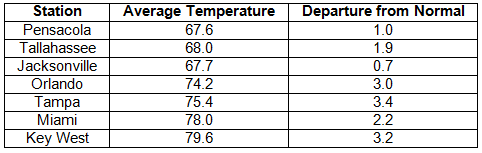
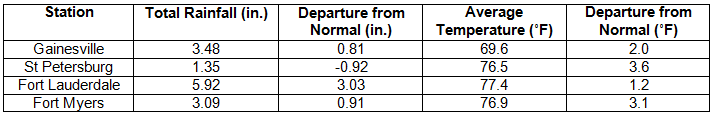
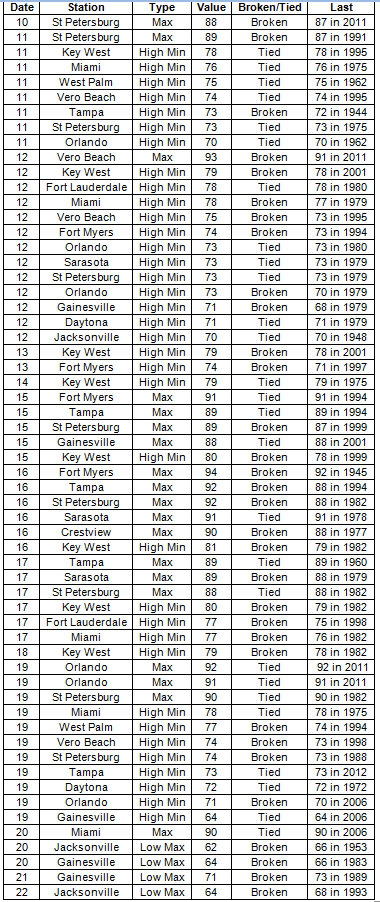
Average temperatures above normal across the state in April. Average temperatures were above normal for April across the entire state (Table 1 and Appendix 1). Departures ranged from +0.7˚F in Jacksonville to +3.6˚F in St. Petersburg. April 2013 was the 7th warmest April in Miami and Tampa. Even though the average temperatures show April as being a warm month, there were some strong cold fronts that moved through the area, and patchy late season frosts were seen in some of the agricultural growing regions of the state. Numerous maximum and high minimum temperature records were broken and tied during the month (Appendix 2), along with a few low maximum temperatures that were broken toward the end of April.
Table 1: April average temperatures and departures from normal (°F) for selected cities.
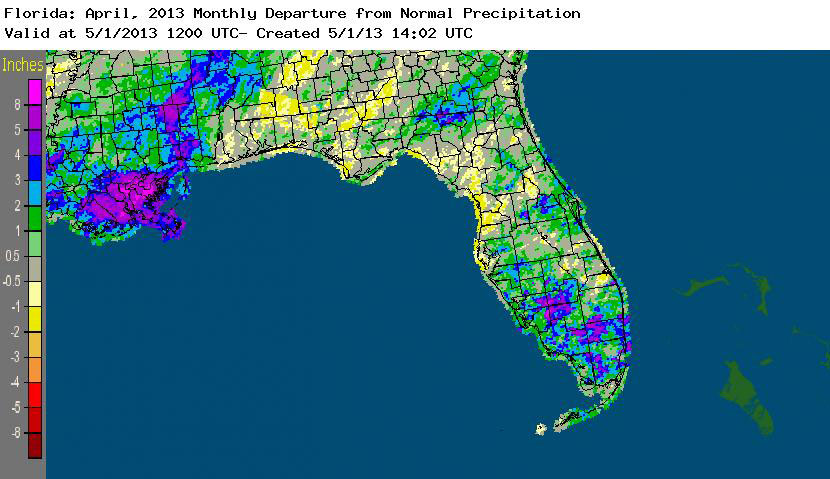
Rainfall totals varied across the state in April. Rainfall totals across the state varied in April (Table 2), though most of the state reported totals that were below normal. Localized portions of the northeast Florida, along the Florida/Georgia state line in Columbia, Hamilton, and Madison counties, recorded above normal rainfall (1 to 5 inches), while locations along the Nature and Sun coasts reported rainfall totals 1 to 2 inches below normal precipitation (Figure 1). There were a few precipitation records broken during April (Table 3), and portions of south Florida saw heavy rainfall and flooding in some of the metropolitan areas during the month. Most of the counties south of Lake Ockeechobee had normal to above normal rainfall, and the lake itself has a level of 13.40 feet, which is down from the high of 16 feet due to some regulatory releases. The 3-month outlooks are forecasting normal rainfall through July, but there is still concern about the lingering drought in the central part of the peninsula.
Table 2: April precipitation totals and departures from normal (inches) for selected cities.
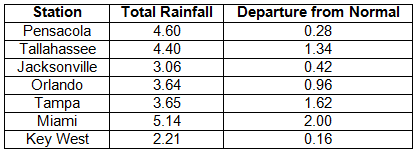
Table 3: Select daily rainfall records (inches) broken during April (compiled from NOAA, NWS).
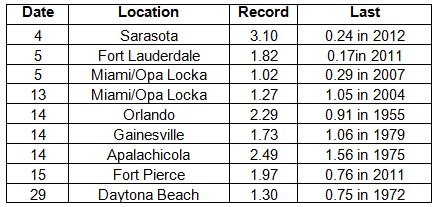
Figure 1: A graphical depiction of the monthly rainfall departure from normal (inches) for April is given in the figure below (courtesy of NOAA, NWS).
ENSO-neutral conditions continue in the Pacific. As of April 1st, neutral ENSO conditions continue to be reported for the equatorial Pacific. Equatorial sea surface temperatures (SST) are near average across much of the Pacific Ocean. ENSO-neutral conditions are favored to continue through the summer 2013. The Climate Prediction Center (CPC) predicts above normal temperatures for the state and they are also predicting normal precipitation for Florida through July.
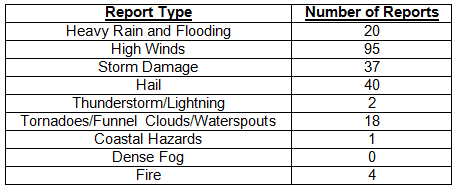
Hazardous weather events in April. April was a fairly active month for severe weather, with 214 storm reports made during the 30-day period. The month started off with six swimmers rescued from strong rip currents near Miramar Beach, FL, a thunderstorm that produced pea to nickel sized hail in the Miami metro area, and wildfire (~1000 acres burned) that was started by lightning near Kennedy Space Center all on April 1st. A low-pressure system in the Gulf of Mexico pushed through the state on April 3rd - 5th, bringing multiple rounds of severe weather associated with both a warm and cold front. Non-thunderstorm related wind gusts over 50 mph were reported along the Florida Panhandle and offshore on the 3rd, while reports of storm damage, hail, high winds were reported along the peninsula during the 4th and 5th. An EF0 tornado was confirmed to have touched down on the south end of Big Pine Key on the 5th. A wildfire that burned more than 400 acres started near Juniper Springs on the 7th. Another strong cold front pushed through the state April 11th – 13th, caused high winds (60 mph gust in Milton, FL) and storm damage in the Panhandle, and heavy rains and flooding to portions of Miami-Dade County. Lightning is believed to be the cause of a house fire in Normandy, FL on the 14th. On the same day, a low-pressure formed in the northern Gulf of Mexico and a warm front lifted across the northern part of the state- and spawned a waterspout that moved on shore and did damage to some homes in Eastpoint, FL. Numerous reports of hail were made in and around the Orlando area, ranging from pea to quarter-sized hail during an hour period on the 14th. Thunderstorm wind gusts of at least 40 mph were record at a variety of stations in the Tampa/St. Petersburg area. In addition, reports of heavy rain, flooding, hail, storm damage and high winds were also made on the 15th from many south Florida locations. A 1600-acre wildfire was reported by the U.S. Forrest Service in Playalinda Beach, FL on the afternoon of the 18th. The 19th and 20th of the month had more reports of high winds in the interior and along the eastern peninsula coast, along with reports of waterspouts and funnel clouds seen in portions of the Lower Keys. At the end of the month, severe thunderstorms produced high winds, hail and storm damage in the over night and early morning hours of the 29th in Ocala, Orlando, Daytona Beach, and Jacksonville. On the 30th, more hail, storm damage and heavy rain were reported around Orlando, while waterspouts and a tornado, along with flooding and hail were seen in areas of the Gold Coast from West Palm Beach to Miami.
Table 4: Breakdown of storm reports submitted in Florida during the month of April (compiled from Southeast Regional Climate Center).
Agricultural and other climate-related impacts. At the beginning of April, corn and peanuts were being planted and some spring hay harvesting had also been reported. The harvesting of sugarcane was nearing completion. North Florida farmers also began planting cantaloupe, watermelons and tomatoes. Warm seasons crops in south Florida had a setback from a late season frost and high winds. Drought continued to limit forage growth, and the lingering cold temperatures from March has slowed growth, while flooding and disease compounded the problem. Bad weather caused farmers to replant corn and watermelons in some locations. Planting of sweet corn and peas in the Panhandle started in mid-April, as cabbage, watermelons and blueberries were harvested in central and south Florida. Statewide, most of the cattle stock was in fair to good condition, though poor forage in some locations forced ranchers to hay feed their herd. After more bad weather in portions of the Panhandle, certain crops had to be replanted. Spring vegetables were being planted in central Florida, but south Florida growers were battling disease due to heavy rain.
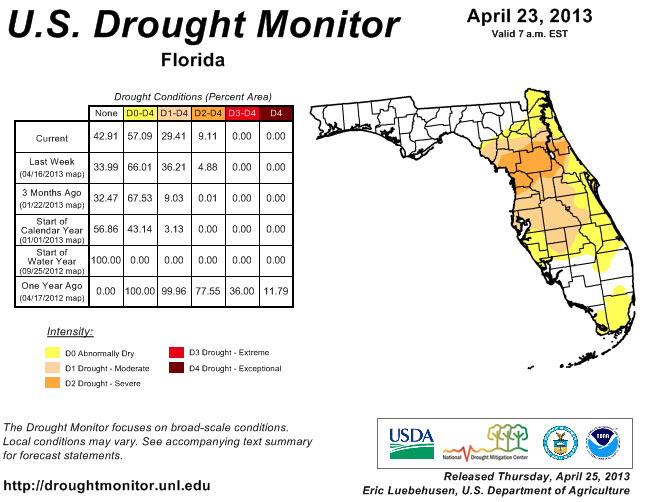
While the statewide rainfall totals varied greatly across the state during April, there have been some improvements. The Florida Panhandle remained drought free through April, though at the beginning of the month, portions of south Florida degraded from dry conditions to moderate drought, before rains set in and helped eased the dryness. Unfortunately, the dryness of April continued in the central Peninsula, and the region of severe drought spread from Flagler and Putnam counties, westward into Marion, Citrus and Levy counties. The beneficial rains at the end of the month helped pull south Florida out of moderate drought, helped either ease the drought in some locations and remove it from others.
Figure 2: Drought conditions in Florida as of April 23, 2013 (courtesy of U.S. Drought Monitor).
Appendix 1: Additional April departures from normal data for Florida locations.
Appendix 2: Select daily maximum and minimum temperature records (° F) tied or broken during April (compiled from NOAA, NWS).
Prepared by Melissa Griffin and David F. Zierden. Thanks to A. Griffin and L. Zuromski.
Florida Climate Center
The Florida State University
Tallahassee, FL
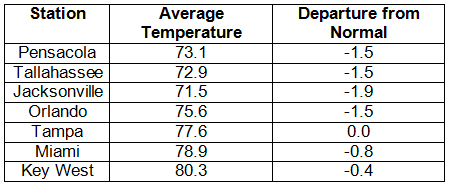
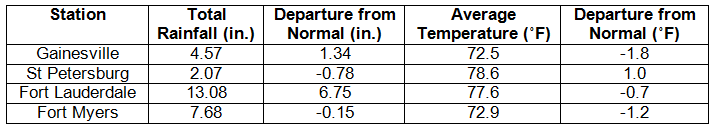
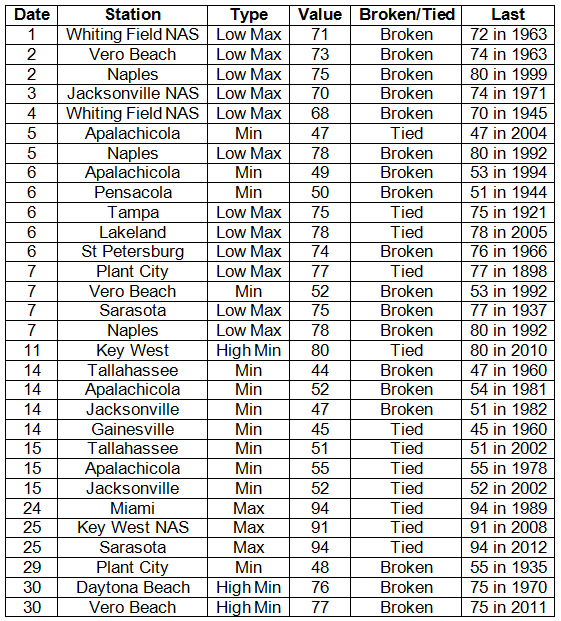
Average temperatures varied across the state in May. Average temperatures varied during May across the entire state (Table 1 and Appendix 1). Departures from normal ranged from -1.9˚F to 1.0˚F across Florida, though most locations in the state had below normal temperatures. May 2013 was the 3rd coldest at Jacksonville, the 6th coldest in Gainesville, and the 9th coldest in Pensacola. At the beginning of the month, many low maximum and minimum temperatures were tied or broken, with a record at Plant City on the 7th that tied with the previous record set back in 1898 (Appendix 2). By the end of the month, more high minimum and maximum temperatures were either tied or broken, as the weather pattern returned to a typical regime for the beginning of June.
Table 1: May average temperatures and departures from normal (°F) for selected cities.
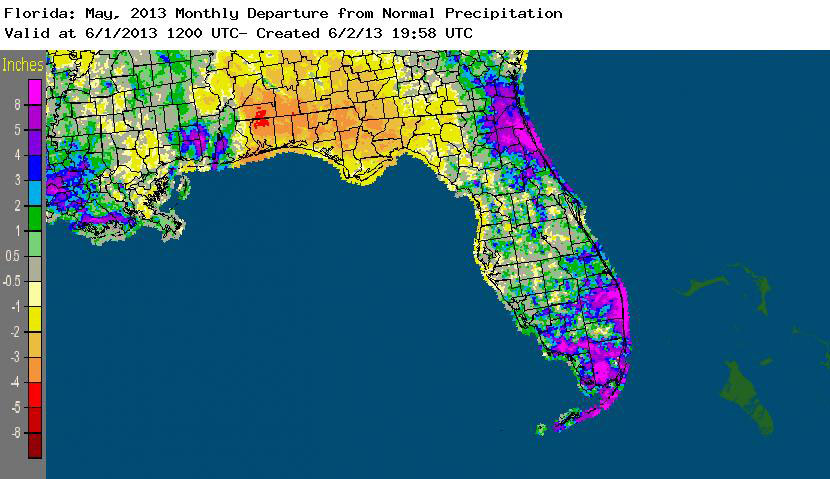
Rainfall totals varied across the state in May. Rainfall totals across the state varied in May (Table 2). Portions of northeast and south Florida, along with localized places in the interior of the peninsula, recorded above normal rainfall (up to and over 8 inches), while the Panhandle and Big Bend regions had 2 to 5 inches below normal precipitation (Figure 1). May was the 6th wettest on record at Fort Lauderdale (Appendix 1) and 7th wettest at Key West, while it was the 4th driest at Tallahassee and the 13th driest May on record at Pensacola. There were a few precipitation records broken during the month (Table 3), with one of those records dating back to 1882. Despite the excessive rainfall that eased drought in some areas, the spring dry season led to a re-introduction of drought classifications along the Panhandle.
Table 2: May precipitation totals and departures from normal (inches) for selected cities.
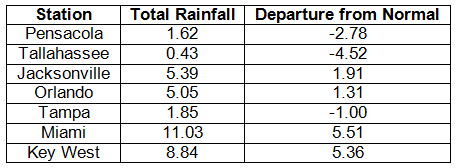
Table 3: Select daily rainfall records (inches) broken during May (compiled from NOAA, NWS).
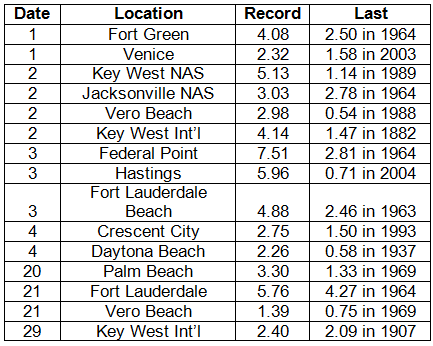
Figure 1: A graphical depiction of the monthly rainfall departure from normal (inches) for May is given in the figure below (courtesy of NOAA, NWS).
ENSO-neutral conditions continue in the Pacific. As of June 3rd, neutral ENSO conditions continue to be reported for the equatorial Pacific. Equatorial sea surface temperatures (SST) are near average across the western and central Pacific Ocean and below average in the eastern Pacific. ENSO-neutral conditions are favored to continue through summer 2013. The Climate Prediction Center (CPC) predicts above normal temperatures for the state and they are also predicting above normal precipitation for the Panhandle and normal precipitation for the rest of Florida through August.
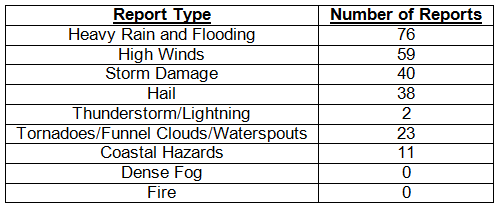
Hazardous weather events in May. May was an active month for severe weather, with 249 storm reports made during the 31-day period, including nearly half a dozen weather related fatalities. On the 1st – 3rd, there were numerous reports of high winds, flooding/heavy rains, and storm damage including hail, along the Florida East Coast from Jacksonville through the Florida Keys. Waterspouts were reported offshore of Bal Harbour and on Lake Okeechobee; while and EF0 tornado was confirmed to have caused damage in Boca Raton. Rain totals were as high as 7 inches in some locations, and wind gusts up to 45 mph were reported in multiple locations. The storm system produced rough surf conditions along the coast, with 5-foot breakers and some minor beach erosion. The Jacksonville and St. Augustine area saw a round of severe weather that produced a tornado near Elkton, FL, on the 4th, along with pea to dime sized hail, heavy rains and uprooted trees. Two separate storms produced hail on the 9th in Hialeah and Jupiter, FL. Early morning reports on the 11th of a waterspout near Miami Beach were a prelude to the storm reports that would come in later that day from Jacksonville, Port St. Lucie and Fort Lauderdale. More waterspouts were reported on the 13th along the Lower Keys. Dangerous rip currents claimed the lives of a 22-year old male who became caught in the strong rip current and a 62-year old man who rescued a 10-year old boy who got caught in the current at Kathryn Abbey Hanna Park on the 14th and 15th. The Jacksonville Beach Life Guards saved 3 people from the rip currents on the same day (15th). Severe weather on the 18th and 19th caused damage in Jacksonville, Gainesville and Orlando, with nickel-sized hail reported with high winds and heavy rains. Heavy rains and flooding were reported in Boca Raton, Miami Beach and Boynton Beach on the 20th, while, in portions of the state west of I-75, reports of pea to quarter sized hail accompanied reports of 50 mph winds and storm damage. Lightning struck the runway at the St. Augustine Airport and damaged a 5x6 foot section of the runway on the 21st. Also on the 21st, the greater Tampa area had reports of dime-sized hail and minor street flooding associated with a strong storm that moved over the area. A funnel cloud was reported over New Smyrna Beach on the 23rd. Over Memorial Day weekend, a 15-year old drowned after being caught in a rip current near Dania Beach, FL, and a 51-year old was killed after being struck by lightning on Belleair Beach, FL, on the 28th. Another rip current related death was reported on the 31st near Boynton Beach after a 17-year old male drowned from strong rip currents.
Table 4: Breakdown of storm reports submitted in Florida during the month of May (compiled from Southeast Regional Climate Center).
Agricultural and other climate-related impacts. Peanuts, corn, cotton and a variety of vegetables continued to be planted across the state at the beginning of the month. South Florida growers harvested blueberries, cabbage, sweet corn, green beans and sweet potatoes, while the sugarcane harvest ended for the year. Drought conditions continued to hamper forage growth, though rains had flooded pastures in some portions of the state. Most packinghouse had closed toward the middle of the month. 90% of the cattle in the state were reported between fair and excellent condition. Potatoes began to be harvested in north Florida, snap beans and carrots were harvested in central Florida, and growers in south Florida harvested a variety of vegetable and specialty crops. Fields were being cleaned up in preparation for the summer fallow. By the end of the month, topsoil and subsoil moisture levels in the northern part of the state had declined, with the majority of the reports indicating more that 50% were short to very short. In southern parts of the state, rainfall totals were above normal, as harvesting of specialty crops continued and packinghouses and processing plants opened.
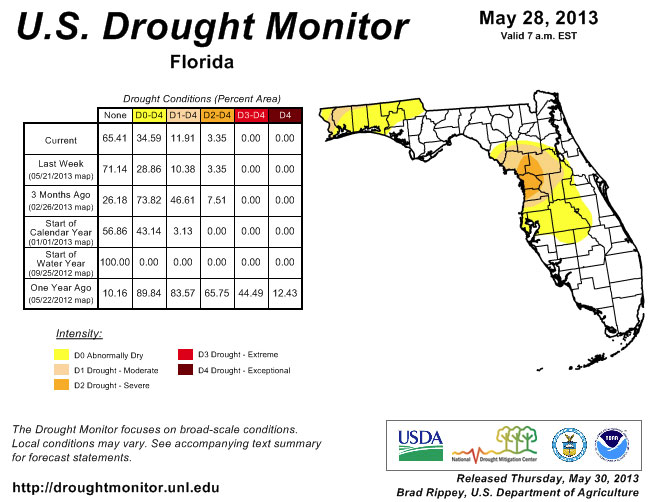
At the beginning of May, the peninsula was under drought classifications that ranged from abnormally dry (D0) to severe drought (D2), with the worst parts of the dryness in portions of Citrus, Sumter, Lake, Marion, Levy, and Putnam counties. May is typically one of the driest months across the entire state, with the statewide precipitation average of 3.86” for the month (based on 1895-2012). Widespread rains in the northeastern counties and along the east coast during the first part of the month helped ease drought conditions in most of the area, where drought had been lingering since the beginning of the year. Rain continued to fall over most of the same area during the remainder of the month, while the Panhandle and Big Bend regions remained dry. By the end of the month, the lack of rainfall in the northern part of the state prompted the re-introduction of dry conditions to Escambia, Santa Rosa, Okaloosa, Walton, Washington, Holmes and Jackson counties.
Figure 2: Drought conditions in Florida as of May 28, 2013 (courtesy of U.S. Drought Monitor).
Appendix 1: Additional May departures from normal data for Florida locations.
Appendix 2: Select daily maximum and minimum temperature records (° F) tied or broken during May (compiled from NOAA, NWS).
Prepared by Melissa Griffin and David F. Zierden.
Florida Climate Center
The Florida State University
Tallahassee, FL
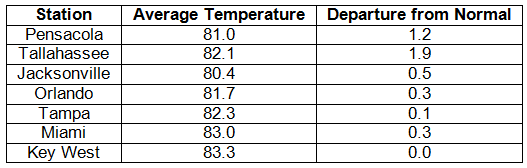
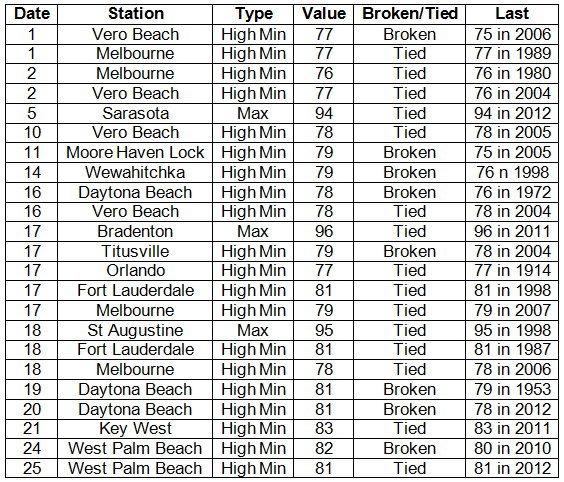
Average temperatures varied across the state in June. Average temperatures varied during June across the entire state (Table 1 and Appendix 1). Departures from normal ranged from -1.0˚F in Fort Myers to 1.9˚F in Tallahassee, though most of the stations reported above normal temperatures for the month. June 2013 was the 11th warmest in both Tallahassee and Miami. During the middle of the month, numerous locations saw maximum temperatures reaching the mid to upper 90s, but the remainder of the month temperatures were around normal. There were a number of maximum and high minimum temperatures tied and broken during June (Appendix 2).
Table 1: June average temperatures and departures from normal (°F) for selected cities.
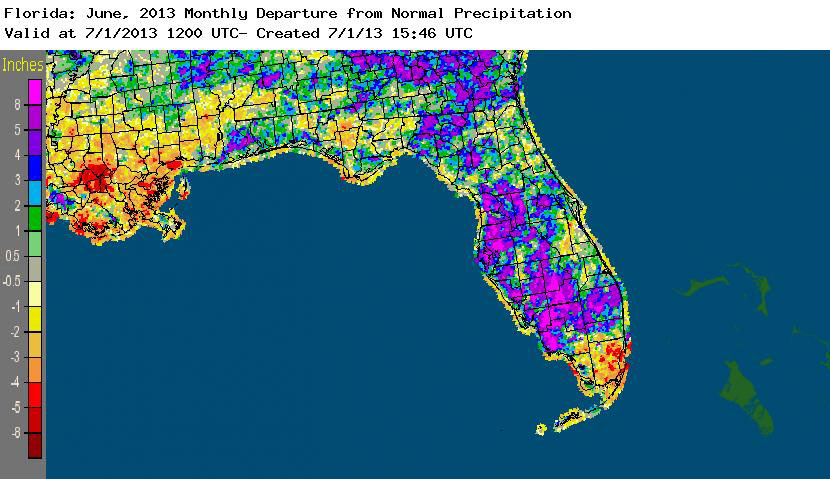
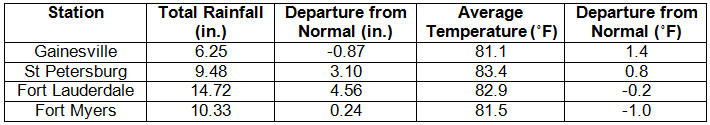
Rainfall totals varied across the state in June. Rainfall totals across the state varied in June (Table 2). Portions of the Big Bend, northeast and south Florida recorded below normal rainfall (between 1 to 4 inches), while the western Panhandle and the western peninsula reported up to 8 inches above normal precipitation (Figure 1). Tropical Storm Andrea made landfall near Steinhatchee on June 6th and brought widespread heavy rain to portions to the Nature Coast. Due to the fast movement of the system, most of the area was spared from flooding, though minor flooding was reported along Tampa’s Bayshore Boulevard. The rest of the precipitation during the month was characterized by typical summertime rainfall, with some of the stronger localized thunderstorms producing record-breaking rainfall (Table 3).
Table 2: June precipitation totals and departures from normal (inches) for selected cities.
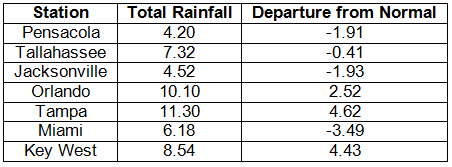
Table 3: Select daily rainfall records (inches) broken during June (compiled from NOAA, NWS).
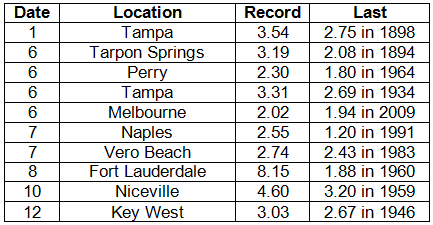
Figure 1: A graphical depiction of the monthly rainfall departure from normal (inches) for June is given in the figure below (courtesy of NOAA, NWS).
ENSO-neutral conditions continue in the Pacific. As of July 1st, neutral ENSO conditions continue to be reported for the equatorial Pacific. Equatorial sea surface temperatures (SST) are near average across the western and central Pacific Ocean and below average in the eastern Pacific. ENSO-neutral conditions are favored to continue through the summer 2013. The Climate Prediction Center (CPC) predicts above normal temperatures and above normal precipitation for the state through September.
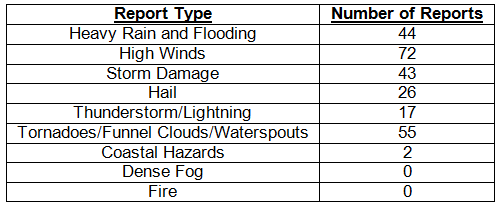
Hazardous weather events in June. Over 250 storm reports were submitted in Florida during the month of June. The month started off with heavy rains and flooding reported in the areas of Boca Raton and Davie, FL, on the same day (June 1st) that a waterspout was seen offshore of Miami Beach. On the 3rd, 2.93 inches of rain fell in 90 minutes in Port Saint John, FL, and heavy rainfall was also reported in Winter Park. Tropical Storm Andrea made landfall near Steinhatchee, on the 6th, prompting numerous storm reports. A line of strong thunderstorms trained over the Keys with high winds (~45 mph) reported from both land and marine stations. Tornadoes were reported in Myakka River, Belle Glade, Sun City Center, Markham Park, Royal Palm Beach, St. Petersburg, Clearwater, Venice, Mayport, and Fernandina Beach. Heavy rainfall caused some localized flooding in places such as Gainesville, Jacksonville, Carrabelle, Tampa and Miami. As the storm moved up the East Coast, tropical moisture continued to be present over south Florida, causing additional reports of heavy rain and flooding along portions of the Gold Coast. A severe thunderstorm on the 10th produced hail, high winds and heavy rain in Gainesville. The 12th was a highly active day in and around Tampa, Fort Myers and Naples, as storms caused quarter-sized hail, 50 mph winds, heavy rains and a tornado. The greater Jacksonville area had numerous reports of hail, flooding, and storm damage on the 14th. On the same day, 3 waterspouts were seen at different locations along the Florida Keys. Two swimmers needed to be rescued from dangerous rip currents near Mayport, FL, on the 15th. A waterspout was reported by several spotters in Tampa Bay on the 19th while, across the peninsula, a funnel cloud was seen around Mims, FL. On the 24th, a thunderstorm caused hail, high winds in Tampa, and lightning that struck a utility shed and caused a small house fire in Clearwater, FL; hail was also reported in portions of the Panhandle and a small house was struck by lightning in Marianna. A 23-year old male died after being caught in dangerous rip currents on the 25th off the coast of Cape Canaveral, FL. A thunderstorm offshore of Panama City Beach produced 3 separate waterspouts on the morning of the 27th. Storm damage was reported around Tallahassee on the 28th from an intense early evening thunderstorm.
Table 4: Breakdown of storm reports submitted in Florida during the month of June (compiled from Southeast Regional Climate Center).
Agricultural and other climate-related impacts. Peanut planting continued in the Panhandle, and non-irrigated crops were showing stress due to lack of rain. Some hay was harvested but yields are low, and drought was a limiting factor for forage growth. Green beans were harvested in north Florida, watermelons were harvested in Central Florida, and vegetable harvesting was winding down in South Florida. Farmers in the Panhandle continued planting field corn, cotton, peanuts and soybean during the middle of the month, while tomatoes, potatoes, squash and cabbage were harvested. Cattle across the state were in good to fair condition. Toward the end of the month, dry weather delayed some planting in the Panhandle and the Kudzu bug affected soybeans in Okaloosa County. Forage growth was limited by not only drought but flooding in locations across the state. Soil moisture at the end of the month was adequate in most places in the state, as planting and harvesting operations continued for fruits, vegetables, rice, and wheat.
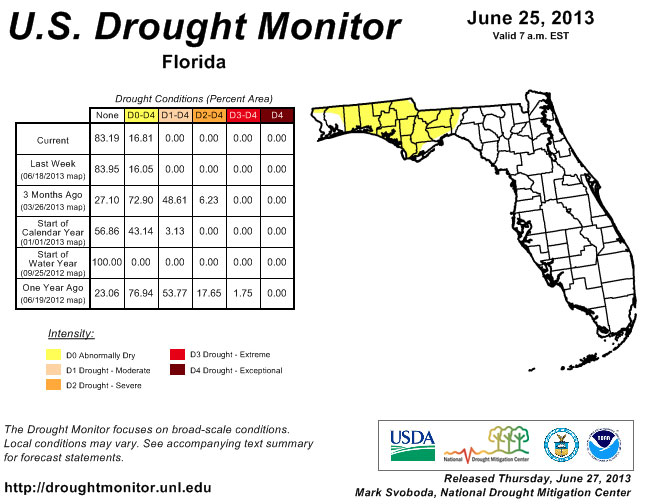
At the end of May, the lack of rainfall from the previous month in the northern part of the state prompted the re-introduction of dry conditions in Escambia, Santa Rosa, Okaloosa, Walton, Washington, Holmes and Jackson counties and an area of severe drought around the Nature Coast. The summertime rainfall pattern kicked off the beginning of June, and many stations around the state reported near or above normal rainfall for the month. The drought conditions were slowly removed during the month in the peninsula, as the area impacted by drought received 150% of monthly normal rainfall. Parts of the Panhandle continued to have issues with drought during June, though areas of moderate drought eased, the area of dry conditions expanded into the Big Bend region.
Figure 2: Drought conditions in Florida as of June 25, 2013 (courtesy of U.S. Drought Monitor).
Appendix 1: Additional June departures from normal data for Florida locations.
Appendix 2: Select daily maximum and minimum temperature records (° F) tied or broken during June (compiled from NOAA, NWS).
Prepared by Melissa Griffin and David F. Zierden.
Florida Climate Center
The Florida State University
Tallahassee, FL
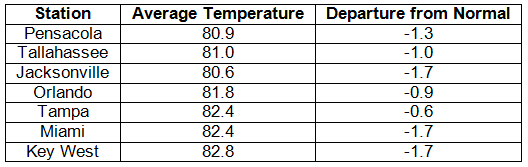
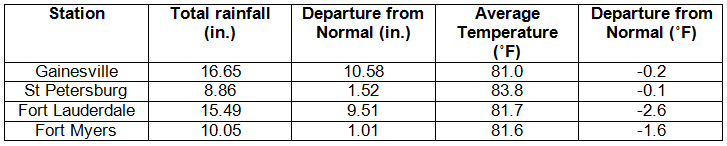
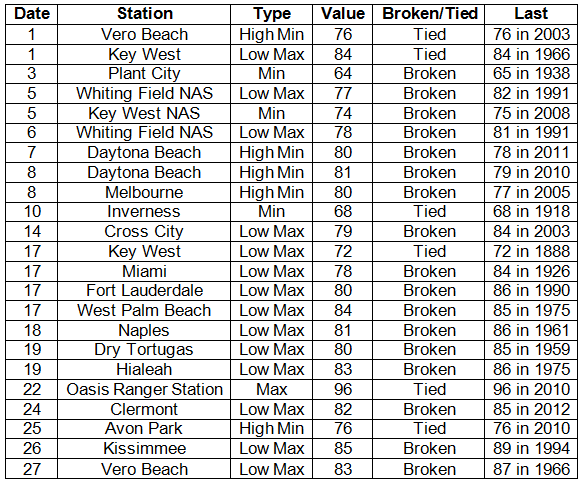
Average temperatures varied across the state in July. Average temperatures were below normal during July across the entire state (Table 1 and Appendix 1). Departures from normal ranged from -0.1˚F in St. Petersburg to -2.6˚F in Fort Lauderdale. These below normal average temperatures are a bit deceiving without looking at both the maximum and minimum temperatures for the month. Most stations across the state reported lower than normal maximum temperatures and higher than normal minimum temperatures. For example, maximum temperatures for July 2013 were the coolest on record in Federal Point, the 3rd coolest at Pensacola, 4th coolest in Miami, and 8th coolest in Key West; while the minimum temperatures were the 3rd warmest at Moore Have Lock, 4th warmest in St. Petersburg, 10th warmest at Daytona Beach. There were a number of low maximum and high minimum temperatures tied and broken during July (Appendix 2).
Table 1: July average temperatures and departures from normal (°F) for selected cities.
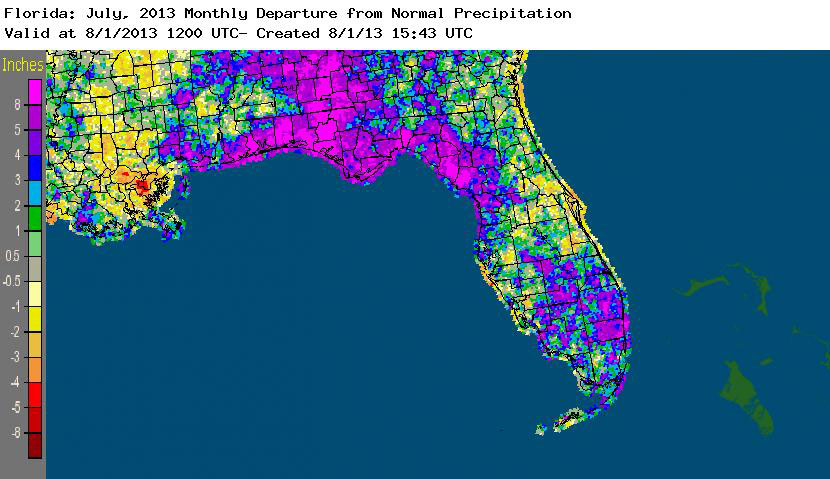
Rainfall totals varied across the state in July. Rainfall totals across the state varied in July, though most of the state reported above normal precipitation for the month (Table 2). Portions of the Big Bend, Panhandle and southern Florida recorded up to 8 inches above normal precipitation while portions along the east coast from Jacksonville to Titusville and inland from the Orlando to the west coast between 1 to 3 inches below normal rainfall (Figure 1). The unusual rainfall pattern during the month has impacted agricultural producers with diseases, standing water and decaying crops to causing a forced release of the high water in Lake Okeechobee to keep the lake at a level that can be managed in the event of any tropical storm/hurricane impacts later in the season. July 2013 was the wettest on record in Gainesville, 3rd wettest in Pensacola, 5th wettest in Miami and 9th wettest in Tallahassee. Numerous 24-hour precipitation records were broken for the month, with one record that dated back to 1890 (Table 3).
Table 2: July precipitation totals and departures from normal (inches) for selected cities.
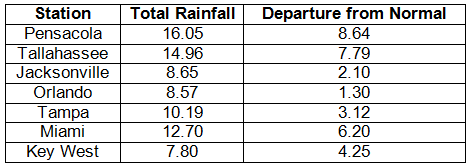
Table 3: Select daily rainfall records (inches) broken during July (compiled from NOAA, NWS).
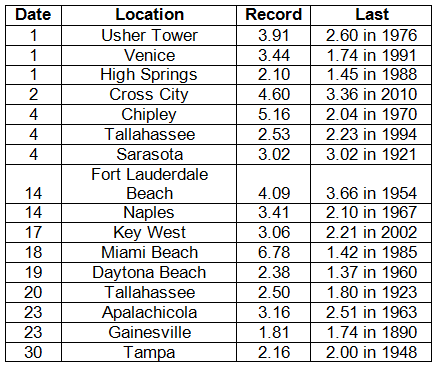
Figure 1: A graphical depiction of the monthly rainfall departure from normal (inches) for July is given in the figure below (courtesy of NOAA, NWS).
ENSO-neutral conditions continue in the Pacific. As of July 29th, neutral ENSO conditions continue to be reported for the equatorial Pacific. Equatorial sea surface temperatures (SST) are near average across the western and central Pacific Ocean and below average in the eastern Pacific. ENSO-neutral conditions are favored to continue through the summer and into the fall of 2013. The Climate Prediction Center (CPC) predicts above normal temperatures for the state and they are also predicting above normal precipitation for the entire state and normal temperatures through October.
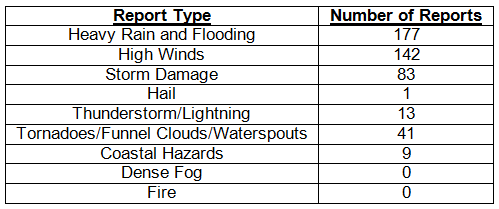
Hazardous weather events in July. Over 450 storm reports were submitted during the month of July, with the majority of those reports categorized with heavy rain, flooding or high winds. The month started off with nearly 199 of the total 450 reports coming from July 1st – July 5th; 77 of the severe weather reports were on the 4th of July. Heavy rains and related flooding were seen in many portions of the Panhandle, Big Bend and southern Florida and numerous reports of high winds were scattered across the state. Tornadoes touched down in Oldsmar and Bradenton on the 9th and 10th, causing damage to homes, and 3 people were injured when a waterspout moved onshore near Sea Ranch Lakes on the 19th. Over the course of the month, 4 people were injured from lightning strikes in Pace, Cooper City and Fort Lauderdale; 6 people died and more than 50 people were rescued along Florida beaches due to dangerous rip currents.
Table 4: Breakdown of storm reports submitted in Florida during the month of July (compiled from Southeast Regional Climate Center).
Agricultural and other climate related impacts. Topsoil and subsoil levels were adequate at the beginning of the month, with reports from some portions of the state having a surplus at both levels. Farmers in the Panhandle finished up planting soybeans, while others replanted cotton and peanut fields. Heavy rains kept growers in Dixie County from having a second hay cutting. In south Florida, grapefruits and late oranges seasons came to a close and producers began preparing fields for fall/winter vegetables. All areas reported heavy spraying and Psyllid control. The heavy rains brought soil (top and sub) moisture levels up, with over 20% reporting a surplus. The threat of disease to crops had increased due to standing water across the state. Okaloosa County reported peanut acreage lost due to the heavy rains. Rain caused watermelons to burst in Gulf County. Growers began concentrating on next year’s citrus crop. Toward the end of the month, soil moisture surplus levels were at 40%. Haying was delayed due to the heavy rains, and white mold was present in peanuts in a few Panhandle counties. Preparing for the fall planting season continued but was hindered in some locations because of standing water. Peanuts also showed signs of yellowing in Washington County, while Bradford and Seminole counties reported loss of hay sitting in wet fields waiting to be baled. Cattle conditions across the state during the state were good to excellent, though forage was limited due to flooding and disease.
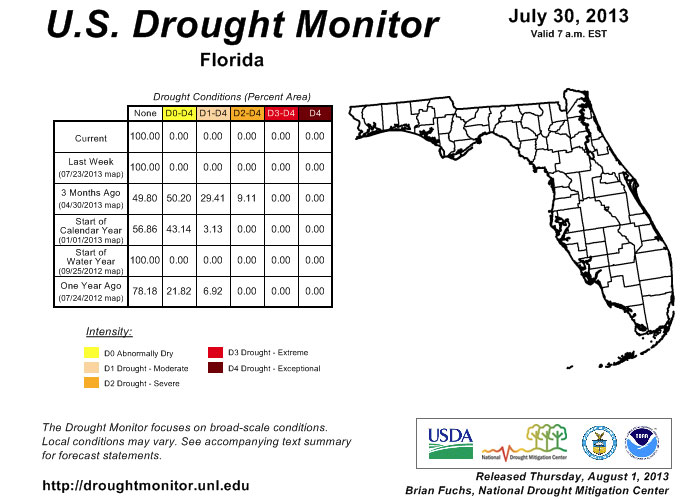
The dry conditions that had lingered in the Panhandle at the beginning of July were completely removed after an unusual atmospheric weather pattern allowed for an extremely moist flow over the state. Rainfall totals for the month (Table 2 and Figure 1) were well above normal across Florida, wiping out all the remaining traces of drought conditions in the state. With all of the rain, interests have shifted from a drought focus, to inland flooding as many rivers in the state are near flood stage. The current wet pattern is forecasted to hold through October, which should keep any drought conditions that appear localized and not severe.
Figure 2: Drought conditions in Florida as of July 30, 2013 (courtesy of U.S. Drought Monitor).
Appendix 1: Additional July departures from normal data for Florida locations.
Appendix 2: Select daily maximum and minimum temperature records (° F) tied or broken during July (compiled from NOAA, NWS).
Prepared by Melissa Griffin and David F. Zierden.
Special thanks to Lauren Zuromski.
Florida Climate Center
The Florida State University
Tallahassee, FL
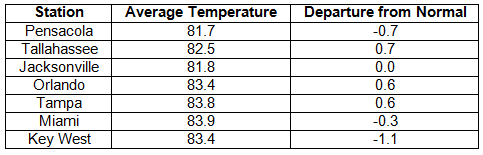
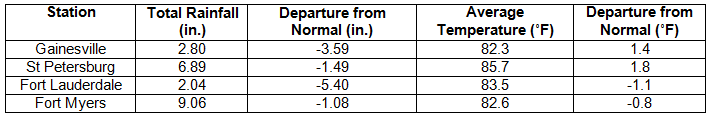
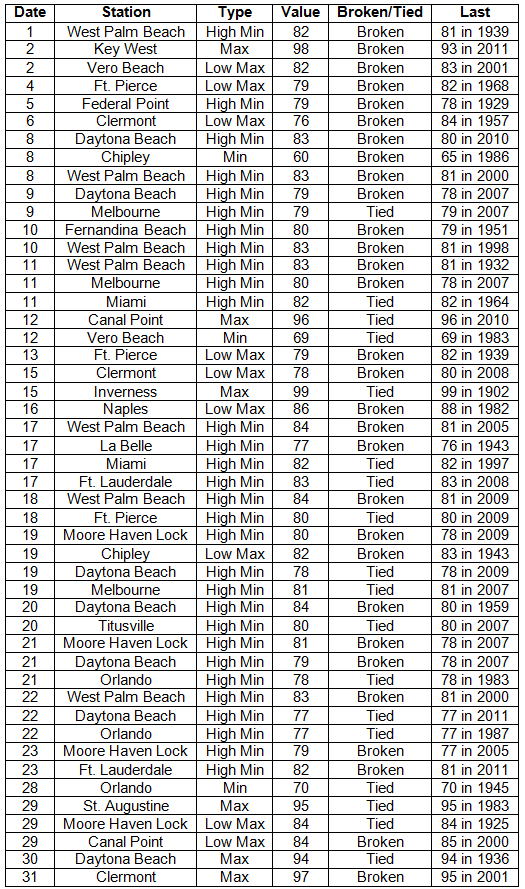
Average temperatures varied across the state in August. Average temperatures varied during August across the entire state (Table 1 and Appendix 1). Departures from normal ranged from -1.1˚F in Ft. Lauderdale and Key West to 1.8˚F in St. Petersburg. Average temperatures for August 2013 were the warmest on record in St. Petersburg and the 7th warmest in Daytona Beach; while the maximum temperatures were the 10th coldest in Key West and Fort Pierce and minimum temperatures were the warmest on record at Bartow, Moore Have Lock and West Palm Beach. There were a number of low maximum and high minimum temperatures tied and broken during August (Appendix 2).
Table 1: August average temperatures and departures from normal (°F) for selected cities.
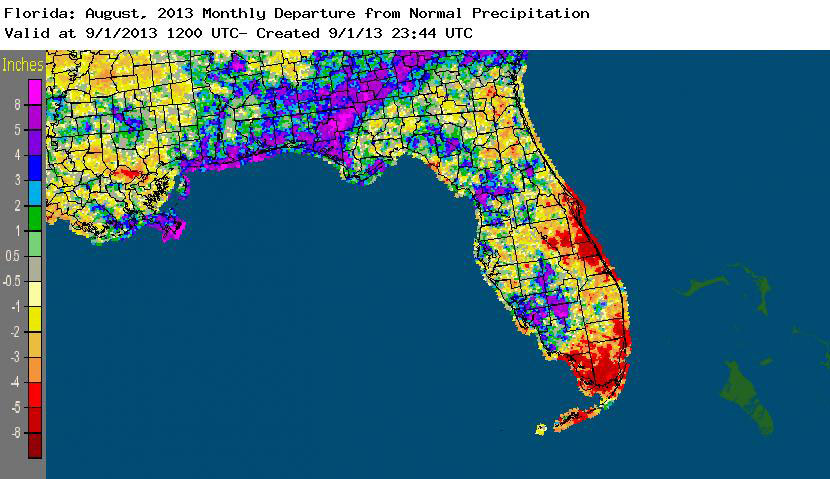
Rainfall totals varied across the state in August. Rainfall totals across the state varied in August (Table 2). Portions of the Big Bend, Panhandle and the west coast of Florida recorded up to 8 inches above normal precipitation, while portions along the east coast from Titusville to the Keys, including most of Dade and Monroe counties, had up to 5 inches below normal rainfall (Figure 1). The additional rainfall this summer has prompted releases of Lake Okeechobee to alleviate stress on the Herbert Hoover Dike, but the releases are also being blamed for the red tide that killed 133 manatees near Fort Myers and toxic algae blooms in the St. Lucie River. August 2013 was the driest on record at Vero Beach and 8th wettest on record in Tampa. Numerous 24-hour precipitation records were broken for the month (Table 3).
Table 2: August precipitation totals and departures from normal (inches) for selected cities.
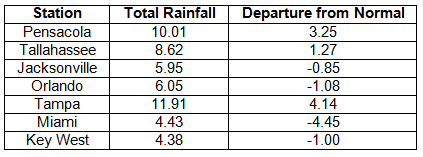
Table 3: Select daily rainfall records (inches) broken during August (compiled from NOAA, NWS).
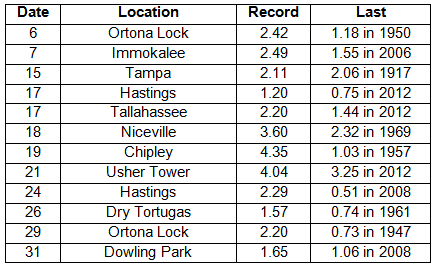
Figure 1: A graphical depiction of the monthly rainfall departure from normal (inches) for August is given in the figure below (courtesy of NOAA, NWS).
ENSO-neutral conditions continue in the Pacific. Neutral ENSO conditions continue to be reported for the equatorial Pacific, with the equatorial sea surface temperatures (SST) near average across the western and central Pacific Ocean and below average in the eastern Pacific. ENSO-neutral conditions are favored to continue through the fall of 2013. The Climate Prediction Center (CPC) predicts normal precipitation and temperatures for the state through November.
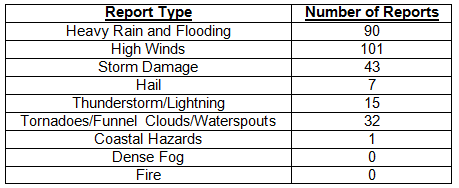
Hazardous weather events in August. In August, 289 severe weather reports were made across the state. The month started off with an EF2 tornado touching down just east of downtown Jacksonville, near the Jacksonville Arboretum and Gardens. The sheriff’s office reported about 30 homes and structures were damaged from the tornado. The same storm produced heavy rains, high winds and flooding in and around Jacksonville. On the 3rd, high winds were recorded up and down the east coast of the state. Lightning caused a house fire on the 6th in Milton, while a female was struck near Holiday, FL, on the 7th. High winds were measured along the Keys on the 9th, and a severe thunderstorm caused damage around Cape Coral on the same day. Heavy rains caused flooding around Marianna, FL, on the evening of the 16th and into the early morning of the 17th. From the 17th until the 19th, some roads in Panama City Beach were under water as heavy rains trained over the area, while flooding was reported in De Funiak Springs, Vernon and Freeport. On the 18th, two people died after being caught up in rip currents near Miami Beach, FL. Strong storms produced high winds, damage and hail in and around both Tampa and Brandon on the 20th. On the 21st, a severe storm near Clearwater, FL, produced pea to dime sized hail and wind gusts of 40 mph. Multiple locations in the central part of the state reported heavy rain, localized flooding, lightning strikes and storm damage on the 22nd and again on the 23rd. Waterspouts were spotted near Key Largo, Key West, Stuart and Dunedin, FL, on the 26th and 27th. A severe thunderstorm moved through Leon and Jefferson counties on the evening of the 30th, causing storm damage, and the NWS office in Tallahassee reported nearly 1,000 lightning strikes in an hour associated with the thunderstorm.
Table 4: Breakdown of storm reports submitted in Florida during the month of August (compiled from Southeast Regional Climate Center).
Agricultural and other climate related impacts. Topsoil and subsoil were near 100% at adequate or surplus levels at the beginning of the month. Jackson, Walton and Flagler counties reported extremely wet hay fields and were unable to cut, while Taylor and Dixie counties were able to get a first cut. Pastures showed signs of yellowing due to the rains, and there were concerns about the nutritional value of the forage. Lower yields of cotton, soybeans and tobacco were reported, along with yellowing of peanuts and fungus in pecans. Heavy rains delayed fall planting in the northern part of the state. A drier second week of August led to a decrease in the surplus water in both soil levels. With the fields drying out, corn was harvested in Jackson County. The cotton crop in Walton County was in fair condition, along with cattle conditions across the state. Forage conditions were still limited due to standing water across portions of the state. Citrus growing area was drought free, and orange and grapefruits were between golf ball and baseball sized. South Florida farmers prepared land for early active planting, laying plastic for fall vegetable and fruit crops. Pasture and forage declined seasonally as grass matures. By the end of the month, peanuts looked good in high, well-drained soil. Haying slowed due to rain, and quality of the hay was poor. Sugarcane preparations were being made, while tomatoes, peppers okra and sweet potatoes were planted in South Florida.
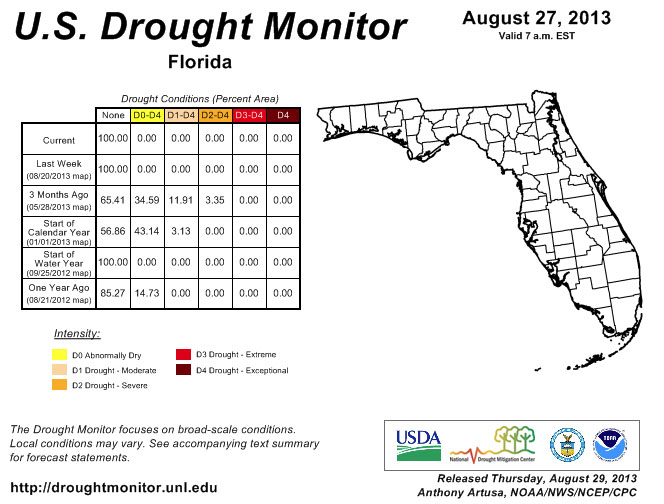
Despite below normal rainfall in portions of the state during August (Figure 1), Florida remained drought free since July 9th. September marks the peak month for tropical activity in the Atlantic, and, should a hurricane or tropical system track toward the state, impacted areas could see above normal precipitation. Water levels in Lake Okeechobee are about 15.5’, which is the highest level the Corps will allow during the hurricane season. The Herbert Hoover Dike, the 25’+ tall, 143-mile long gravel, rock, limestone, sand and shell dike built in the 1930s, is being watched closely as it is vulnerable to leaking and failure when the water levels get too high from heavy rains. In addition to the concerns about Lake Okeechobee, rivers in the northern part of the state have been at or above action stage during August. The saturated ground has led to extreme runoff, filling rivers to their banks. Fall is typically a drier season for the state, however, with the unusual weather patterns seen this summer, it’s difficult to say if precipitation will be normal despite the fact that the three-month outlook (Sept-Nov) from CPC shows average rainfall across the state.
Figure 2: Drought conditions in Florida as of August 27, 2013 (courtesy of U.S. Drought Monitor).
Appendix 1: Additional August departures from normal data for Florida locations.
Appendix 2: Select daily maximum and minimum temperature records (° F) tied or broken during August (compiled from NOAA, NWS).
Building A, Suite 292
Tallahassee, FL 32306-2741
Phone: (850) 644-3417 | (850) 644-0719
climate@coaps.fsu.edu