


The Florida Climate Center serves as the primary resource for climate data, information, and services in the state of Florida.

The Florida Climate Center achieves its mission by providing climate monitoring, research, and expertise to be applied by the people, institutions, and businesses of Florida and the surrounding region.
We provide direct service by fulfilling requests for climate and weather data and information in a variety of formats.
We perform research that advances the understanding of the climate variability and changes of Florida and the surrounding region.
We provide outreach in presentations and at events aimed at a variety of groups, interests, and ages.
Prepared by Melissa Griffin and David F. Zierden.
Florida Climate Center
The Florida State University
Tallahassee, FL

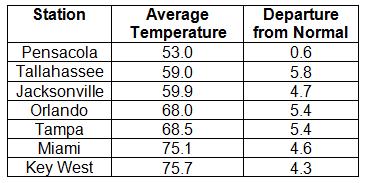
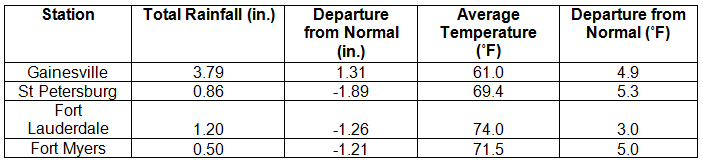
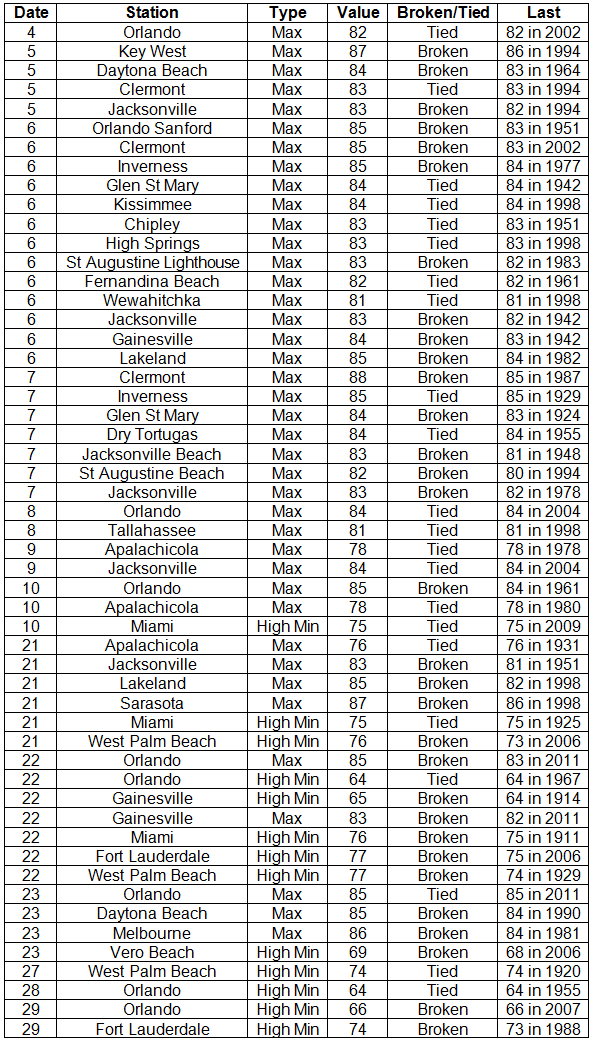
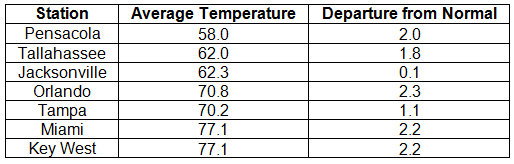
Average temperatures above normal across the state in December. December 2013 was a fairly warm month across Florida (Table 1 and Appendix 1). Departures from normal ranged from 0.6 ˚F in Pensacola to 5.8˚F in Tallahassee. Average temperatures for December 2013 were the 2nd warmest in Miami and Fort Lauderdale, 3rd warmest on record in Orlando and Daytona Beach, 5th warmest in Key West and Tampa, and 10th warmest in Tallahassee. There were a number of maximum and high minimum temperatures tied and broken during the month (Appendix 2). The all-time record high maximum temperature for December in Jacksonville was tied on the 9th with a recorded temperature of 84˚F.
Table 1: December average temperatures and departures from normal (°F) for selected cities.
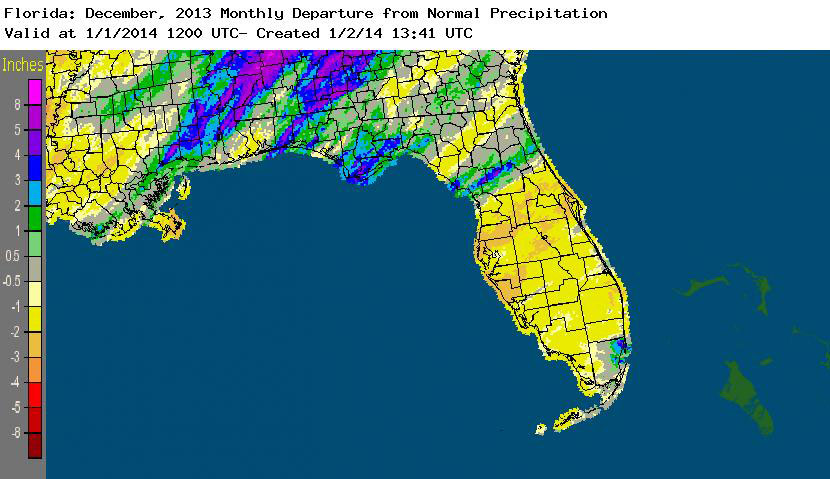
Rainfall totals varied across the state in December. Portions of the Big Bend, Panhandle, north-central Florida, and areas around Miami reported monthly rainfall totals above normal, while the majority of the Peninsula saw below normal totals (Figure 1). Departures from normal roughly ranged from -2.31” to 2.63” (Table 2 and Appendix 1), though some areas of Florida saw rainfall totals that were as much as 3.00” below normal or nearly 8.00” above normal. December 2013 was the 6th wettest December on record in Miami, while it was the 6th driest in Orlando. Numerous 24-hour precipitation records were broken for the month (Table 3).
Table 2: December precipitation totals and departures from normal (inches) for selected cities.
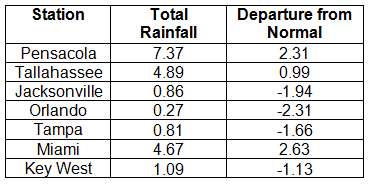
Table 3: Select daily rainfall records (inches) broken during December (compiled from NOAA, NWS).
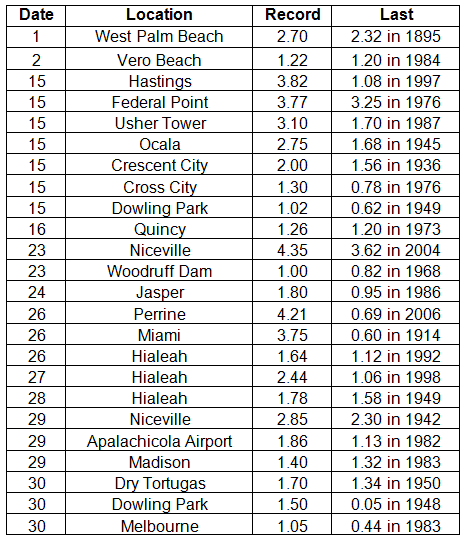
Figure 1: A graphical depiction of the monthly rainfall departure from normal (inches) for December is given in the figure below (courtesy of NOAA, NWS).
ENSO-neutral conditions continue in the Pacific. Neutral ENSO conditions continue to be reported for the equatorial Pacific, with equatorial sea surface temperatures (SST) near average across much of the equatorial Pacific. ENSO-neutral conditions are favored to continue through the summer of 2014. The Climate Prediction Center (CPC) predicts above normal temperatures in the Panhandle, normal temperatures for the rest of the state, and below normal precipitation for the entire state through March.
Hazardous weather events in December. Only 20 severe weather reports were made across the state in December. Heavy rain was reported in and around the Vero Beach area on the 1st, with 5.46” of rain reported in almost 4 hours. Dense fog was reported in Tallahassee on the 6th with visibility less than 1/8 of a mile, and widespread dense fog was observed on the west side of Lake Okeechobee in La Belle, Clewiston, and Immokalee on the 7th. Straight-line winds, estimated at 100 mph and associated with a thunderstorm north of Ocala, caused damage in Anthony, FL, where a barn was moved off its concrete foundation on the 14th. On the same day, an EF1 tornado moved through Palm Coast, (Flagler County, FL), uprooting trees and damaging power lines along its path. The day after Christmas, heavy rain was reported in between Homestead and Miami; early in the morning on the 29th, high winds from a thunderstorm were reported at Mexico Beach, FL.
Table 4: Breakdown of storm reports submitted in Florida during the month of December (compiled from Southeast Regional Climate Center).

Agricultural and other climate related impacts. In December, rain was limited across the state, and farmers in the northern part of the state were finishing up harvest of cotton, soybeans and continued planting oats, wheat, and rye. Light frost during the month ended the warm season perennial pastures in the Panhandle. Cattlemen were feeding hay and supplements to stock as pasture conditions ranged from poor to good condition and winter grazing was stressed due to drought. Irrigation in the citrus region continued as dry conditions persisted, and workers were reporting small-sized fruits in all varieties. The warmer-than-normal temperatures led to accelerated vegetable growth in many south Florida counties, and sugarcane harvesting proceeded on schedule.
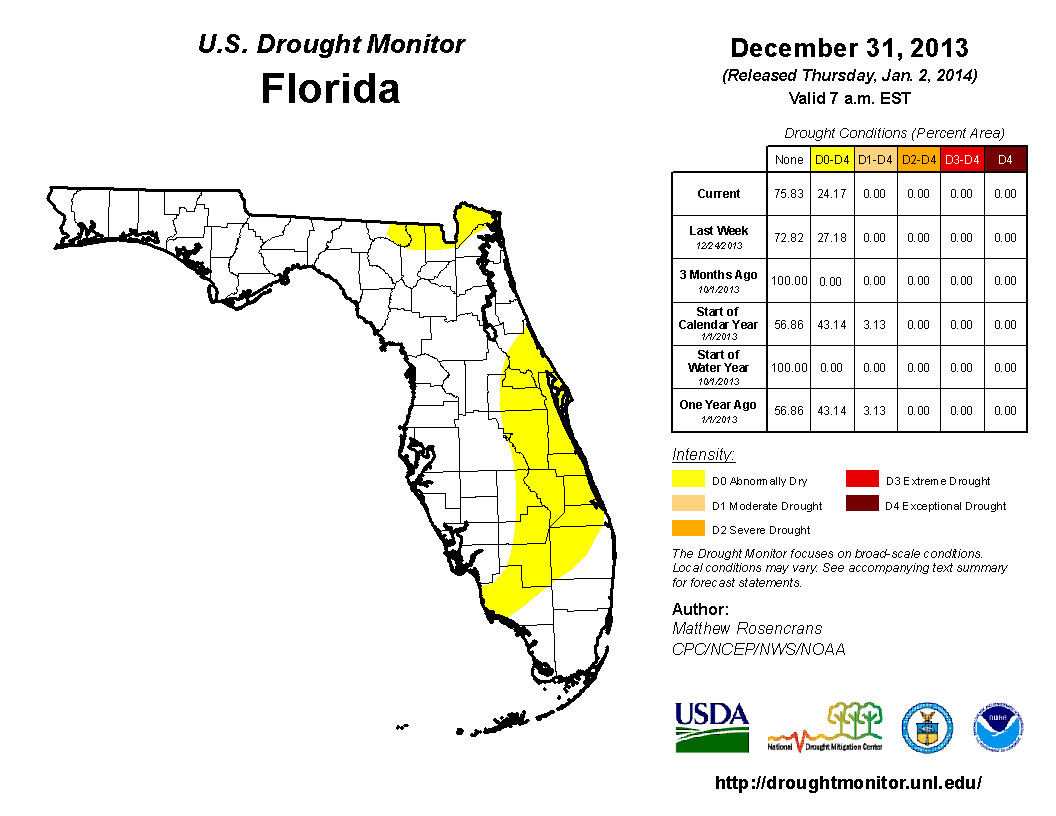
Early in December, there was an expansion of dry conditions (D0) in south Florida to include portions of Collier and Lee counties. The lack of rain in the beginning of December caused the introduction of D0 into the northwest Panhandle (Escambia, Santa Rosa and Okaloosa counties) and in part of central Florida (Orange, Osceola, Seminole and Volusia counties). However, rain in the northeastern portion of the state alleviated some of the dryness around the areas of Jacksonville, St. Augustine, Ocala and Gainesville. Some residual dryness remained in Nassau, Baker, Columbia and Hamilton counties by the end of the month, with D0 conditions still present along portions of the east coast and citrus growing region. The CPC forecast for the next three months (January, February, and March) is predicting below normal rainfall, so the chance of seeing more dry conditions, and potentially drought, introduced into the state remains high.
Figure 2: Drought conditions in Florida as of December 31, 2013 (courtesy of U.S. Drought Monitor).
Appendix 1: Additional Decemer departures from normal data for Florida locations.
Prepared by Melissa Griffin and David F. Zierden.
Special thanks to Lauren Zuromski.
Florida Climate Center
The Florida State University
Tallahassee, FL
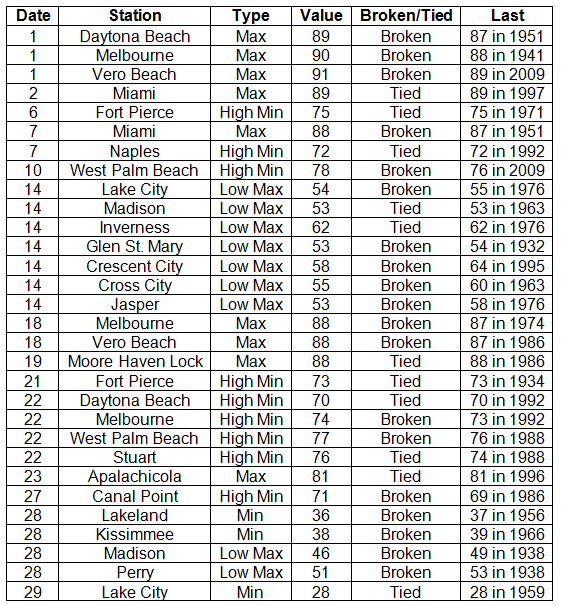
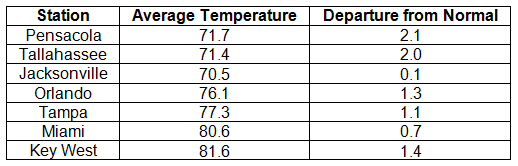
Average temperatures above normal across the state in November. The majority of stations across the state reported above normal average temperatures during November, though a few stations saw temperatures that were slightly below normal (Table 1 and Appendix 1). Departures from normal ranged from -0.1˚F in Ft. Lauderdale to 2.3˚F in Orlando and St. Petersburg. Average temperatures for November 2013 were the 3rd warmest on record in Miami and the 10th warmest in Orlando. There were a number of low maximum and high minimum temperatures tied and broken during the month (Appendix 2). The all-time record high maximum temperature for November in Daytona Beach was tied on the 1st with a recorded temperature of 89˚F. This tied the record that was set on November 28, 1948.
Table 1: November average temperatures and departures from normal (°F) for selected cities.
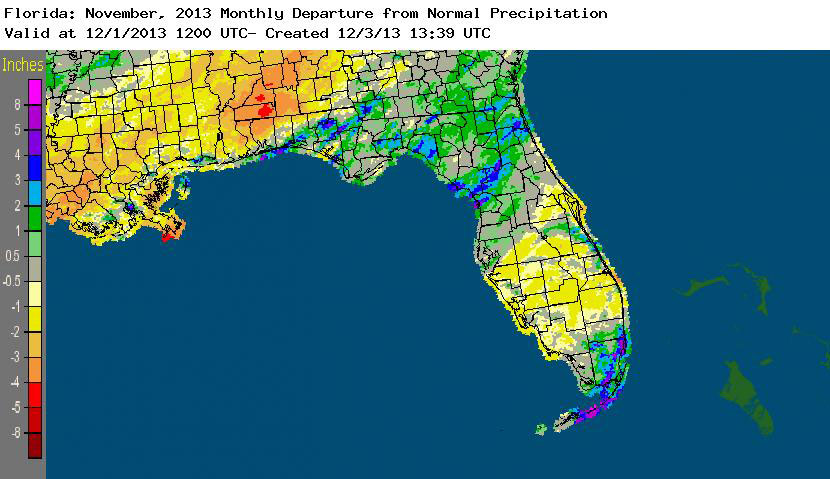
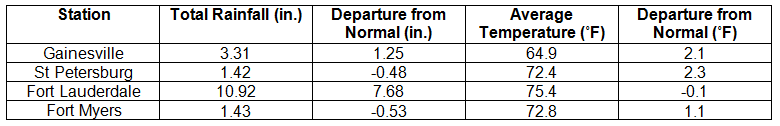
Rainfall totals varied across the state in November. Portions of the Big Bend, North Florida, and areas along the southeast coast and Florida Keys reported monthly rainfall totals above normal, while extreme northwest Florida and most of the southern Peninsula saw below normal totals (Figure 1). Departures from normal roughly ranged from -0.59” to 7.68” (Table 2 and Appendix 1), though some areas Florida saw rainfall totals that were as much as 5.00” below normal or nearly 8.00” above normal. November 2013 was the 4th wettest November on record in Fort Lauderdale, 7th wettest in Chipley, and 10th wettest in Miami. Numerous 24-hour precipitation records were broken for the month (Table 3), including one record that was tied that dates back to 1890 in Key West.
Table 2: November precipitation totals and departures from normal (inches) for selected cities.
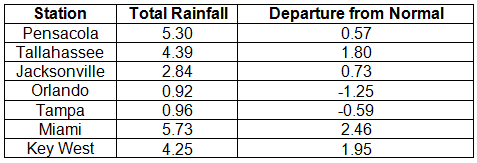
Table 3: Select daily rainfall records (inches) broken during November (compiled from NOAA, NWS).
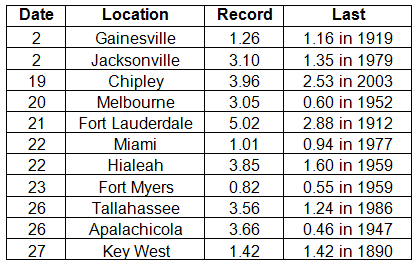
Figure 1: A graphical depiction of the monthly rainfall departure from normal (inches) for Novemer is given in the figure below (courtesy of NOAA, NWS).
ENSO-neutral conditions continue in the Pacific. Neutral ENSO conditions continue to be reported for the equatorial Pacific, with equatorial sea surface temperatures (SST) near average across much of the equatorial Pacific. ENSO-neutral conditions are favored to continue through the spring of 2014. The Climate Prediction Center (CPC) predicts normal temperatures and precipitation for the state through February.
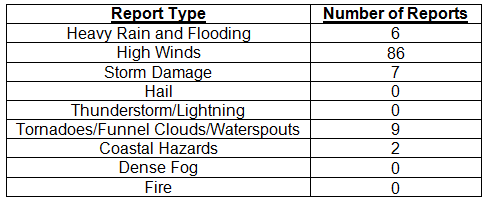
Hazardous weather events in November. Only 110 severe weather reports were made across the state in November. On the 5th, high winds with gusts up to 50 mph, not associated with thunderstorms, were reported along the Florida Keys. Flooding was recorded in Fernandina Beach and Mayport, due to the astronomical high tides on the 5th and 6th. The passage of a strong cold front on the 13th and 14th produced strong winds across the eastern part of the state. Wind gusts of up to 45 mph were reported in Jacksonville Beach, St. Augustine, New Smyrna Beach, Key Biscayne, and Key West. Non-thunderstorm winds knocked down trees and power lines in Flagler Beach, Palm Coast, and St. Augustine. Multiple reports of waterspouts were made from Miami Beach and Fort Lauderdale on the 20th. Urban and street flooding was seen in Hallandale and Hollywood on the 21st and in Miami Lakes and North Miami Beach on the 23rd. Another strong cold front pushed through the state on the 24th, bringing another round of strong winds (gusts up to 45 mph) to portions of the eastern coast of the state. On the 26th, an area of low pressure moved east across the Panhandle before moving up the Eastern Seaboard. Strong thunderstorms caused storm damage in Shadeville and Tallahassee, with multiple reports of trees down in both locations. A supercell thunderstorm produced an EF1 tornado in Stonemill Creek (Gulf County) that damaged trees and a few building along its 3-mile long path. The same supercell produced tree damage in Red Hill (Liberty County).
Table 4: Breakdown of storm reports submitted in Florida during the month of November (compiled from Southeast Regional Climate Center).
Agricultural and other climate related impacts. Topsoil and subsoil moisture levels were down from October, with only 55-60% at adequate or surplus levels at the beginning of the month. Winter grazing was planted in Gulf and Jackson counties, while peanut and cotton harvesting continued in parts of northern Florida. Vegetable harvesting continued in central Florida, while land preparation and planting continued in south Florida. Disease/pests were causing poor pasture conditions in parts of the state, though the cooler and drier weather also played a role in limiting pasture growth. Activity in the citrus growing region began to ramp up, with inconsistent sizes reported between oranges (golf ball to baseball sized) and grapefruit (larger than baseball), which were still smaller than normal. Dry conditions through the first part of November led to a decrease in soil moisture levels, both in topsoil and subsoil. Winter grazing was stressed in Jefferson County due to the lack of rain. Hay, sugarcane and vegetables continued to be harvested through central Florida. By the end of the month, topsoil moisture levels were 40% short and 45% adequate, and subsoil moisture levels had rebounded to 24% short and 61% adequate. Pasture and cattle conditions were fair to good (90% for both) statewide, despite the lack of rainfall. Widespread rain in the citrus growing areas helped, though the fruit size was small on early and midseason oranges.
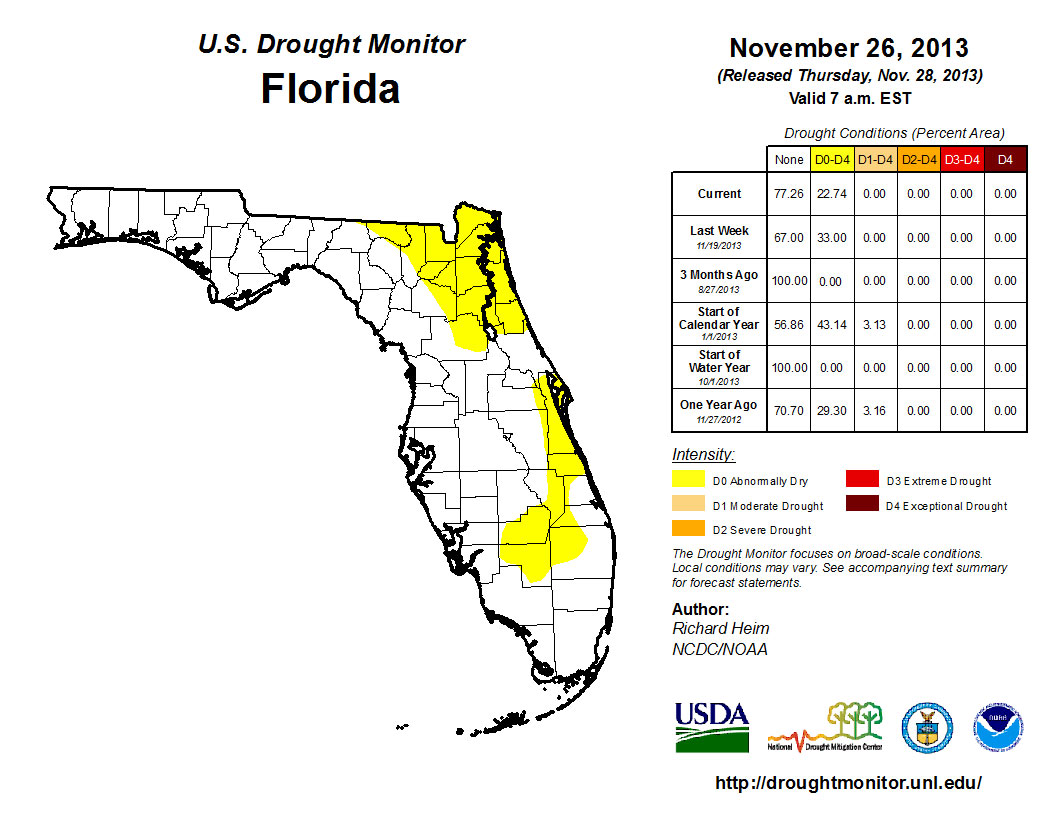
When the Drought Monitor was released on the 5th of November, the dryness from the previous week’s map (October 29th) had expanded and was reported along the Gold Coast and Monroe County, including the Florida Keys. By November 19th, all of the counties on the East Coast were reporting abnormally dry (D0) conditions. The D0 was also recorded in and around Lake Okeechobee and in portions of northern Escambia County. Rains in South Florida between the 19th and 26th eased the dryness along the immediate East Coast from Indian River through the Florida Keys. Throughout the entire month, the D0 conditions in North Florida were present, and even above normal rainfall for November in some of the area was not enough to ease drought concerns in that portion of the state. The CPC forecast for the next three-months is predicting below normal rainfall, so the chance of seeing more dry conditions, and potentially drought, introduced into the state remains high.
Figure 2: Drought conditions in Florida as of November 26, 2013 (courtesy of U.S. Drought Monitor).
Appendix 1: Additional November departures from normal data for Florida locations.
Appendix 2: Select daily maximum and minimum temperature records (° F) tied or broken during November (compiled from NOAA, NWS).
Prepared by Melissa Griffin and David F. Zierden.
Special thanks to Lauren Zuromski.
Florida Climate Center
The Florida State University
Tallahassee, FL
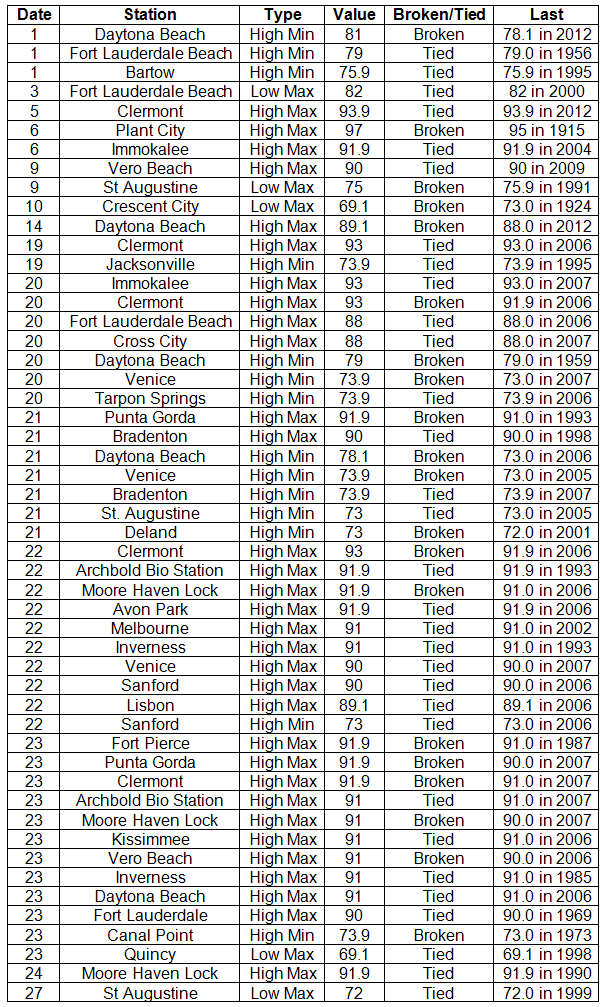
Average temperatures varied across the state in October. Average temperatures varied during October across the entire state (Table 1 and Appendix 1), though the majority of stations reported above normal temperatures. Departures from normal ranged from -0.8˚F in Ft. Lauderdale and Key West to 2.6˚F in St. Petersburg. Average temperatures for October 2013 were the 8th warmest on record in Miami, the 9th warmest at Key West and Orlando, and the 10th warmest in West Palm Beach. There were a number of low maximum and high minimum temperatures tied and broken during the month (Appendix 2).
Table 1: October average temperatures and departures from normal (°F) for selected cities.
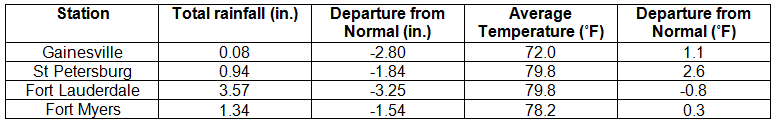
Rainfall totals varied across the state in October. There were a few pockets of near normal or slightly above normal rainfall (Flagler County) for October, but, on the whole, rainfall totals across the state were below normal for the month (Figure 1). Departures from normal roughly ranged from 0.54” to -3.89” (Table 2 and Appendix 1), though areas along the eastern coast of Florida saw rainfall totals that were as much as 5.00” below normal. October 2013 was the 2nd driest October on record for Orlando and Melbourne, the 3rd driest for Gainesville and West Palm Beach, the 4th driest for Vero Beach and the 7th driest for Naples. Numerous 24-hour precipitation records were broken for the month (Table 3).
Table 2: October precipitation totals and departures from normal (inches) for selected cities.
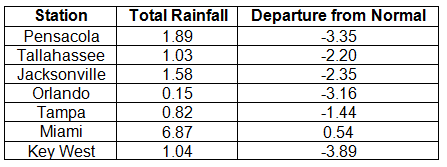
Table 3: Select daily rainfall records (inches) broken during October (compiled from NOAA, NWS).
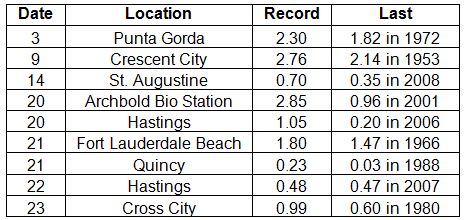
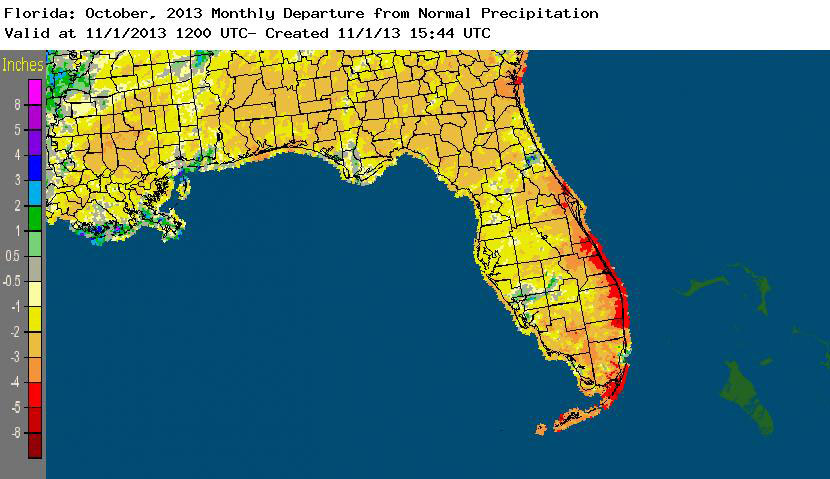
Figure 1: A graphical depiction of the monthly rainfall departure from normal (inches) for October is given in the figure below (courtesy of NOAA, NWS).
ENSO-neutral conditions continue in the Pacific. Neutral ENSO conditions continue to be reported for the equatorial Pacific, with the equatorial sea surface temperatures (SST) near average across much of the equatorial Pacific. ENSO-neutral conditions are favored to continue through the spring of 2014. The Climate Prediction Center (CPC) predicts normal temperatures and below normal precipitation for the state through January.
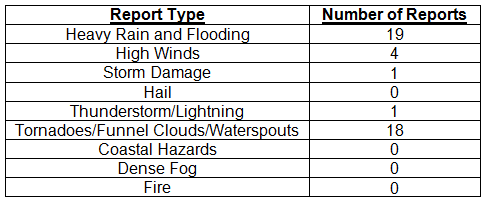
Hazardous weather events in October. In October, only 43 severe weather reports were made across the state. Flooding and heavy rains were reported in the Miami area on both the 2nd and 3rd, with a report of 6.73” from Pinecrest, FL, in the 24-hour period, causing numerous streets to flood. Between the 6th and 8th, 9 waterspouts were reported along the Florida Keys up the coast to Fort Lauderdale. On the 8th, a pilot and weather observer spotted a tornado on the property of MacDill Air Force Base.
Tropical Storm Karen. At the end of September, an area of disturbed weather formed in the Southwest Caribbean Sea, moved through the Yucatan Channel, and formed into Tropical Storm Karen on the 3rd of October. The forecasting models initially had Karen strengthening into a hurricane, but strong shear and dry air weakened the storm, and it deteriorated to a tropical depression on the 6th. While Karen threatened the Florida Gulf Coast, the storm caused increased wave heights and dangerous rip currents along north Florida. Many beaches posted double red flags, meaning that water was closed to the public.
Rough surf along Fort Walton Beach on October 5th:
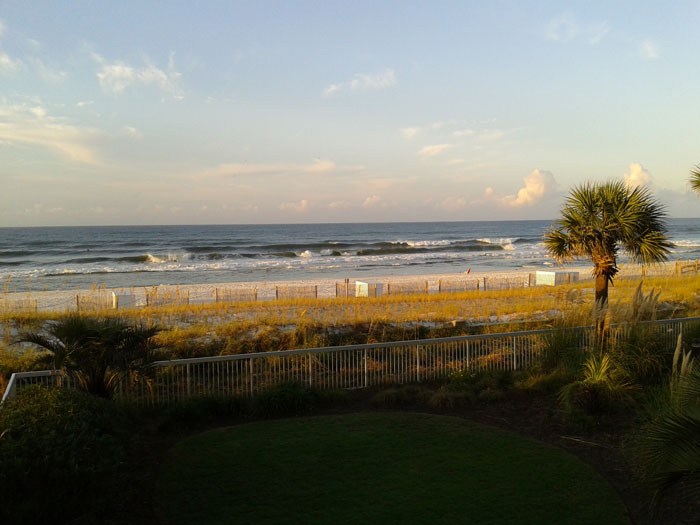
Table 4: Breakdown of storm reports submitted in Florida during the month of October (compiled from Southeast Regional Climate Center).
Agricultural and other climate related impacts. Topsoil and subsoil were near 100% at adequate or surplus levels at the beginning of the month. The majority of the peanut crop was reported in fair to good condition, with about 33% of the harvesting complete. Dry conditions led to increased harvesting activity in many counties: Jackson (cotton), Hamilton and Flagler (corn) and numerous Panhandle and Big Bend counties (hay). Bradford County prepared strawberry and planting green fields. Standing water, pests and drought limited the forage conditions. The lack of rainfall allowed peanut harvesting to be completed and the planting of winter forage to begin. Multiple crops (hay, soybeans, cotton, sugarcane) were actively harvested through the middle to the end of the month. Fieldwork for vegetables continued in most counties, though planting was behind schedule in Palm Beach County. The citrus growing area remained drought free and grove activities included resetting new tress, mowing, fertilizing and psyllid control. Winter grazing was stressed in Jefferson County, and the cotton yield was poor due to saturated soil in Jackson County. Sugar mills opened in Palm Beach County, and vegetable harvesting increased in most counties. By the end of the month, 33 of the 44 citrus packinghouses and seven of the 19 processing plants were open and small quantities were being shipped.
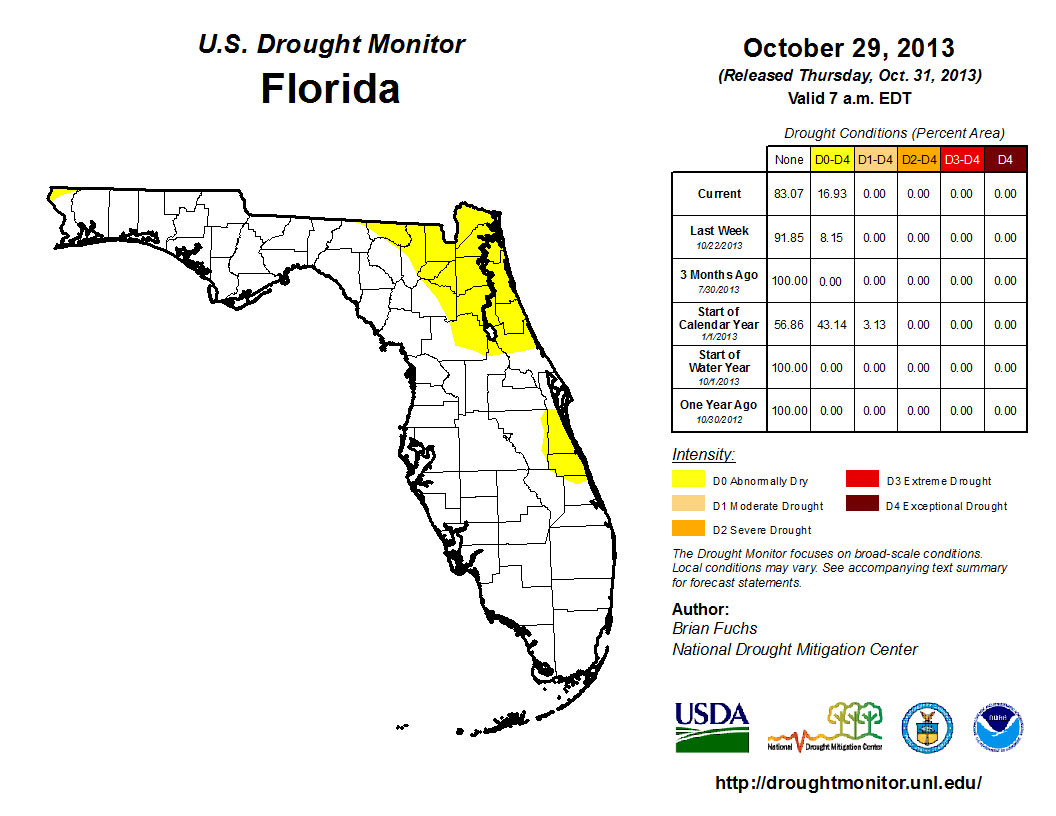
The combined below normal rainfall totals in September and October prompted the reintroduction of dry conditions (D0) toward the end of October. The D0 conditions were first identified in northeast Florida, around Jacksonville, St. Augustine, Glen St. Mary, Lake City and Orange Park. When the Drought Monitor was released on the 29th, the D0 category had doubled in spatial area and included all of Indian River County, portions of southern Brevard County and northwestern Escambia County. Statewide, normal November rainfall totals range from a low of 1.45” (Naples and Royal Palm Ranger Station) to a high of 5.40” (Niceville). Despite the lack of rainfall, Lake Okeechobee is reporting a lake water level of 15.23’ (as of November 1st) and South Florida water levels are well positioned for the start of the dry season. One month remains in the 2013 Hurricane Season, but any storms that form typically track away from Florida. The CPC forecast for the next three-months is predicting below normal rainfall, so the chance of seeing more dry conditions, and potentially drought, introduced into the state remains high.
Figure 2: Drought conditions in Florida as of October 29, 2013 (courtesy of U.S. Drought Monitor).
Appendix 1: Additional October departures from normal data for Florida locations.
Appendix 2: Select daily maximum and minimum temperature records (° F) tied or broken during October (compiled from NOAA, NWS).
Prepared by Melissa Griffin and David F. Zierden. Thanks to L. Zuromski.
Florida Climate Center
The Florida State University
Tallahassee, FL
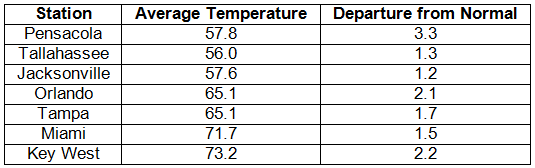
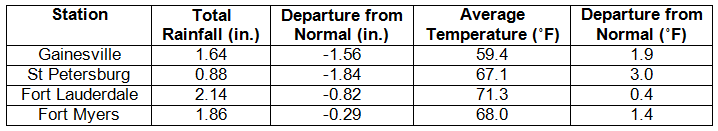
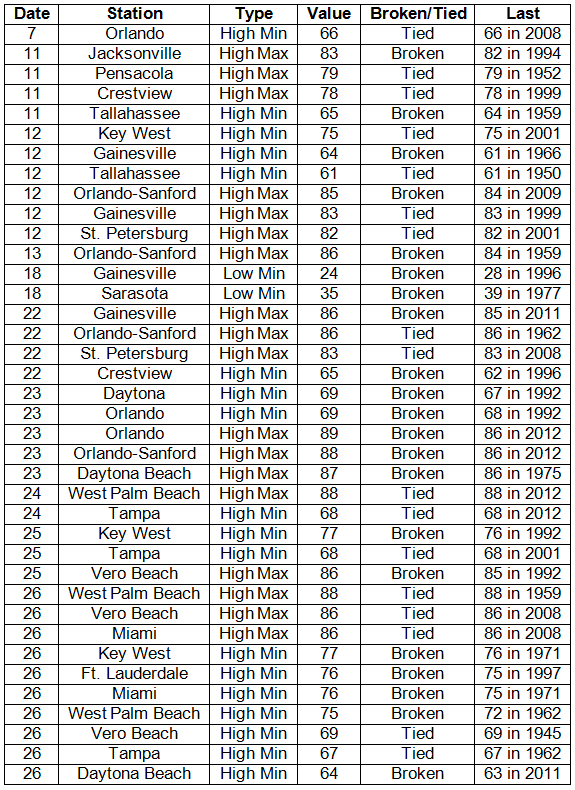
Average temperatures above normal across the state in February. Average temperatures were above normal for February across the entire state (Table 1 and Appendix 1). Departures from normal ranged from 0.4˚F at Fort Lauderdale to 3.0˚F in St. Petersburg. While February was warmer than normal, it was not nearly as warm as the record breaking average temperatures that were seen in January 2013. Overall, the average temperatures for the meteorological winter (Dec 1st- Feb 28th) were above normal across the state despite the cool December. Multiple maximum temperature or high minimum temperature records were either tied or broken (Appendix 2); there were only 2 record minimum temperatures that were broken in February.
Table 1: February average temperatures and departures from normal (°F) for selected cities.
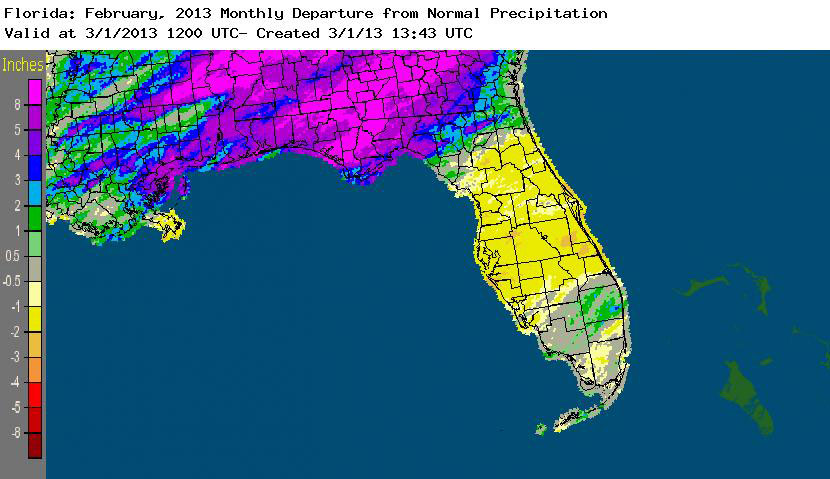
Rainfall totals varied across the state in February. Rainfall totals across the state varied in February (Table 2), with the Panhandle and Big Bend regions of the state reporting 3 to 8 inches above normal rainfall, while portions of the peninsula and south Florida were 1 to 3 inches below normal precipitation (Figure 1). February 2013 was the wettest on record for both Pensacola and Tallahassee. Multiple precipitation records were broken in February (Table 3), and three of those records were from Tallahassee during a 5-day-long significant rainfall event at the end of the month. The above normal rainfall helped eased drought conditions in some of the northern counties, but there are still drought concerns as the 3-month outlooks predict below normal rainfall for the spring dry season.
Table 2: February precipitation totals and departures from normal (inches) for selected cities.
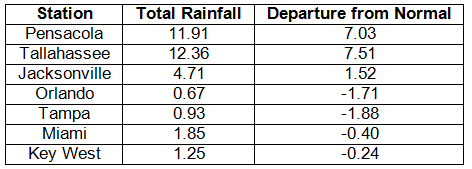
Table 3: Select daily rainfall records (inches) broken during February (compiled from NOAA, NWS).
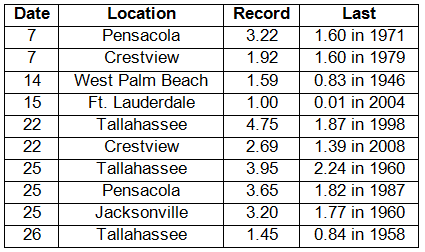
Figure 1: A graphical depiction of the monthly rainfall departure from normal (inches) for February is given in the figure below (courtesy of NOAA, NWS).
ENSO-neutral conditions continue in the Pacific. As of February 25th, neutral ENSO conditions continue to be reported for the equatorial Pacific. Equatorial sea surface temperatures (SST) are near average to below average across the Pacific Ocean. ENSO-neutral conditions are expected to continue through the spring. The atmospheric circulation during February was somewhat variable due to an active Madden-Julian Oscillation (MJO). The Climate Prediction Center (CPC) predicts above normal temperatures for the state; they are also predicting below normal precipitation for Florida through May.
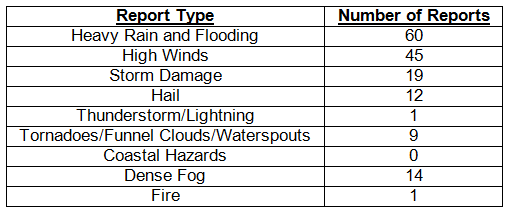
Hazardous weather events in February. February was a fairly active month for severe weather across the state when compared with January 2013. There were 161 severe weather reports made in the 28-day month. Multiple reports of a waterspout off the coast of Pidgeon Key were made on the 6th. On the 7th, a waterspout moved on shore near Santa Rosa Beach and caused some property damage. Also on the 7th, there were reports of high winds along the central west coast of Florida, with the highest wind report (42 mph) from downtown Tampa. A prescribed burn broke though a containment line near Barberville on the 11th and spread to 450 acres, prompting some evacuations and road closures. Also on the 11th, a severe thunderstorm produced hail and damaging winds in and around Panama City Beach along with multiple waterspouts off the coast of St. Andrew’s State Park. High winds were reported along the Keys and around the Fort Lauderdale area on the 14th. A tornado was reported in a store parking lot in Boynton Beach on the same day. Another round of highs winds was reported across southern portions of the state, as a strong cold front moved through the area on the 16th and 17th. Dense fog (visibilities less than 0.25 miles) was reported on the western side of Lake Okeechobee for three mornings (20th-22nd) in a row. Out of the 161 reports made for the month, 110 came from the storm event that started on February 22nd and ended on the 26th. Multiple heavy rain, storm damage, high wind, and flooding reports came in from the Panhandle and Big Bend regions. One severe thunderstorm produced pea- to golfball-sized hail as it moved east along I-10 between Dowling Park and Jacksonville. Many rivers in the area rose to at or above flood stage, as many locations saw over 8.00” during the 5 day event.
Table 4: Breakdown of storm reports submitted in Florida during the month of February (compiled from Southeast Regional Climate Center).
Agricultural and other climate-related impacts. At the beginning of February, the abnormally dry conditions caused problems for small grain crops that needed moisture to sustain normal growth. Irrigation continued across the state at a steady pace. The above normal temperatures caused many fruit and vegetable crops to mature ahead of schedule. Some portions of the Panhandle received some much-needed rain toward the middle of the month, benefiting the winter wheat crop. Citrus, sugarcane and winter vegetable harvesting continued, while areas that had not received substantial rain were irrigated due to lack of soil moisture. Producers were forced to take freeze protection measures in some portions of the state with a dip in temperatures in the middle of February. Only minimal damage was reported, though strong winds and rains in southern Florida slowed production. Heavy rainfall in the Panhandle at the end of the month helped the developing winter wheat crop but caused flooding concerns as well. Most of the state remained dry, and irrigation was continued in many locations. A freeze caused some damage to potato fields, though no reports of major damage were seen.
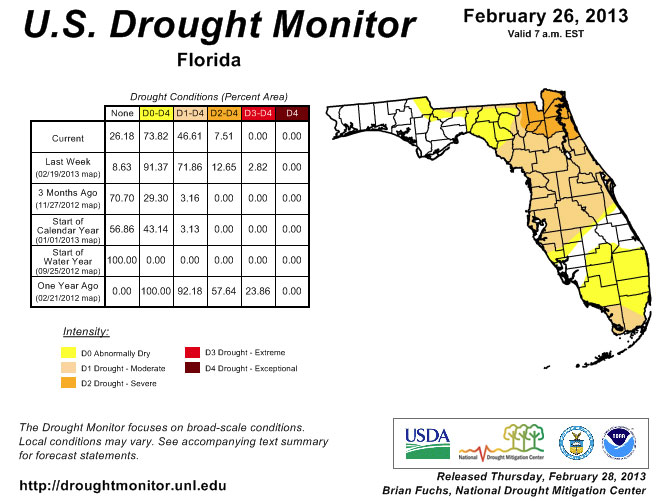
Statewide rainfall totals varied greatly across the state during February. Comparing the January 29th release of the drought monitor to the one that was posted on February 26th only tells part of the drought story in Florida. In the first week of the month, additional areas of D1 (moderate drought) were added to coastal portions of Dade, Monroe and Palm Beach counties, while the rest of the state remained unchanged. That area was expanded on the 12th to include all of Monroe County and most of Dade County and was extended north from Palm Beach County into Broward County. By the time the Drought Monitor was posted on the 19th, things had drastically changed. The area of the state that was covered by D1 had expanded from 36% to 72%, and a small area of D3 (extreme drought) had been added along the Florida and Georgia state line. The only parts of the state that remained drought free were portions of Charlotte, Lee, Glades, Highlands, Okeechobee, Indian River, St. Lucie and Martin counties. Things rapidly changed toward the end of February after torrential rains inundated portions of the Panhandle and Big Bend. The rains managed to ease the moderate and severe drought conditions in a lot of the counties in this region. Most of the major rivers are at or above flood stage, and there are reports that wells are coming up as some of this heavy rain makes it into the water table. Despite some of the state receiving the needed rain, the rest of north Florida and the Peninsula are still dealing with drought conditions as we start to transition to the spring dry season.
Figure 2: Drought conditions in Florida as of February 26, 2013 (courtesy of U.S. Drought Monitor).
Appendix 1: Additional February departures from normal data for Florida locations.
Appendix 2: Select daily maximum and minimum temperature records (° F) tied or broken during February (compiled from NOAA, NWS).
Prepared by Melissa Griffin and David F. Zierden. Thanks to L. Zuromski.
Florida Climate Center
The Florida State University
Tallahassee, FL
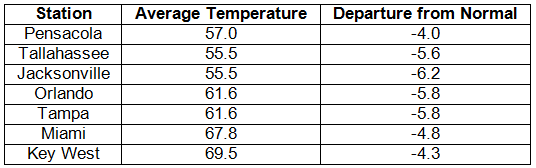
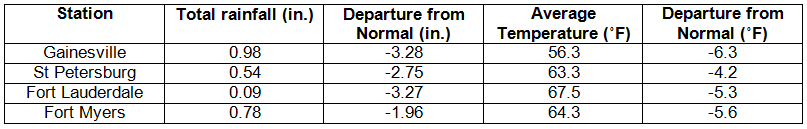
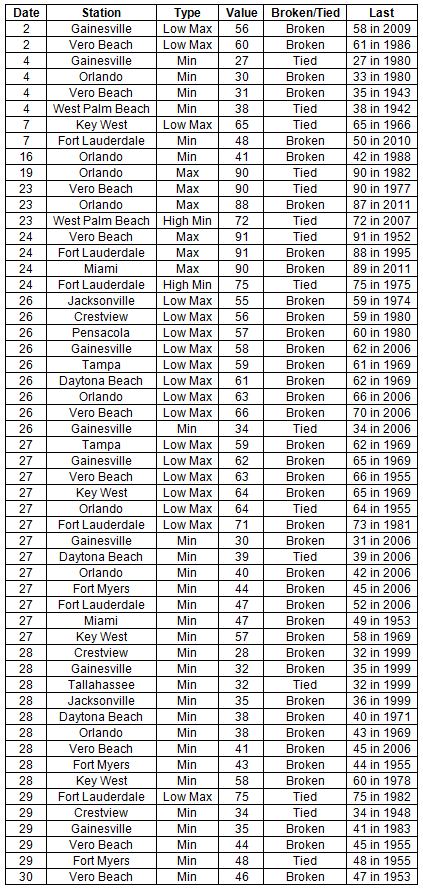
Average temperatures well below normal across the state in March. Average temperatures were well below normal for March across the entire state (Table 1 and Appendix 1). Departures from normal ranged from -4.0˚F to -6.0˚F across Florida, and there are reports of some locations that were -8.0˚F below normal. Overall, the average temperatures for March 2013 were colder than meteorological winter (Dec 1st- Feb 28th) and were significantly different than March 2012, when some locations were more than 6.0˚F above the normal. March 2013 was the 2nd coldest at both Jacksonville and Gainesville, the 5th coldest at Tallahassee and Tampa, the 6th coldest at Fort Myers, the 7th coldest at Pensacola, Orlando and St. Petersburg and the 8th coldest in Key West. Multiple maximum temperature or high minimum temperature records were either tied or broken (Appendix 2); there were only 2 record minimum temperatures that were broken in February.
Table 1: March average temperatures and departures from normal (°F) for selected cities.
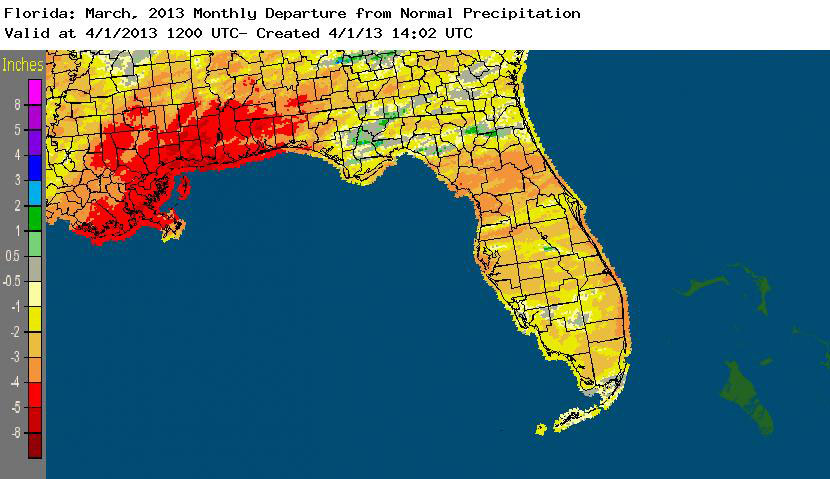
Rainfall totals varied across the state in March. Rainfall totals across the state varied in March (Table 2), though most of the state reported totals that were below normal. Localized portions of the northeast Florida and Big Bend regions recorded above normal rainfall (+1-2”), while the peninsula and Panhandle were 2 to 5 inches below normal precipitation (Figure 1). March 2013 was the 5th driest on record at Pensacola, and only 35 precipitation records were broken in March — 11 of those records were for totals under an inch (Table 3). There are still drought concerns as the 3-month outlooks predict below normal rainfall for the spring dry season.
Table 2: March precipitation totals and departures from normal (inches) for selected cities.
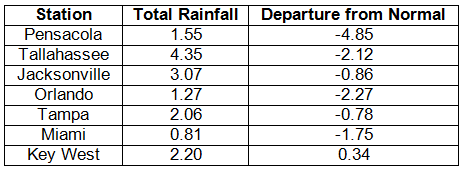
Table 3: Select daily rainfall records (inches) broken during March (compiled from NOAA, NWS).
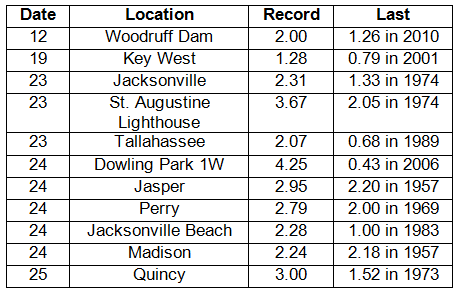
Figure 1: A graphical depiction of the monthly rainfall departure from normal (inches) for March is given in the figure below (courtesy of NOAA, NWS).
ENSO-neutral conditions continue in the Pacific. As of April 1st, neutral ENSO conditions continue to be reported for the equatorial Pacific. Equatorial sea surface temperatures (SST) are near average to below average across much of the Pacific Ocean. ENSO-neutral conditions are favored to continue through the summer 2013. The atmospheric circulation during over the last couple of months has been somewhat variable due to an active Madden-Julian Oscillation (MJO). The Climate Prediction Center (CPC) predicts above normal temperatures for the state, and they are also predicting below normal precipitation for Florida through June.
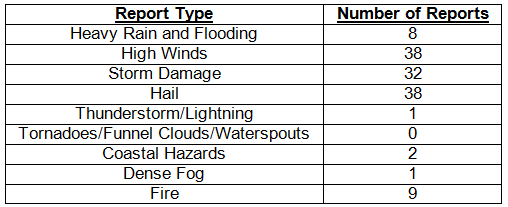
Hazardous weather events in March. March was a somewhat active month for severe weather across the state, with 129 severe weather reports made during the entire month. The month started out with multiple reports of fires near Daytona Beach, Ocklawaha, and Juniper Springs. The Hopkins Prairie Wildfire grew to over 1900 acres and destroyed 10 homes in Marion County. Low astronomical tides were seen on the 6th at Mayport and Dungeness due to tidal levels that were reported below the mean low water level and were also 1.0 to 1.5 ft below the predicted tidal level. Dense fog on the 20th reduced visibilities to less than ¼ mile near Ortona along State Road 78. Also on the 20th, a severe thunderstorm produced high winds and reports of nickel-sized hail in and around the Miami area.
From March 23rd to 25th, 103 of the 129 severe weather reports were recorded. A low pressure system in Louisiana set up an interesting weather event as a warm front lifted through the Panhandle on the 23rd and 24th, spawning one round of severe weather, and a second round of severe weather hit the state as the cold front pushed through on the 24th and 25th. On the morning of the 23rd, numerous hail reports came in from locations along the Florida Panhandle and Big Bend, including Panama City Beach, Wewahitcha, Altha, Chattahoochee, and Wakulla Springs. Hail sizes ranged from dime (0.75”) to quarter (1.00”) at these locations. One particularly strong thunderstorm moved east along and parallel to I-10 from Tallahassee toward Jacksonville and triggered multiple reports of hail and storm damage. An Emergency Manager in Bradford County received reports of baseball-sized hail (2.75”) near Lawtey, FL. In addition to the hail and winds, an observer in Lake City reported that over 2.00” of rain had fallen in a 30 minute time period as this storm moved through the area. The same severe thunderstorm caused heavy rains, storm damage and more hail reports as it moved into the town of St. Augustine. Later on the 23rd, lightning caused a house fire in Milton, and storm total rainfall over 2.50” were reported by observers in and around Jacksonville. The 24th saw more reports of storm damage and high winds across much of the Panhandle, Big Bend and northern peninsula of the state. A measured wind gust of 75 mph was taken at the Orlando International Airport, and a gust of 86 mph was measured in the Lake Buena Vista area. Dime to quarter sized hail was reported across the central part of the state from Tampa to Orlando to Titusville. Trees were uprooted and numerous homes sustained damage as the cold front pushed through the area.
Table 4: Breakdown of storm reports submitted in Florida during the month of March (compiled from Southeast Regional Climate Center).
Agricultural and other climate-related impacts. At the beginning of March, producers in northern Florida were busy assessing crops for damage following a second week of freezing temperatures and heavy rains. While much of the state received minimal to no moisture, portions of the Panhandle had accumulated more than 5 inches during the first week. Winter wheat benefited from the recent rains, and moderate to heavy bloom was observed across the state’s citrus region. The second week in March brought more cold weather to the state, with more than half the state recording sub-freezing temperatures. Citrus producers maintained heavy irrigation in their orchards as bloom progressed, but the dry conditions continued to hamper the citrus region. Winter vegetable harvest was in full swing, though producers assessed fields for damage from the cold snaps and strong winds. From March 11th to 17th, growers were irrigating one to two times a week in the citrus belt to keep moisture in the ground and on the trees. Cold weather lingered in Florida and slowed vegetable growth in some areas. Land in the Panhandle was being prepared for peanuts. Strawberry harvesting started earlier than expected. By the end of the month, topsoil moisture levels across the state improved slightly, though irrigation continued in areas still impacted by drought conditions. Unseasonably low temperatures left many fruit and vegetable growers worrying about late season frost damage. Peanuts and corn were planted in the Panhandle, while sugarcane harvest was winding down for the season.
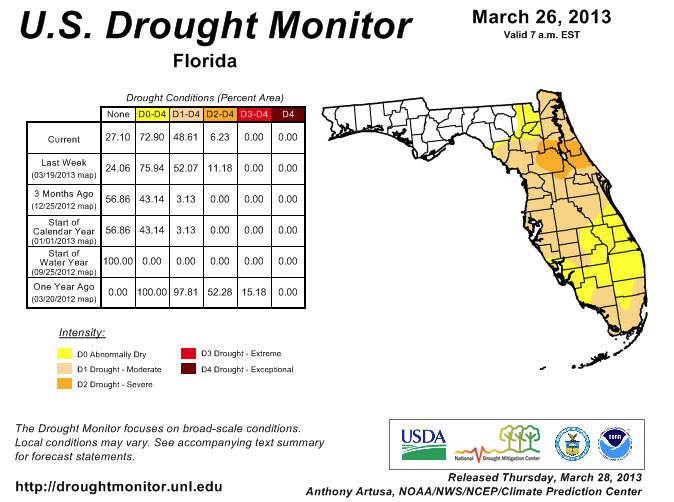
While the statewide rainfall totals varied greatly across the state during March, most of the state saw below normal rainfall during the month. Since the release of the drought monitor on February 26th, the Panhandle has remained drought free, while the Peninsula and north Florida have continued to be plagued by dryness. The areas of moderate drought have expanded to cover about 48% of the state, including much of central Florida and portions of Broward, Collier, Dade, and Monroe counties. The area of severe drought in northern Florida has eased due to the heavy rains at the end of March, now only reported in Flagler, Lake, Marion, Putnam, and Volusia counties. Now that the state has officially entered spring, the normal rainfall during the months of April and May are some of the lowest for the year at many locations. The CPC has predicted that the three-month rainfall amounts for April, May and June will be below these normal values, which could put the state at a greater risk of a worsening drought.
Figure 2: Drought conditions in Florida as of March 26, 2013 (courtesy of U.S. Drought Monitor).
Appendix 1: Additional March departures from normal data for Florida locations.
Appendix 2: Select daily maximum and minimum temperature records (° F) tied or broken during March (compiled from NOAA, NWS).
Building A, Suite 292
Tallahassee, FL 32306-2741
Phone: (850) 644-3417 | (850) 644-0719
climate@coaps.fsu.edu