


The Florida Climate Center serves as the primary resource for climate data, information, and services in the state of Florida.

The Florida Climate Center achieves its mission by providing climate monitoring, research, and expertise to be applied by the people, institutions, and businesses of Florida and the surrounding region.
We provide direct service by fulfilling requests for climate and weather data and information in a variety of formats.
We perform research that advances the understanding of the climate variability and changes of Florida and the surrounding region.
We provide outreach in presentations and at events aimed at a variety of groups, interests, and ages.
Prepared by Melissa Griffin and David F. Zierden.
Florida Climate Center
The Florida State University
Tallahassee, FL

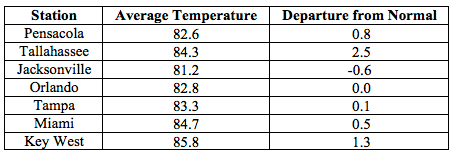
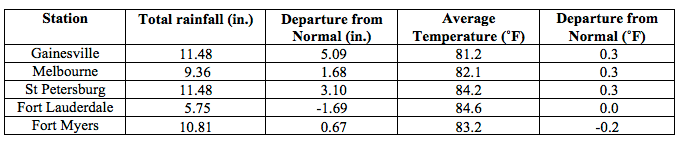
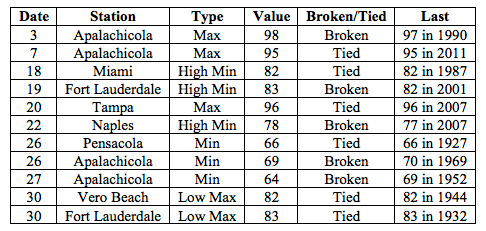
Average temperatures were above normal across most of the state in August. The departures from average temperatures in August 2015 were near normal to above normal across the entire state, ranging from -0.6˚F in Jacksonville to 2.5˚F in Tallahassee (Table 1 and Appendix 1). Despite the warm average temperatures across the state, none of the major reporting stations had a day with maximum temperatures at or above 100˚F. August 2015 was the 4th warmest in Tallahassee, 5th warmest in Vero Beach, 7th warmest in Fort Lauderdale, 9th warmest in Key West, and the 10th warmest in Miami. Multiple maximum and minimum temperature records were tied or broken across the state in August (Appendix 2).
Table 1: August average temperatures and departures from normal (˚F) for select cities.
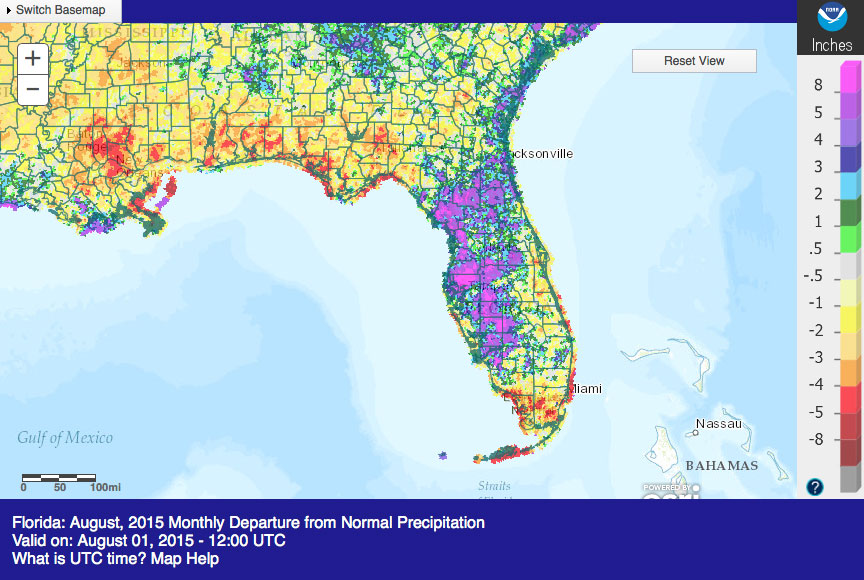
Rainfall totals were varied across the state in August.Portions of the western coast of Florida had well above normal rainfall, while the Panhandle and southern Florida recorded below normal rainfall (Figure 1). Departures from normal roughly ranged from -1.69” to 8.73” (Table 2 and Appendix 1), though localized parts of the state saw rainfall totals that were as much as 5.00” below normal to 8.00” above normal (Figure 1). August 2015 was the 3rd wettest in Tampa and Orlando. There were multiple 24-hour precipitation records broken for the month (Table 3).
Table 2: August precipitation totals and departures from normal (inches) for select cities.
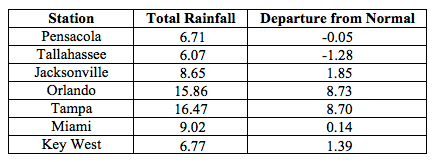
Table 3: Select daily rainfall records (inches) broken during August (compiled from NOAA, NWS).
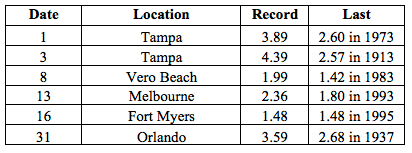
Figure 1: A graphical depiction of the monthly rainfall departure from normal (inches) for August is given in the figure below (courtesy of NOAA, NWS).
El Niño Conditions are Present in the Pacific.
Based on current data and forecast models, the Climate Prediction Center (CPC) will keep the ENSO Alert System at an El Niño Advisory. El Niño conditions are present, and positive equatorial sea surface temperatures (SST) anomalies continue across most of the Pacific Ocean. There is approximately a 90% chance that El Niño conditions will continue through the Northern Hemisphere winter 2015-2016, and around an 85% chance it will last into early spring 2016. CPC predicts above normal temperatures and normal precipitation across the state through November 2015.
Hazardous Weather Events in August.
There were a total of 398 severe weather reports made in Florida during August. An area of low pressure in the eastern Gulf of Mexico brought heavy rains across portions of Central Florida for the first three days (1st-3rd) in August. Major flooding was reported in the greater Tampa Bay area, communities along the Coast, and interior Peninsula locations. Road were impassable in some locations and rising rivers and streams cause evacuations in some low-lying areas. On the evening of the 3rd, after funnel clouds were observed and photographed in Delray Beach and an EF0 tornado was reported near Florida Gardens and Riviera Beach. Damage from the tornado was minimal with minor structural damage and downed trees reported. Strong thunderstorms on the 7th caused storm damage across portions of the Big Bend and northeastern Florida. Jacksonville, Lake City, and Tallahassee were just a few of the locations that reported downed trees from the storms. A tornado briefly touched down on the 8th near Indian Pass, FL (Gulf County) causing minor tree damage. Forty Army Rangers were evaluated and 21 were hospitalized after a lightning strike on Eglin Air Force Base on the 12th. The Rangers were performing lightning training protocols at the time of the incident. On the 14th, the Hendry County Sheriff’s Office reported minor damage to a shed and trees from an EF0 tornado just outside of Clewiston, FL. Lightning struck a home near the University of North Florida in Duval County on the 19th and lightning started an apartment fire the following day in the same area. On the 29th, lightning caused electrical damage to a home in Fort Myers, FL. Various convective and sea breeze thunderstorms caused hail, high winds, storm damage and heavy rains across the state during the entire month of August.
Table 4: Breakdown of storm reports submitted in Florida during the month of August (Compiled from Southeast Regional Climate Center.)
Agriculture Related Impacts.
At the beginning of August, topsoil moisture levels were at mainly adequate, though some surplus values were reported across the state. Corn harvest was underway in Jackson, Walton, Madison and Hamilton counties. Hay was baled in Washington County and army worms were in abundance in Pasco County. Heavy rains at the end of July and beginning of August in southern portions of the Big Bend caused flooded fields. Mold and mildew was reported in crops in Taylor, Dixie, Levy, Citrus, Hernando and Pasco counties. Pastures across the state were in good condition, though some areas had standing water in low-lying areas. Counties in southwest Florida continued to prepare land for the fall planting season. By the middle of the month, Panhandle crops were starting to show stress due to the warm temperatures and lack of rainfall. Standing water in fields and pastures was still an issue for counties in the Big Bend and central Florida and some ranchers were selling off cattle. Peanut pegging was about 98% complete by the end of the month. White mold was found in peanuts and the kudzu bug was causing issues with soybeans in Okaloosa County. The sugarcane crop received needed rain and looked in good condition. Orange groves in the western growing region were inaccessible due to high water, and the some fall vegetable planting was delayed due to soggy fields. Elsewhere, irrigation was being used in areas of the state impacted by continued drought conditions.
Drought Related Impacts.
At the end of July, nearly 40% of the state was experiencing abnormally dry (D0) or drought conditions, with the main concentration along the east coast of the state, the Big Bend, and in portions of northeastern and southern Florida. By August 4th the area of D0 in the western Panhandle counties was extended along the coastal portions of Bay County and moderate (D1) conditions were introduced into Santa Rosa County, while beneficial rains eased some of the drought conditions from Brevard County to Palm Beach County. As the month progressed, D0 in the southern part of the state expanded back into Collier and Hendry counties while the area of extreme (D3) drought shifted away from the coastal portions to the interior of Dade and Broward counties and D3 was reported in Monroe County. By the end of the month, rainfall in the northeast region had eased most of the D0 conditions, with the exception of lingering dryness in Volusia County. The lack of rainfall led to the expansion of D0 across most of the Panhandle counties. In South Florida, there was a slight expansion of severe (D2) and D3 drought conditions across Broward, Dade and Monroe counties. Based on census data, roughly 5.5 million Florida citizens are currently being impacted by drought conditions reported in nearly 40% of the state. At the end of the month, the water level in Lake Okeechobee increased to just over 13 ft., mainly due to rainfall across the northern part of the basin.
Appendix 1: Additional August departures from normal data for Florida locations.
Appendix 2: Select daily maximum and minimum temperature records (° F) tied or broken during August (compiled from NOAA, NWS).
Prepared by Melissa Griffin and David F. Zierden.
Florida Climate Center
The Florida State University
Tallahassee, FL
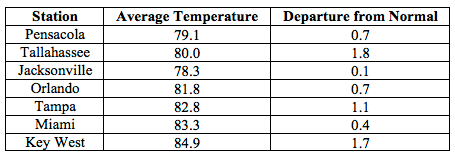
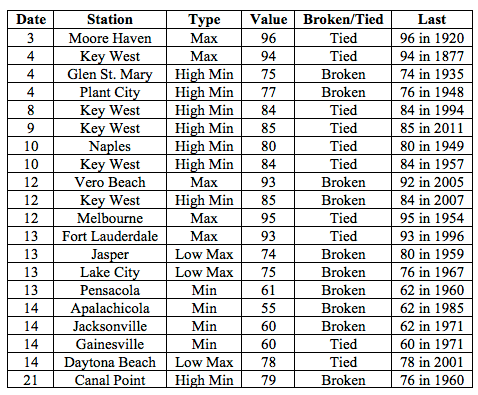
Average temperatures were above normal across the state in September The departures from average temperatures in September 2015 were near normal to above normal across the entire state, ranging from -0.3˚F in Fort Myers to 1.8˚F in Tallahassee (Table 1 and Appendix 1). Despite the warm average temperatures across the state, none of the major reporting stations had a day with maximum temperatures at or above 100˚F. September 2015 was the 3rd warmest in Miami and Vero Beach, 6th warmest in Key West and Tampa, 9th warmest in Orlando and the 10th warmest in St. Petersburg. Multiple maximum and minimum temperature records were tied or broken across the state in September (Appendix 2).
Table 1: September average temperatures and departures from normal (˚F) for selected cities.
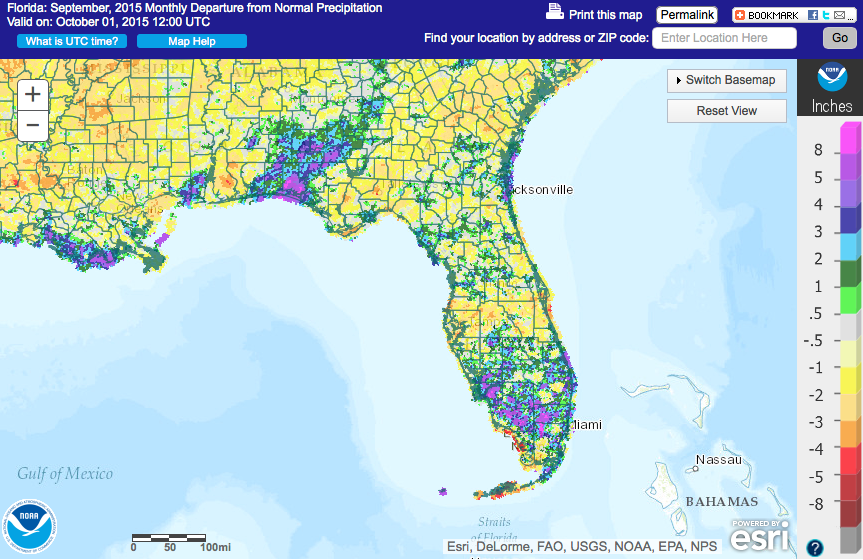
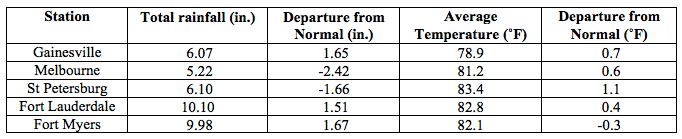
Rainfall totals were varied across the state in September. Portions of the western Florida Panhandle and South Florida reported above normal rainfall for the month, while the Big Bend and parts of the Peninsula observed below normal rainfall totals (Figure 1). Departures from normal roughly ranged from -2.42” to 1.67” (Table 2 and Appendix 1), though localized parts of the state saw rainfall totals that were as much as 5.00” below normal to 8.00” above normal (Figure 1). September 2015 was the 7th wettest in Miami and the 10th wettest in Naples. There were multiple 24-hour precipitation records broken for the month (Table 3).
Table 2: September precipitation totals and departures from normal (inches) for select cities.
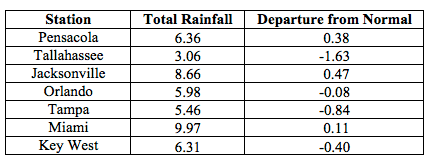
Table 3: Select daily rainfall records (inches) broken during September (compiled from NOAA, NWS).
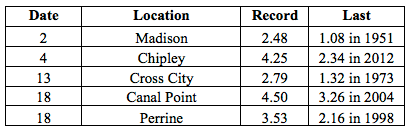
Figure 1: A graphical depiction of the monthly rainfall departure from normal (inches) for September is given in the figure below (courtesy of NOAA, NWS).
El Niño Conditions are Present in the Pacific.
Based on current data and forecast models, the Climate Prediction Center (CPC) will keep the ENSO Alert System at an El Niño Advisory. El Niño conditions are present, and positive equatorial sea surface temperatures (SST) anomalies continue across most of the Pacific Ocean. There is approximately a 95% chance that El Niño conditions will continue through the Northern Hemisphere winter 2015-2016, and gradually weaken through spring 2016. CPC predicts above normal temperatures and precipitation across the state through December 2015.
Hazardous Weather Events in September.
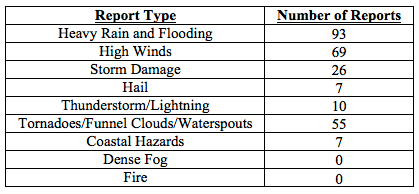
There were a total of 267 severe weather reports made in Florida during September. On September 2nd, lightning struck an elementary school in Duval County, FL. The school was evacuated after smoke from a damaged AC unit filtered into the building. Lightning, associated with a strong thunderstorm, caused power outages in Chipley, FL (Washington County) on the 3rd. A home was destroyed in Winter Garden, FL (Orange County) on the 4th. The Gold Coast experienced flooding, high winds, pea-to-nickel sized hail, and had multiple reports of funnel clouds during the 4th and 5th of September. Lightning from this event started a house fire in Broward County on the 5th, and there were numerous reports of waterspouts offshore of Fort Lauderdale and Miami beaches on the same day. A person was injured while working at Palm Beach International Airport on the 8th when lightning struck her out on the tarmac. A severe storm moved through the Gainesville, FL (Alachua County) area on the 12th, causing reports of storm damage before it spawned two tornadoes in Branford County. The first tornado touched down near Sampson, FL and the second one touched down outside of Starke, FL. Both tornadoes were confirmed to have maximum wind speeds of 85 mph (EF0) and caused damage to structures and trees. On the 14th and 15th, a stationary front positioned across South Florida produced high winds along many locations in the Florida Keys. An EF0 tornado was confirmed near Southwest Ranches, FL (Broward County) as a severe storm moved through the Hollywood, FL area. Due to the effects of the Supermoon from September 24th – 30th, coastal locations along the Atlantic Ocean and Gulf of Mexico reported high tides above normal forecasted levels. The higher tides led to flooding of coastal roads and some urban areas. An area of localized heavy rainfall impacted counties in western part of the Florida Panhandle on the 28th through the 29th. Rainfall totals from the event ranged from 2.00” to over 12.00” in some locations. A waterspout moved onshore near Pelican Beach, FL (Collier County) on the 29th, and kicked up debris and snapped braches of trees before dissipating.
Table 4: Breakdown of storm reports submitted in Florida during the month of September (Compiled from Southeast Regional Climate Center.)
Agriculture Related Impacts.
At the beginning of September, soil moisture was adequate across 66% of the state, with about 23% of Florida at a surplus. The extended drought in the Panhandle, and spider mites, reduced peanut yields. Some counties that experienced heavy rains had fields with standing water and harvesting of hay, rice, and peanuts had yet to take place. Army worms were still a problem in some hay fields. Fall planting started in many counties in the Peninsula and southwest Florida. By mid-month, hay quality ratings were starting to decline for fields being stressed by too much or too little rain, or infestations of caterpillars or grasshoppers. Low lying fields in portions of South Florida were flooded due to heavy rains and frequent thunderstorms delayed planting. Other South Florida locations in the drought-impacted areas were still running irrigation. Cotton in some counties was defoliated to prepare for harvest. At the month’s end, peanut harvesting had reached 47% completion and corn harvesting had been delayed due to rain. Drier conditions allowed southwestern growers to get back on schedule with planting and land preparation. Pasture conditions in Flagler and Putnam counties showed signs of nutrient loss due to standing water. Statewide, cattle conditions were mostly good. Rains throughout September ended the drought conditions in the entire citrus producing area. Trees and fruits were in good shape and growers were preparing for early tangerine and grapefruit harvesting.
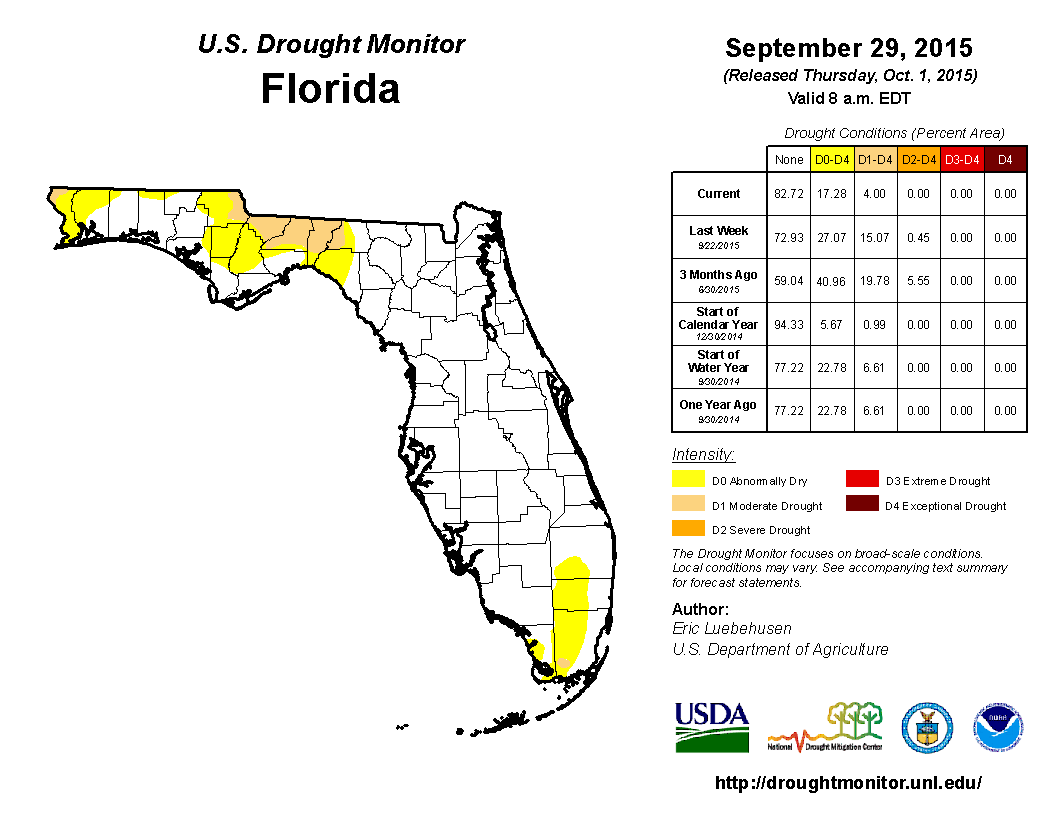
Drought Related Impacts.
At the end of August, nearly 40% of the state was experiencing abnormally dry (D0) or drought conditions, with the main concentration along the east coast of the state, the Big Bend, and the Florida Panhandle. Extreme drought (D3) was being reported in interior portions of Broward, Dade, and Monroe counties. Rainfall at the beginning of the month helped ease some of the drought conditions along the Gold Coast, but dry persistent conditions in the northern part of the state caused an increase in the amount of area affected by moderate drought (D1). Consistent rains in South Florida caused the removal of D3 and the overall improvement of the drought-impacted region. However, drought conditions in the Panhandle continued due to the lack of rainfall. Toward the middle of the month, rainfall in portions of Franklin, Gulf and Wakulla counties removed all mention of drought, while the rains in South Florida improved the overall dry conditions, and reduction of D2 from the state. At the end of the month, an extremely localized rainfall event impacted the western Panhandle counties. The rainfall totals, between 6 and 12”, prompted the removal of both D1 and D0 conditions from coastal areas in the region. Based on census data, the number of those impacted by drought during the month dropped from roughly 5.5 million Florida citizens to approximately 450,000 and drought conditions are currently reported in nearly 17% of the state. At the end of the month, the water level in Lake Okeechobee had increased to 14.73 ft., due to rainfall across the basin.
Appendix 1: Additional September departures from normal data for Florida locations.
Appendix 2: Select daily maximum and minimum temperature records (° F) tied or broken during September (compiled from NOAA, NWS).
Prepared by Melissa Griffin and David F. Zierden.
Florida Climate Center
The Florida State University
Tallahassee, FL
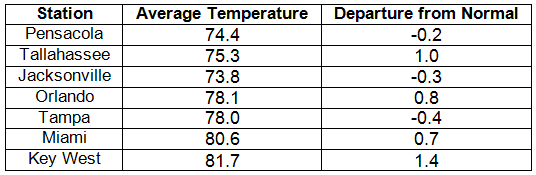
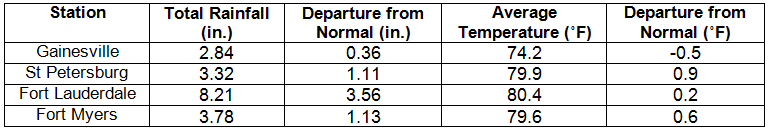
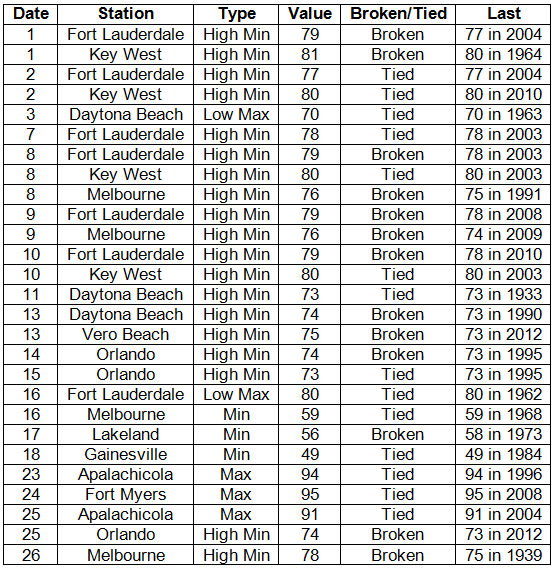
Average temperatures varied across the state in May. The departures for average temperatures in May 2014 varied across the entire state, though most of the reporting stations saw average temperatures above normal. The departures ranged from -0.5˚F in Gainesville to 1.4˚F in Key West (Table 1 and Appendix 1). With the exception of Key West, most of the major reporting stations across the state reported at least 1 day above 90˚F, and all of the stations reported more than 10 days with a high above 80˚F. There were multiple maximum and high minimum temperatures that were broken or tied (Appendix 2).
Table 1: May average temperatures and departures from normal (inches) for select cities.
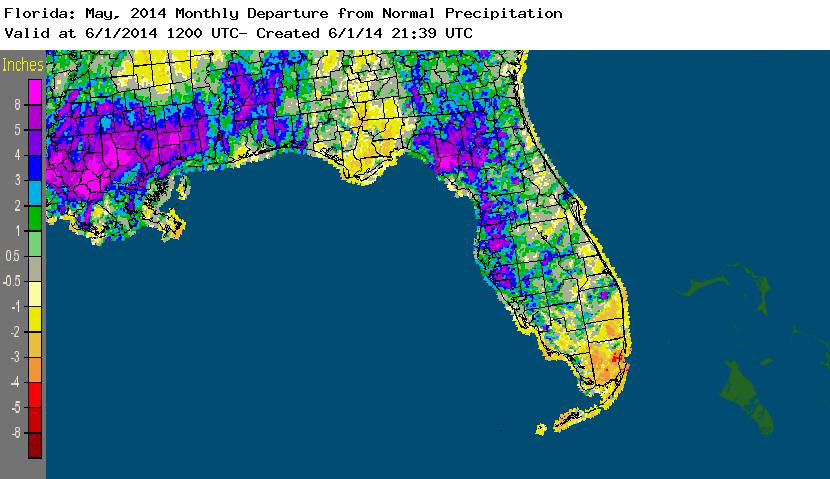
Rainfall totals varied across the state in May. Portions of the northwestern Panhandle, the Nature Coast, and north Florida reported monthly rainfall totals well above normal, while the rest of the state saw below average rainfall during May (Figure 1). Departures from normal roughly ranged from -2.36” to 6.44” (Table 2 and Appendix 1), though localized parts of Florida saw rainfall totals that were as much as 5.00” below normal to over 8.00” above normal. May 2014 was the 4th wettest on record at Tampa. There were multiple 24-hour precipitation records broken for the month (Table 3).
Table 2: May precipitation totals and departures from normal (inches) for select cities.
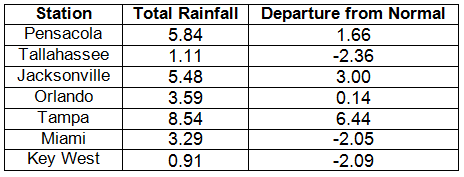
Table 3: Select daily rainfall records (inches) broken during May (compiled from NOAA, NWS).
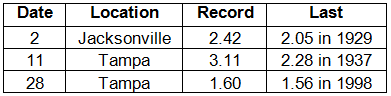
Figure 1: A graphical depiction of the monthly rainfall departure from normal (inches) for May is given in the figure below (courtesy of NOAA, NWS).
ENSO-neutral conditions continue in the Pacific. Based on current data and forecast models, the Climate Prediction Center (CPC) continues to have an El Niño Watch in place. Though Neutral ENSO conditions continue to be reported, the equatorial sea surface temperatures (SST) were above average across the equatorial Pacific. ENSO-neutral conditions are favored to continue through the remainder of spring, and there is a greater than 65% chance of an El Niño forming by summer. CPC predicts above normal temperatures across the entire state and normal precipitation through August 2014.
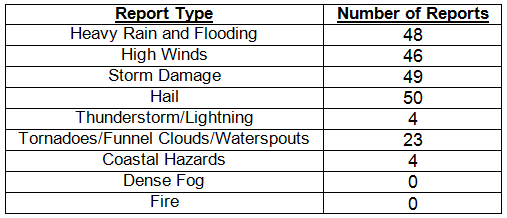
Hazardous weather events in May. There were a total of 224 severe weather reports made in Florida during May. The month started off with thunderstorms producing high winds, dime to quarter sized hail and storm damage in the Jacksonville area, along portions of coastal Brevard County, and near Sanford, FL, and a funnel cloud was reported by the public north of Palm Bay. Heavy rains caused flooding in Temple Terrace, FL, on the 2nd, and another funnel cloud was reported near Sarasota. Multiple reports of high winds (wind gusts up to 55 mph) on the 3rd were made from various locations across southern Florida, including Fort Lauderdale, the Florida Keys, Captiva Island, and Fort Myers. Strong thunderstorms pushed through Jacksonville, Lake City, Gainesville, and other portions of north Florida on the 11th, causing high winds, storm damage, and reports of penny sized hail. On the 13th, one person was injured off the coast of Little Talbot Island when they nearly drowned after being caught in a rip current. Three beach rescues, due to strong rip currents, were reported being done on the same day on Jacksonville Beach. May 14th and 15th were a very active day across the state as severe thunderstorms (with high winds and hail that caused damage) and flooding rains impacted portions of the northwest Panhandle, Big Bend, and along the Suncoast. One person died after being struck by lightning in Seminole, FL, on the 14th. An EF-1 tornado traveled about ½ mile near Wellborn, FL, on the 15th, uprooting many large trees and snapping sheet metal; pieces of lumber were impaled 1-2 ft. into pasturelands. Lightning struck a boat in Gainesville and caused a fire that destroyed the vessel. In Dade County on the 15th, multiple reports of water spouts off the coast of Fisher Island and South Beach were made by trained spotters, while an EF-0 tornado damaged small trees, some street signs, and a vehicle in Doral, FL. The sea breeze initiated some strong thunderstorms on the 25th and 26th, with hail (ranging from pea to quarter sized) reported in the Panhandle, Big Bend, Jacksonville area, and also along the coastal counties of West Florida and portions of south Florida. On the 28th, a 21-year old died after being caught up in high surf and rip currents near Navarre Beach, FL. Two men were struck by lightning while they worked on the roof in Sea Ranch Lakes, FL, and lightning killed several head of cattle in Starke on the 29th. On the same day, localized flooding over Walton County caused rivers to rise just south of DeFuniak Springs. An EF-0 tornado briefly touched down in the community of Riverview, on the 30th, causing minor damage to fencing, roofs, windows, and a pool enclosure. On the same day, the Sheriff’s Office in Hendry County reported a tornado to the southwest of Moore Haven, FL.
Table 4: Breakdown of storm reports submitted in Florida during May (compiled from Southeast Regional Climate Center).
Agricultural and other climate-related impacts. At the beginning of May, topsoil and subsoil moisture levels across the state were running more than 70% adequate and about 10% surplus. Peanuts planted were reported at 25%, which was down from 27% this time last year. A state of emergency was declared for all of the Panhandle counties, and some of the Big Bend due to the excessive rains. Planting of field crops was 2 to 4 weeks behind schedule. In south Florida, watermelon harvesting increased and the citrus area received beneficial rainfall as this year’s citrus season came to a close. Vegetables and fruits were being marketed, and replanting of other crops was in full swing in the southern part of the state. As the month continued, fields in the northern part of the state began to dry out and the peanut crop started to show signs of catching up and passing the 5-year averages. Walton and Washington county growers were finally able to plant in fields, though in Levy and Dixie counties about 30% of the fields were flooded and others too wet to begin planting. Some growers opted to plant soybeans instead of cotton. Pasture conditions were listed as fair to good, though dry conditions in the southern part of the state began to impact conditions and citrus growing areas. Portions of northern Florida harvested late winter wheat; the last of the strawberries were harvested in Bradford County. Vegetable producers in southwest Florida began cleaning up fields as the season neared an end.
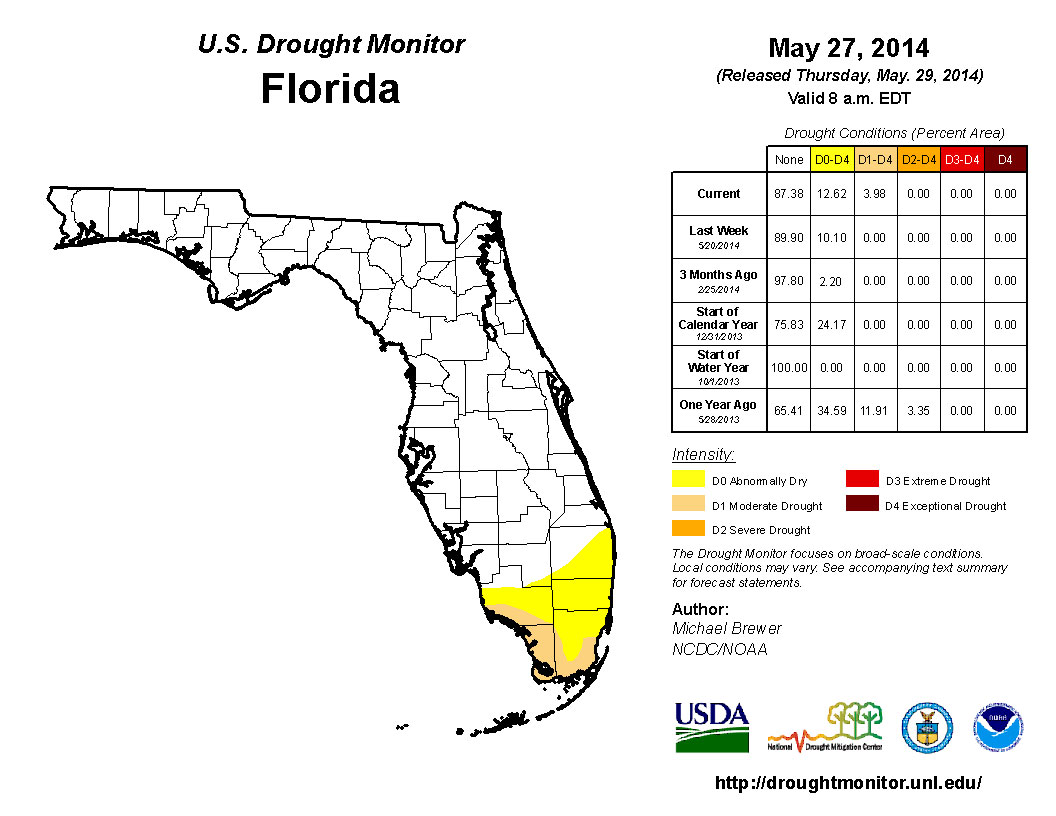
The month of May started off with the entire state free of any dry or drought conditions. The unusual wet conditions that most of the state has seen during the first part of 2014 continued, though portions of the southern part of Florida has remained dry throughout the time period. By the second week in May, abnormally dry conditions were reported in Broward, Collier, Dade, and Monroe counties. The lack of rainfall for the remainder of the month led to an increase in observed drought conditions, calling for moderate drought (D1) to be recorded for coastal portions of Collier, Dade and Monroe counties. Lake Okeechobee is currently at 12.54 ft. and is positioned well for the start of the summer wet season.
Figure 2: Drought conditions in Florida as of May 27, 2014 (courtesy of U.S. Drought Monitor).
Appendix 1: Additional May departures from normal data for Florida locations.
Prepared by Melissa Griffin and David F. Zierden.
Florida Climate Center
The Florida State University
Tallahassee, FL
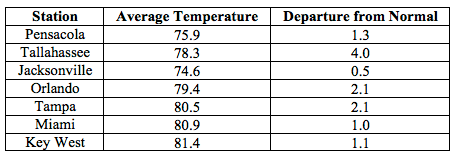
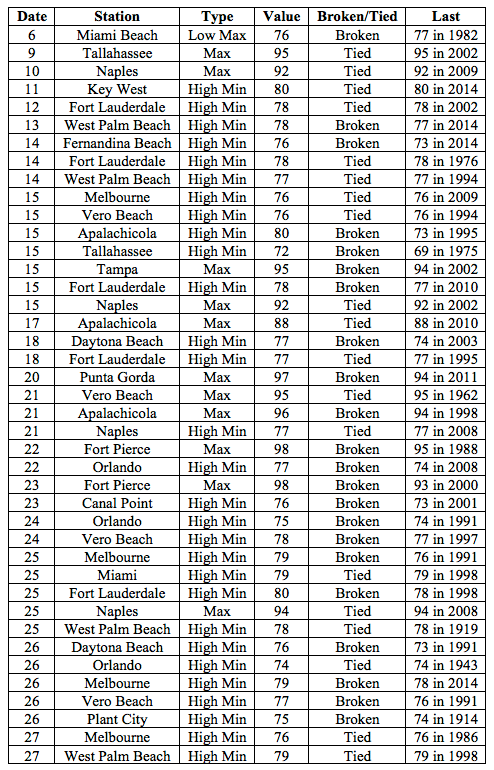
Average temperatures were above normal across most of the state in May. The departures for average temperatures in May 2015 were near normal to above normal across the entire state, ranging from 0.0˚F in Fort Lauderdale to 4.0˚F in Tallahassee (Table 1 and Appendix 1). Most locations across the state reported at least one day with a maximum temperature at or above 90˚F. Tallahassee had a record 4 consecutive days (May 9-12) with maximum temperatures of 95˚F. May 2015 was the 2nd warmest in Tallahassee, 6th warmest in Tampa and Vero Beach, and 8th warmest in Orlando and West Palm Beach. Multiple temperature records were tied or broken across the state in May (Appendix 2).
Table 1: May average temperatures and departures from normal (inches) for select cities.
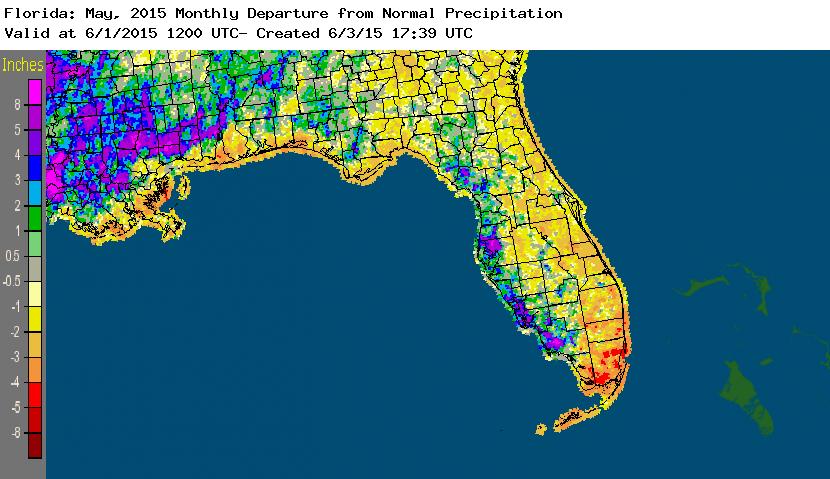
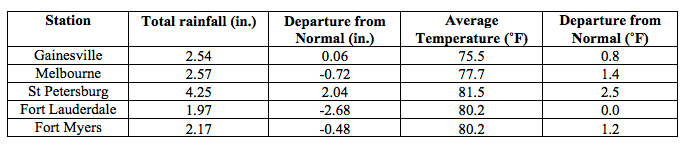
Rainfall totals were varied across the state in May. With the exception of some areas along the Panhandle and West Coast, the majority of the state had rainfall totals below normal (Figure 1). Departures from normal roughly ranged from -2.95” to 4.64” (Table 2 and Appendix 1), though localized parts of Florida saw rainfall totals that were as much as 5.00” below normal to over 8.00” above normal. May 2015 was the 6th driest on record at Vero Beach and the 9th driest in Orlando. There were multiple 24-hour precipitation records broken for the month (Table 3).
Table 2: May precipitation totals and departures from normal (inches) for select cities.
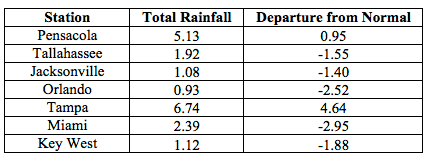
Table 3: Select daily rainfall records (inches) broken during May (compiled from NOAA, NWS).
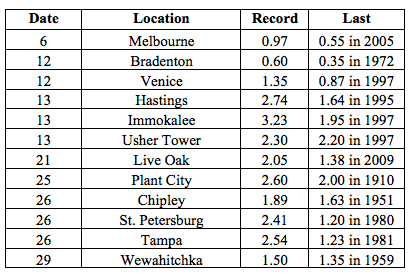
Figure 1: A graphical depiction of the monthly rainfall departure from normal (inches) for May is given in the figure below (courtesy of NOAA, NWS).
ENSO-neutral conditions continue in the Pacific.Based on current data and forecast models, the Climate Prediction Center (CPC) decided to continue the El Niño Advisory. El Niño conditions are present, and positive equatorial sea surface temperatures (SST) anomalies continue across most of the Pacific Ocean. There is an approximately 90% chance that El Niño conditions will continue through summer 2015, and a greater than 80% chance it will last through the remainder of 2015. CPC predicts above normal temperatures and precipitation across the state through August 2015.
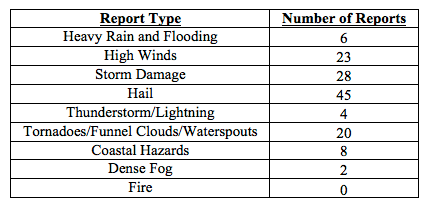
Hazardous weather events in May. There were a total of 136 severe weather reports made in Florida during May. On May 5th, heavy rain was reported in Cocoa Beach, when an observer reported 4.65” of rain within a two-hour period. Thunderstorms produced pea to dime-sized hail in the Miami metro area on the 7th. On the morning of the 8th, dense fog was seen along Alligator Alley with visibilities reduced to 1/8 of a mile. Two construction workers were injured in Bonita Springs, FL (Lee County) when they were struck by lightning during the afternoon of the 13th. On the same day, there were reports of a funnel cloud spotted in the area of Delray Beach, FL. Lightning started a structural fire in Santa Rosa County on the 20th. During Memorial Day Weekend, there were reports of strong rip currents along the east cost of the state. Three fatalities were reported from Jacksonville Beach to Riviera Beach and nearly 500 people had to be rescued along Florida beaches during the holiday weekend. Thunderstorms offshore produced multiple waterspouts along coastal locations of the state during May. One waterspout on the 25th moved onshore in Fort Lauderdale, injuring one adult and three children when it lifted up an inflatable bounce house into the air. Lightning hit a power lines in the Panama City Beach area, resulting in power outages on the 28th. Another weekend of strong rip currents at the end of the month caused the death of two swimmers and additional water rescues along the East Coast. The summer-time convective thunderstorms, that form along sea breezes and from daytime heating, were seen in both the Peninsula and Panhandle during the month. These thunderstorms produced high winds, downed trees and power lines, and hail.
Table 4: Breakdown of storm reports submitted in Florida during May (compiled from Southeast Regional Climate Center).
Agricultural related impacts. At the beginning of May, top soil moisture levels were at 79% adequate across the state. Hay was being cut in the Big Bend and northeast Florida counties. Cotton, corn, and peanut planting increased to field improvement after the above normal rainfall of April. The blueberry and peach harvests across the state had completed for the year, though some U-Pick blueberry growers were still open. Rain in Palm Beach County caused some localized field flooding, causing newly planted seed to be washed away. Pasture conditions across the state improved from the dry conditions and warmer temperatures. Citrus groves were using irrigation, and some of the fruit sizes were behind from last year. By the middle of the month, the lack of rainfall and warm daytime high temperatures were causing stress on some crops in the Big Bend, and southwest vegetable farmers began to heavily irrigate their fields. The harvesting of oats and wheat started in North Florida, while some southern Florida growers cleaned and prepped fields for summer fallow. By the end of May, topsoil moisture levels had dropped to 53% adequate across Florida. Drought conditions were beginning to move into the southern part of the citrus belt (Collier and Hendry counties). The quality of the conditions of pastures and livestock were reduced and overgrazing was reported in numerous locations across the state. Due to the continued dry conditions and warm temperature, heavy use of irrigation was seen across Florida at the beginning of June.
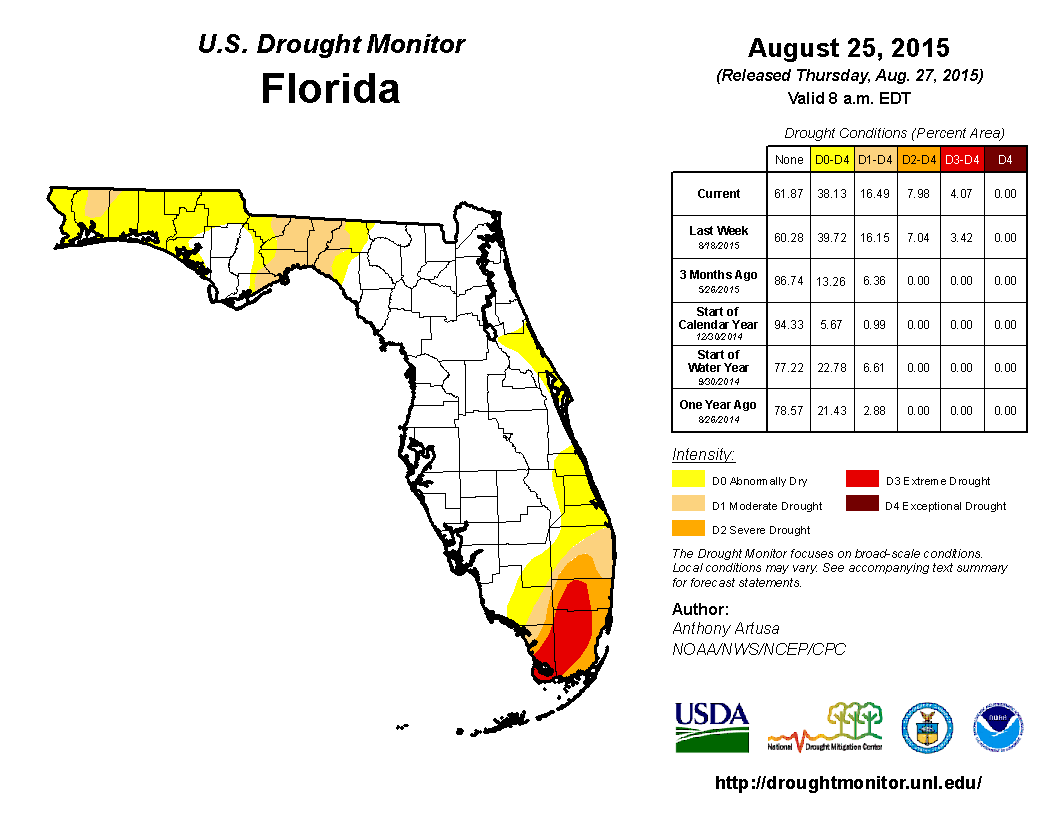
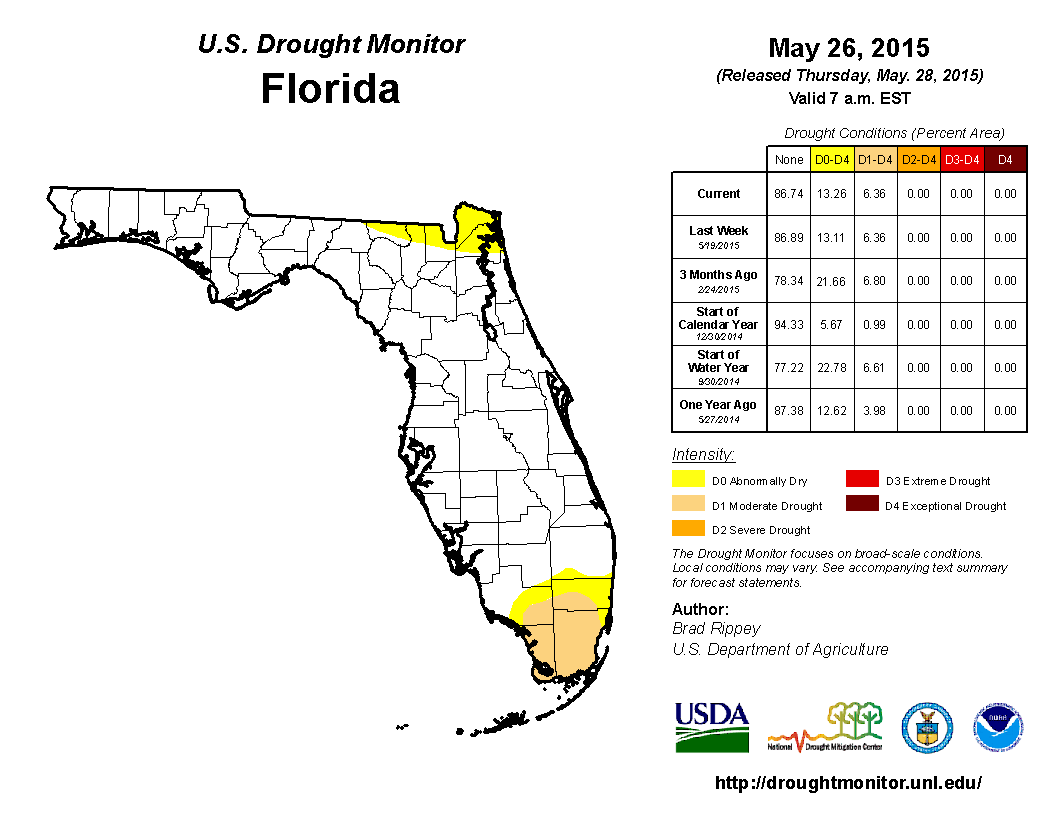
Drought related impacts. At the end of April, nearly 10% of the state was experiencing abnormally dry (D0) conditions, mainly concentrated in portions of southern Florida. After a wet April, precipitation across the state for May was closer to typical rainfall totals. May is a dry month for the state, so while some areas registered below normal rainfall, most of the state remained drought free. Rains at the beginning of the month in South Florida eased the moderate drought (D1) conditions, while the Panhandle experienced dryness (D0) in the northern parts of the counties. By the middle of May, D0 was introduced into Nassau County and the continued lack of rainfall in the southern Peninsula cause the expansion of D1 to Broward, Collier, Dade and Monroe counties. On the May 26th release of the drought monitor, the D0 area in the Panhandle had been removed, though the D0 area in the northeast continues to persist. Based on census data, roughly 3 million Florida citizens are currently being impacted by drought conditions reported in nearly 13% of the state. At the end of the month, the water level in Lake Okeechobee had dropped to under 13 ft., mainly due to regulatory releases.
Figure 2: Drought conditions in Florida as of May 26, 2015 (courtesy of U.S. Drought Monitor).
Appendix 1: Additional May departures from normal data for Florida locations.
Prepared by Melissa Griffin and David F. Zierden
Florida Climate Center
The Florida State University
Tallahassee, FL
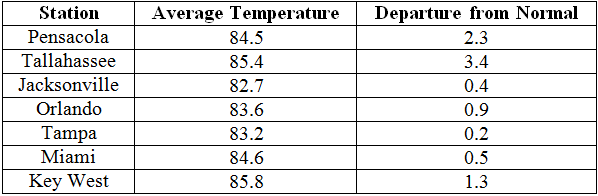
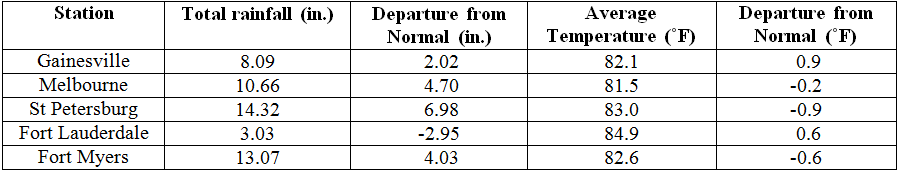
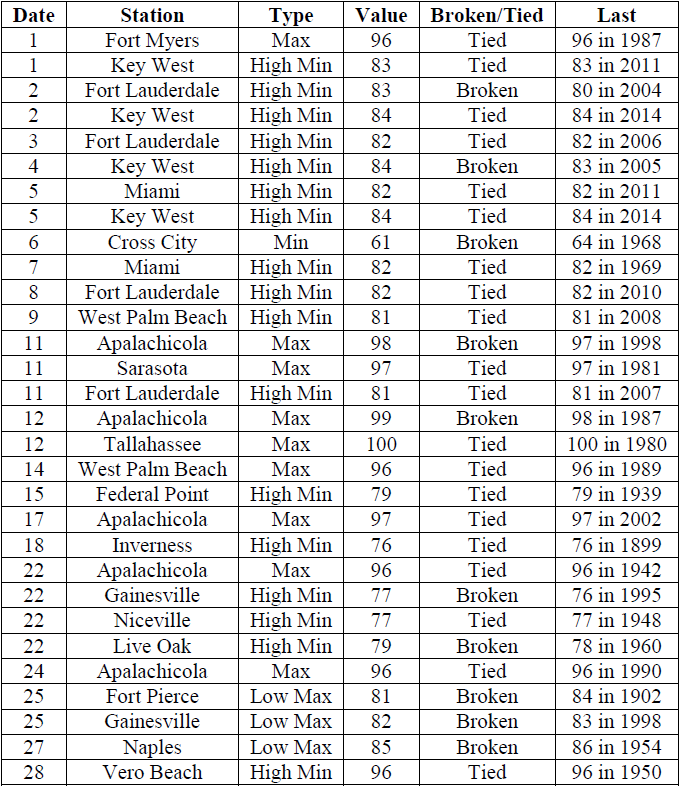
Average temperatures were above normal across most of the state in July. The departures from average temperatures in July 2015 were near normal to above normal across the entire state, ranging from -0.9˚F in Fort Myers to 3.4˚F in Tallahassee (Table 1 and Appendix 1). Areas with more rainfall saw temperatures slightly below normal. Tallahassee recorded 4 days with maximum temperatures at or above 100˚F. July 2015 was the 2nd warmest in Tallahassee, 4th warmest in Pensacola and Vero Beach, 9th warmest in Miami, and the 10th warmest in Key West and West Palm Beach. Multiple maximum and minimum temperature records were tied or broken across the state in July (Appendix 2).
Table 1: July average temperatures and departures from normal (˚F) for selected cities.
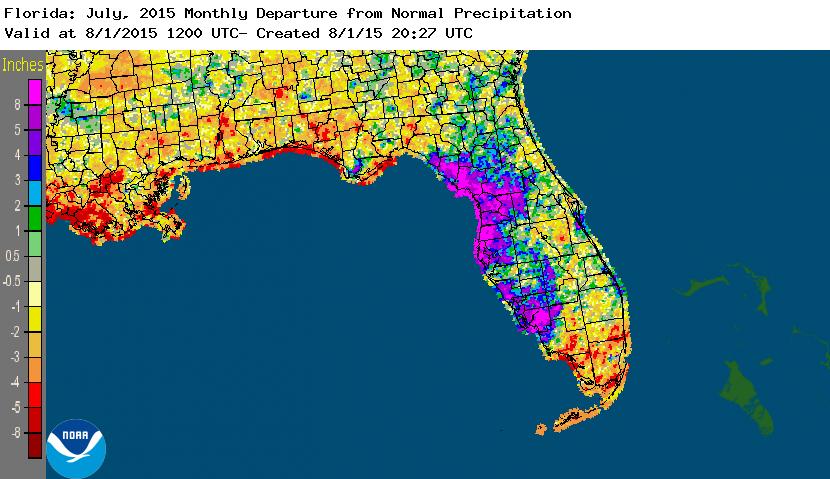
Rainfall totals were varied across the state in July. Portions of the western coast of Florida had well above normal rainfall, while the Panhandle and southern Florida recorded below normal (Figure 1). Departures from normal roughly ranged from -2.95” to 6.98” (Table 2 and Appendix 1), though localized parts of the state saw rainfall totals that were as much as 8.00” below normal to 8.00” above normal (Figure 1). July 2015 was the 7th driest on records in Key West and the 8th wettest for St. Petersburg. There were multiple 24-hour precipitation records broken for the month (Table 3).
Table 2: July precipitation totals and departures from normal (inches) for selected cities.
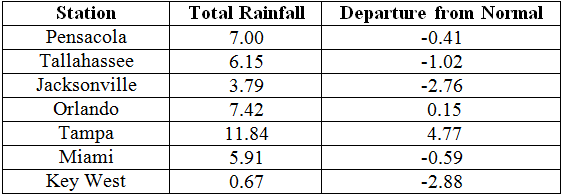
Table 3: Select daily rainfall records (inches) broken during July. (Compiled from NOAA, NWS).
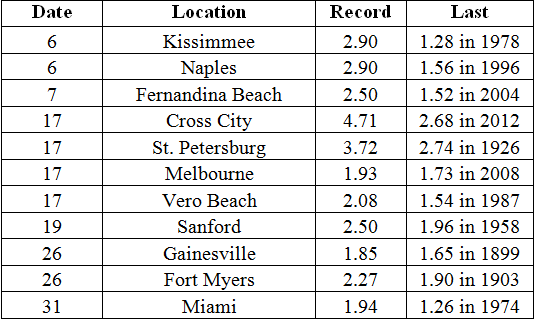
Figure 1: A graphical depiction of the monthly rainfall departure from normal (inches) for July is given in the figure below (courtesy of NOAA, NWS).
El Niño conditions are present in the Pacific.
Based on current data and forecast models, the Climate Prediction Center (CPC) decided to continue the El Niño Advisory. El Niño conditions are present, and positive equatorial sea surface temperatures (SST) anomalies continue across most of the Pacific Ocean. There is approximately a 90% chance that El Niño conditions will continue through the Northern Hemisphere winter 2015-2016, and a greater than 80% chance it will last through early spring 2016. CPC predicts above normal temperatures and normal precipitation across the state through October 2015.
Hazardous Weather Events in July.
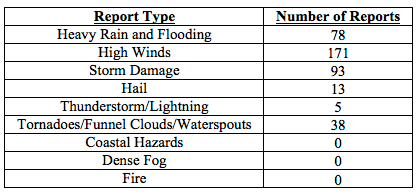
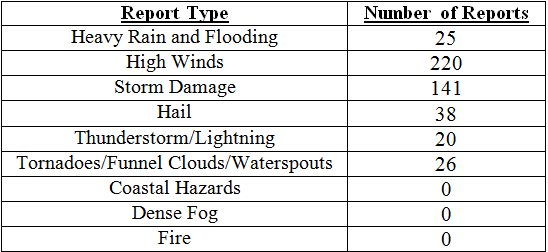
There were a total of 470 severe weather reports made in Florida during July. Multiple reports of funnel clouds were made along the area in Flagler Beach and lightning struck a seven-story building in Marineland, FL. On the 3rd of July, a house fire was started by a lightning strike in Clearwater, FL. Many news media outlets showed pictures of a large waterspout off the coast of Miramar Beach, FL on the 5th. A brush fire near Durbin, FL (St. Johns County) started from lightning on the 6th, but was quickly extinguished by firefighters. On the 12th, a well-defined waterspout was reported about 3 miles southwest of Marathon, FL. Lightning caused house fires in Palm Coast, FL and Bunnell, FL on the 13th. Lightning associated with an intense thunderstorm on the 16th injured one person in Baldwin, FL and another in Normandy, FL. Heavy rains on the 17th caused flooding in downtown St. Petersburg, FL. Lightning was the cause of house fires in Navarre, FL on the 19th and Jacksonville Beach on the 21st. Two people were indirectly injured from a lightning strike near a restaurant in Jacksonville Beach, FL on the 21st. The following day, three people were injured at Haulover Beach, FL from a lightning strike. A stalled stationary front caused heavy rains and flooding in areas of Hillsborough, Pasco and Pinellas counties on the 25th and 26th. Two people were injured in Orlando on the 29th when lightning struck near where they had been standing. Various convective and sea breeze thunderstorms caused hail, high winds, storm damage and heavy rains across the state during the entire month of July.
Table 4: Breakdown of storm reports submitted in Florida during the month of July. (Compiled from Southeast Regional Climate Center.)
Agriculture Related Impacts.
At the beginning of July, topsoil moisture levels were at mainly short to adequate across the state. The late June rains improved pasture quality in the Panhandle and southwest Florida. Corn harvesting and silage was in full swing across multiple counties in the state. Late planting of soybeans took place in the Panhandle by mid-month. Wet conditions delayed haying in some northeast Florida counties. Due to the lack of rain in southeast Florida, all crops in Dade counties were being irrigated. The dry and hot conditions across much of the southern part of the state impacted pasture conditions and livestock. Growers in the Peninsula began preparing land for fall crops. Portions of the western Big Bed dealt with heavy rainfall and pastures in the area showed signs of mildew from the wet conditions. Drought conditions took a toll on soil moisture values with 22% of the topsoil reported being short of moisture. Heavy rains flooded fields across portions of the western Peninsula, and army worms were reported in Pasco County. The peanut progress was on par with the 5-year average with 81% of the pegging condition between good and excellent. At month’s end, several counties in the center of the citrus growing region were showing some abnormally dry conditions and irrigation was being used in most locations.
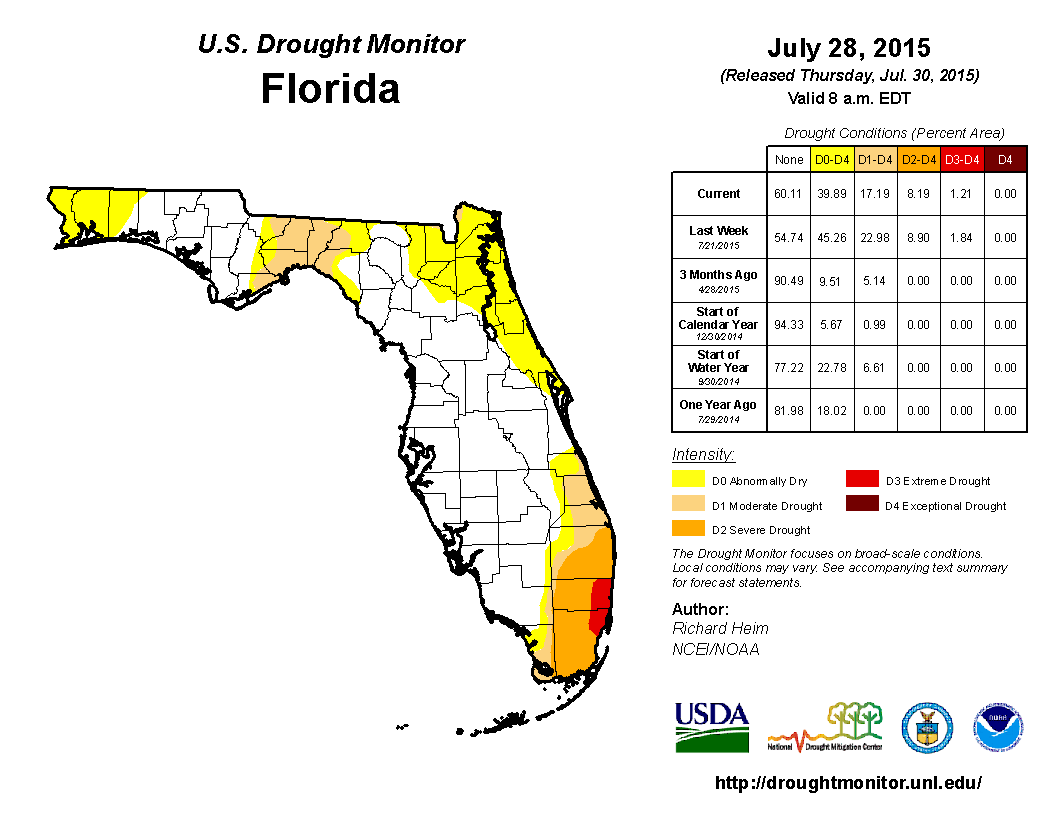
Drought Related Impacts.
At the end of June, nearly 41% of the state was experiencing abnormally dry (D0) or drought conditions. The main concentration was seen along the east coast of the state, and in portions of northeastern and southern Florida. By July 7th, area of D0 was added into Escambia, Santa Rosa and Walton counties. As the month progressed, limited rainfall lead to continued drought conditions in North Florida and the Big Bend, where moderate (D1) and severe (D2) droughts were reported. In South Florida, the area of D2 conditions was expanded in Broward, Dade and Palm Beach counties. Severe drought (D3) conditions were introduced along the Gold Coast. Rains toward the end of the month helped ease D2 in the northeastern part of the state and along Volusia and Brevard counties. Based on census data, roughly 6 million Florida citizens are currently being impacted by drought conditions reported in nearly 40% of the state. At the end of the month, the water level in Lake Okeechobee had dropped to under 12 ft., mainly due to lack of rainfall across the basin. This pushes the lake into water shortage management stages.
Appendix 1: Additional July Departures from Normal Data for Florida Locations
Appendix 2: Select daily maximum and minimum temperature records (o F) tied or broken during July. (Compiled from NOAA, NWS)
Building A, Suite 292
Tallahassee, FL 32306-2741
Phone: (850) 644-3417 | (850) 644-0719
climate@coaps.fsu.edu