


Prepared by Florida Climate Center
Florida State University
Tallahassee, FL

Summary:
- Monthly mean temperatures in March were above normal in Florida.
- Monthly precipitation totals in March were generally below normal, except in portions of South Florida which received above-average rainfall.
- Widespread drought conditions persisted with degradation in northern Florida; by the end of the month nearly all of Florida remained in drought (D1-D4) with about 80% of the state in either extreme (D3) or exceptional (D4) drought.
- A La Niña advisory continued during the past month but a transition to ENSO-neutral is expected soon and is favored to continue through May-July 2026 (55% chance), with increasing chances of El Niño during summer (62% chance June-August 2026).
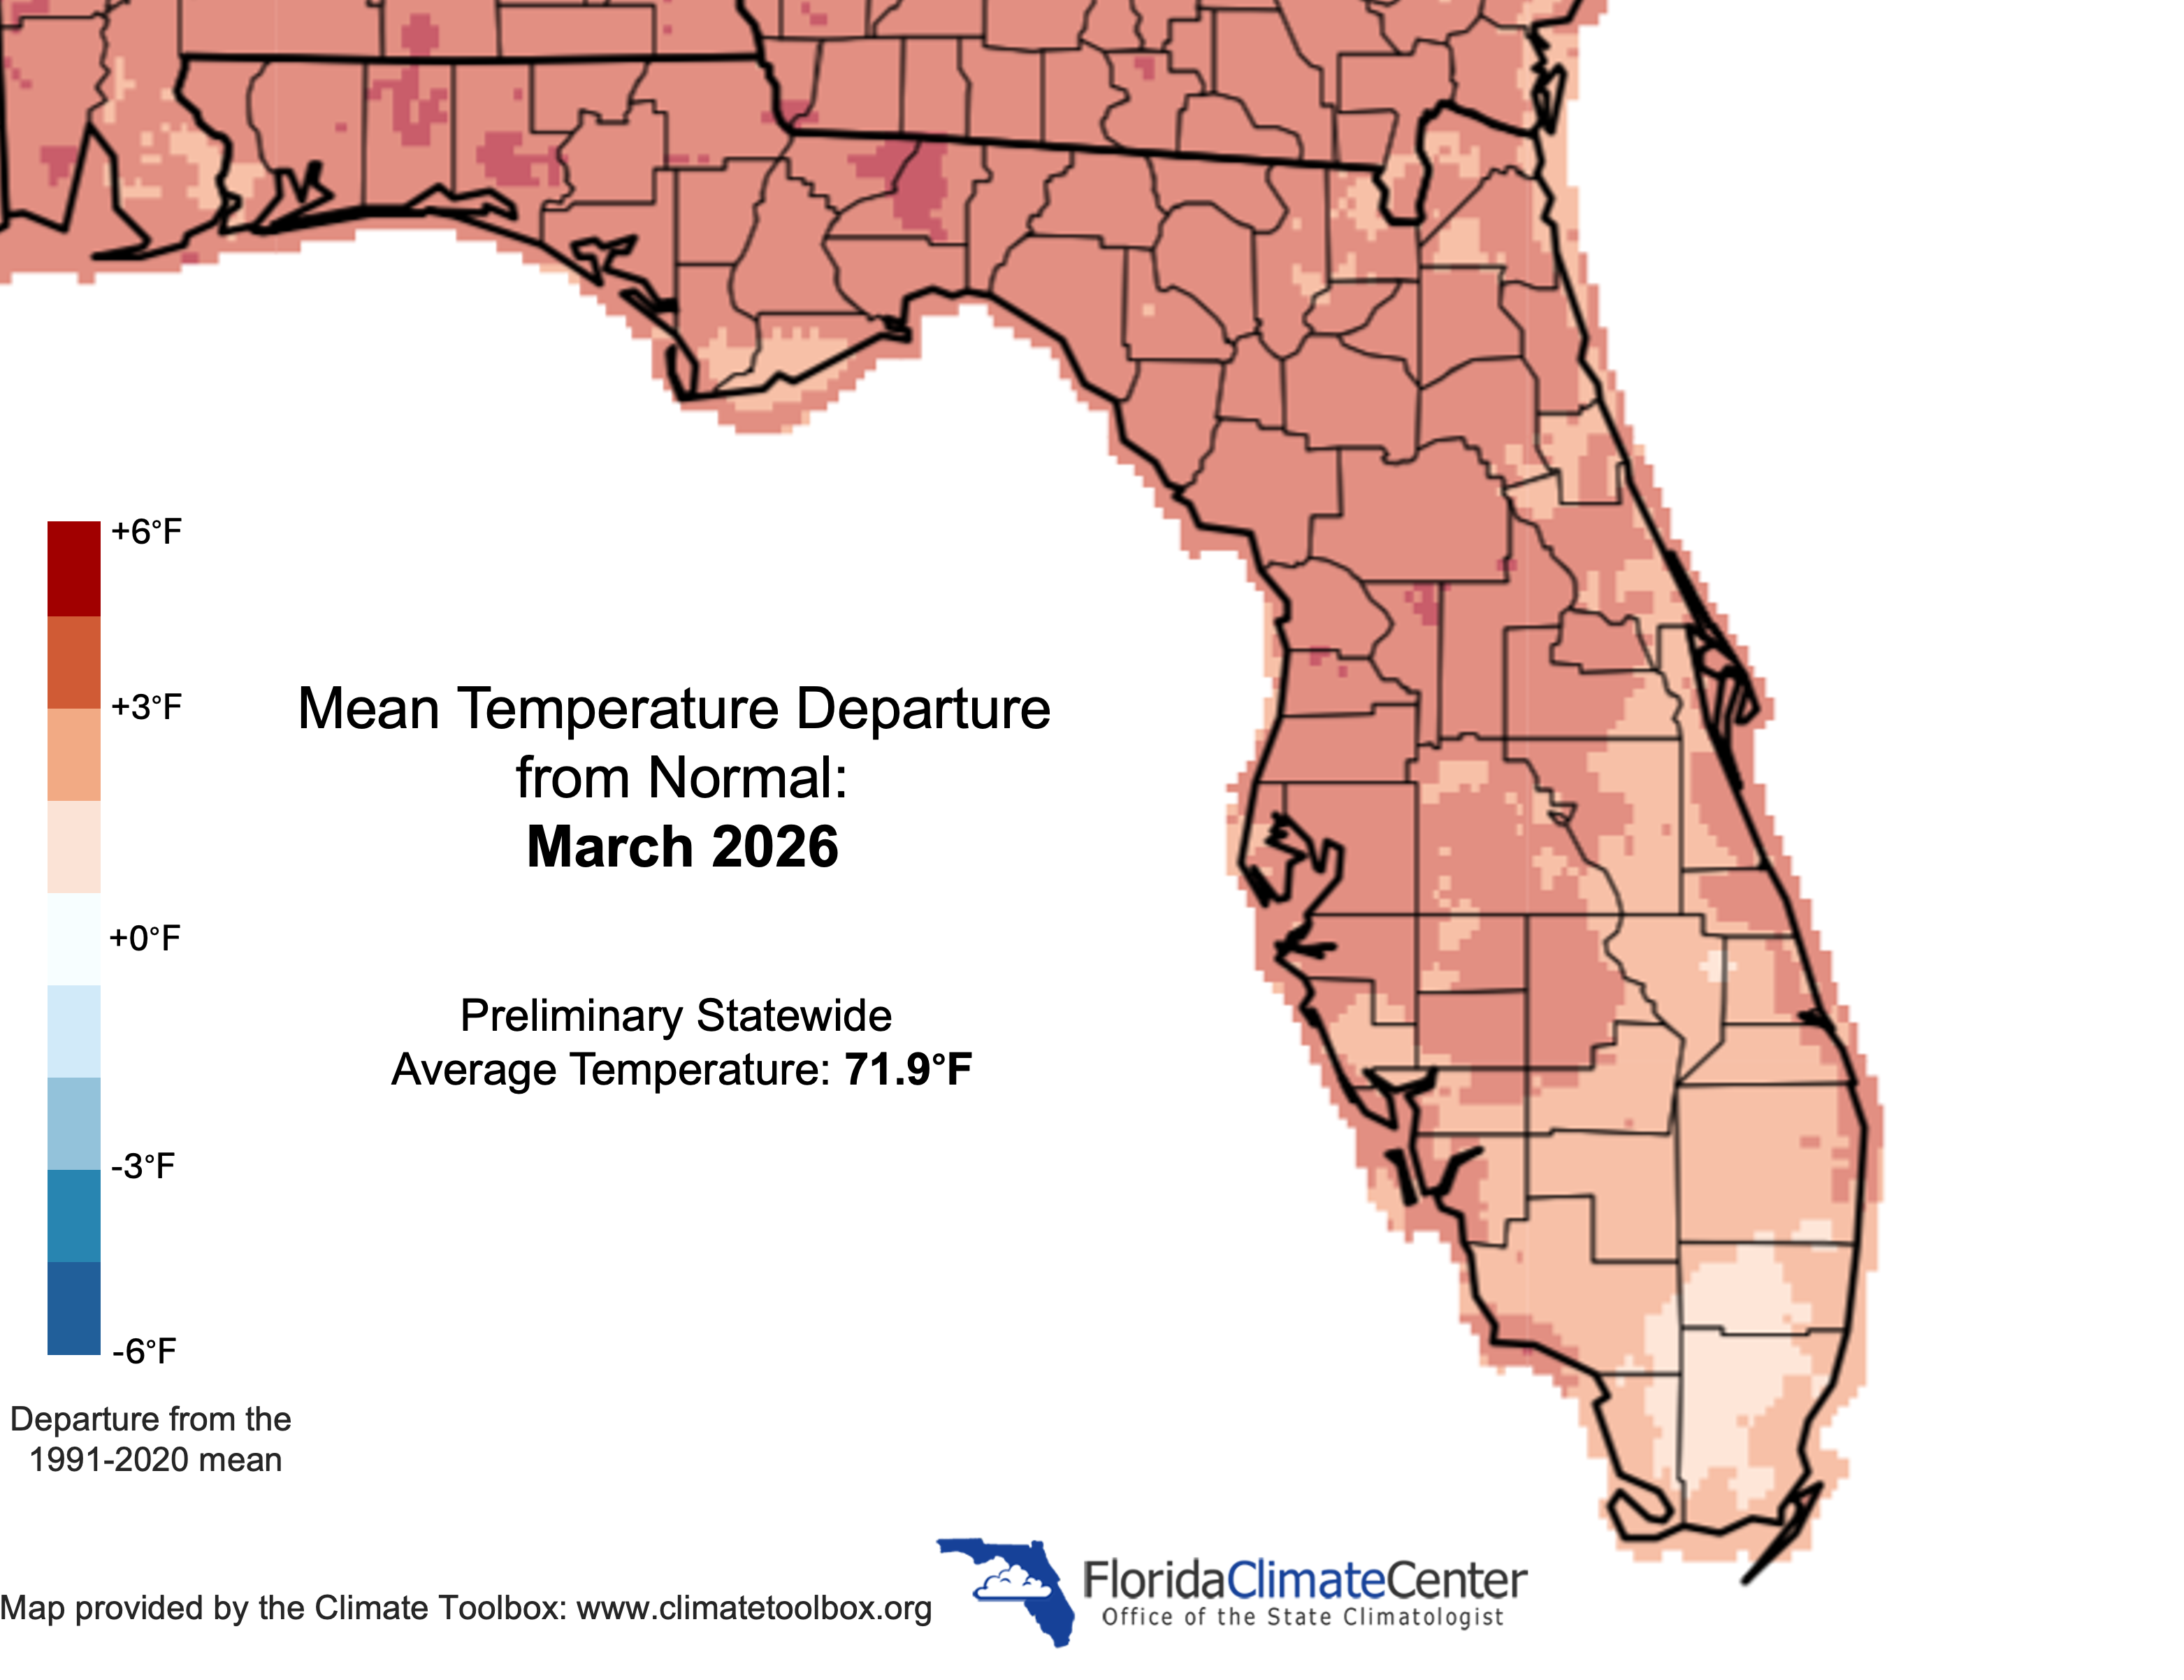
Monthly average temperatures in March were above normal in Florida. Average monthly temperature departures from normal ranged from +1.9 ̊F in Miami to +5.1 ̊F in Gainesville for the month (see Table 1 and Appendix 1 for select cities). Warm and even summer-like temperatures were felt across the state in March. On March 6, Tampa reached a maximum temperature of 90 ̊F which was the earliest 90 ̊F day in the season on record (prior record was March 16, 1945). On March 10, Jacksonville reached a maximum temperature of 92 ̊F which was the earliest 92 ̊F day or higher on record (prior record was March 28, 2020 at 94 ̊F). On March 11, maximum temperatures in the upper 80s to low 90s were felt across northern Florida, but a strong cold front affected the state mid-month (16-20th), bringing mean temperatures well below normal across the state along with a late-season freeze on the 18th that affected the Panhandle and north-central Florida. Monthly average temperatures for most stations ended up ranking in the top 10 warmest on record for March statewide. Select daily record high maximum temperatures tied or broken during March are provided in Appendix 2.
Table 1. March average temperatures and departures from normal ( ̊F) for select cities.
| Station | Mean Temperature | Departure from Normal |
| Pensacola | 65.5 | +3.2 |
| Tallahassee | 65.5 | +4.1 |
| Jacksonville | 66.3 | +3.9 |
| Orlando | 72.2 | +4.9 |
| Tampa | 72.8 | +4.2 |
| Miami | 75.0 | +1.9 |
| Key West | 77.0 | +2.6 |
Figure 1. Monthly average temperature departures from normal (°F) in Florida for March 2026.
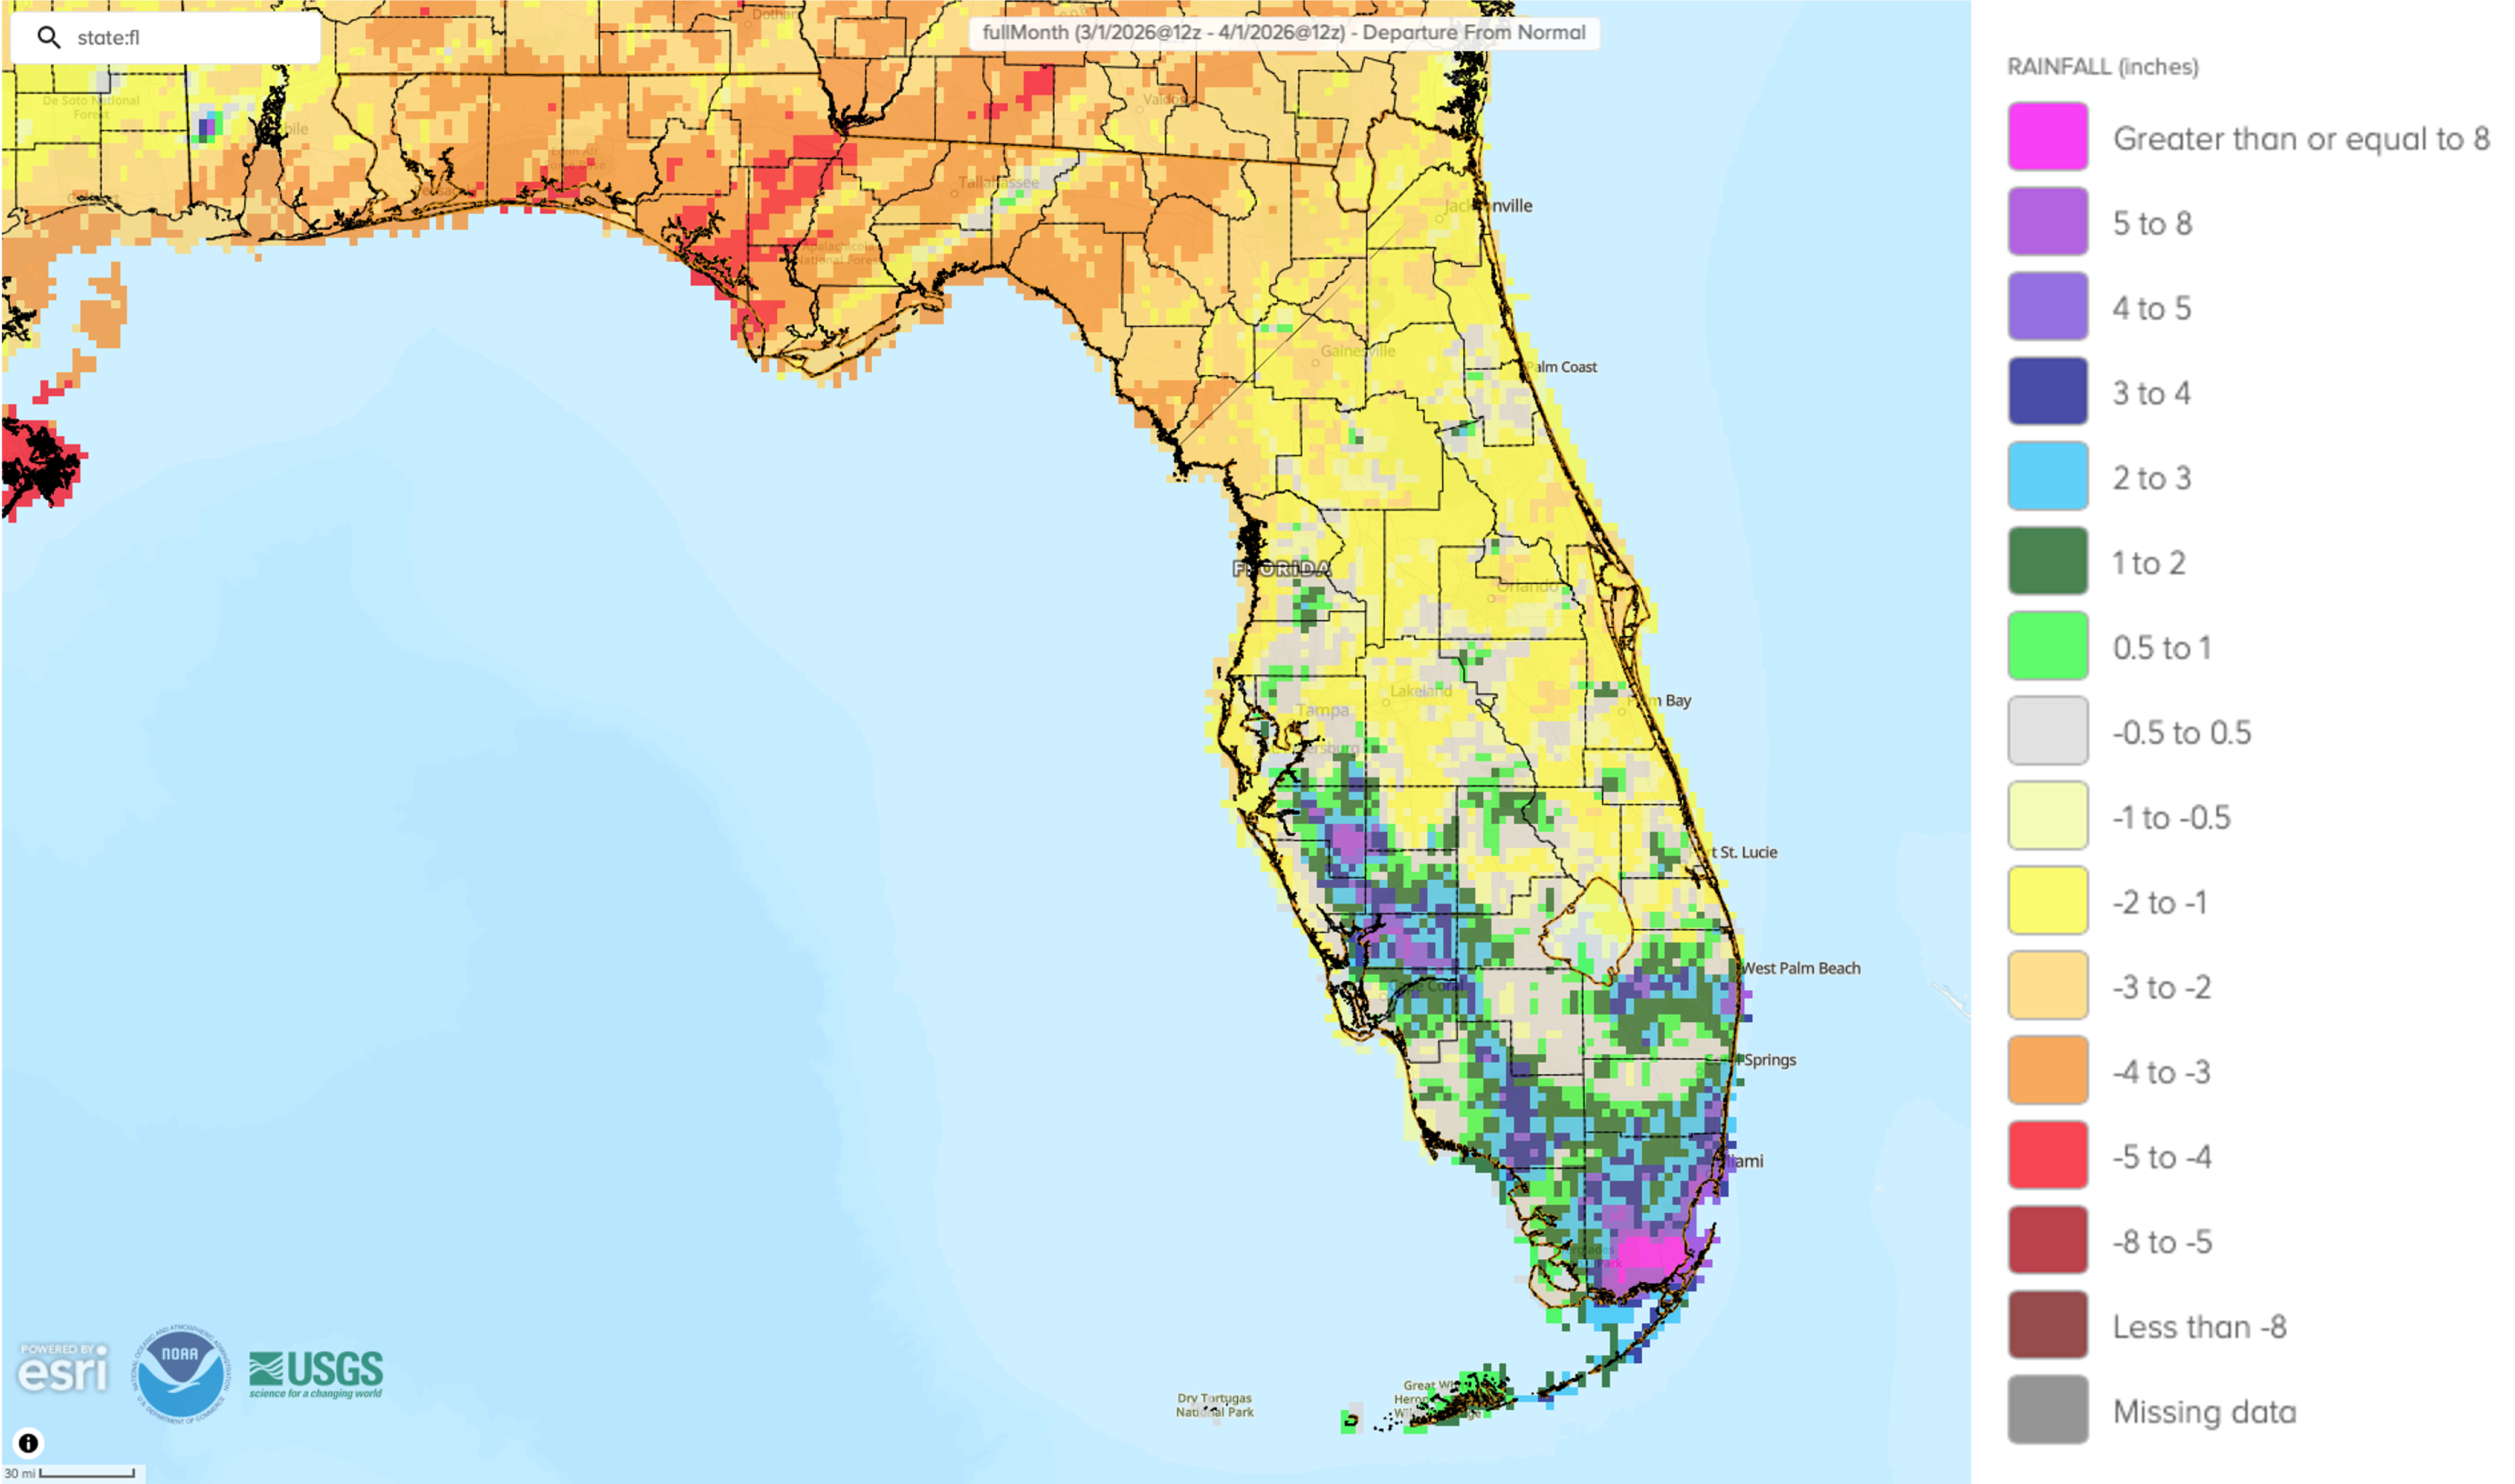
Monthly precipitation totals in March were generally below normal, except in portions of South Florida which received above-average rainfall. The monthly precipitation departures from normal ranged from -3.63 inches in Tallahassee to +2.53 inches in West Palm Beach (see Table 2 and Appendix 1 for select locations). Rainfall in March has helped somewhat with drought conditions but was generally not enough to dampen the long-term drought. The exception has been in South and Southeast Florida. These areas received widespread 2-6 inches of rainfall with an isolated area of 10-15 inches in southern Miami-Dade County, which led to drought improvement of one category during the month. Tallahassee measured its 9th-driest March on record (86 years) and Gainesville recorded its 7th-driest March on record (102 years). Continued impacts from persistent drought conditions resulted in the return of an area of Exceptional Drought (D4) in portions of North Florida. According to the Southeast Regional Climate Center’s Climate Perspectives tool, the past six months (October 1, 2025 to March 31, 2026) have been very dry, with precipitation deficits ranging from 8-14 inches below average across northern Florida and parts of southwest Florida. During this 6-month period, Tallahassee experienced record dryness (84 years) and this period was 2nd-driest on record in Apalachicola (83 years), Jacksonville (86 years), Gainesville (51 years), and Venice (62 years).
Table 2. March precipitation totals and departures from normal (inches) for selected cities.
| Station | Total Rainfall | Departure from Normal |
| Pensacola | 1.95 | -3.30 |
| Tallahassee | 1.61 | -3.63 |
| Jacksonville | 1.70 | -1.59 |
| Orlando | 1.19 | -1.84 |
| Tampa | 2.76 | +0.24 |
| Miami | 4.39 | +1.93 |
| Key West | 2.59 | +1.06 |
Figure 2. A graphical depiction of the monthly rainfall departure from normal (inches) for March 2026 (courtesy of NOAA, NWS).
La Niña Advisory.
The tropical equatorial Pacific Ocean remained in a La Niña state during the past month. Below-average sea surface temperatures persisted in the east-central region of the equatorial Pacific Ocean but showed weakening, and equatorial subsurface temperatures continued to increase. A transition to ENSO-neutral is expected in the next month and is favored to continue through May-July 2026 (55% chance). The probability for an El Niño increases during summer, with a 62% chance June-August 2026, which is likely to persist through at least the end of the year.
Hazardous Weather Events in March.
According to the Local Storm Reports issued by the local National Weather Service offices serving Florida, there were 359 individual local reports of hazardous weather events recorded across the state during the month of March (see Table 3 for a breakdown by event type). On March 5, dense fog was reported in Baker County which led to traffic accidents and two injuries on a section of I-10. Rip currents led to one fatality due to drowning at Ormond Beach on the 14th and two injuries at Boynton Beach that same day. While no tornadoes were reported in Florida during the month, severe thunderstorms on the 15th resulted in reports of ping pong to golf ball sized hail (1.50 - 1.75 inches) in Brevard County. Parts of the state continued to see a high risk of wildfire with dry and windy conditions. A significant 500-acre wildfire in the Mossy Pond area of Calhoun County began on the 21st and destroyed vehicles, 16 homes, and displaced approximately 40 people, which has since been contained. There have been an estimated 1,500 wildfires in Florida so far this year.
Table 3. Breakdown of storm reports submitted in Florida during the month of March (compiled from Iowa State University/Iowa Environmental Mesonet).
| Report Type | Number of Reports |
| Heavy Rain | 2 |
| Dense Fog | 1 |
| Flood | 3 |
| Hail | 33 |
| Lightning | 2 |
| Marine Thunderstorm Wind | 69 |
| Non-Thunderstorm Wind Gust | 25 |
| Tornado/Waterspout/Funnel Cloud | 0 / 4 / 1 |
| Thunderstorm Wind Damage | 68 |
| Non-Thunderstorm Wind Damage | 1 |
| Thunderstorm Wind Gust | 144 |
| Wildfire | 4 |
| Rip Currents | 2 |
Daily Record Events in March.
Table 4. Summary of daily records broken or set in Florida in March 2026 (source: NCEI Daily Weather Records).
| Category | Number of Records |
| Highest daily max. temp. | 43 |
| Highest daily min. temp. | 23 |
| Lowest daily max. temp. | 25 |
| Lowest daily min. temp. | 10 |
| Highest daily precipitation | 16 |
| Total | 117 |
Drought-Related Impacts.
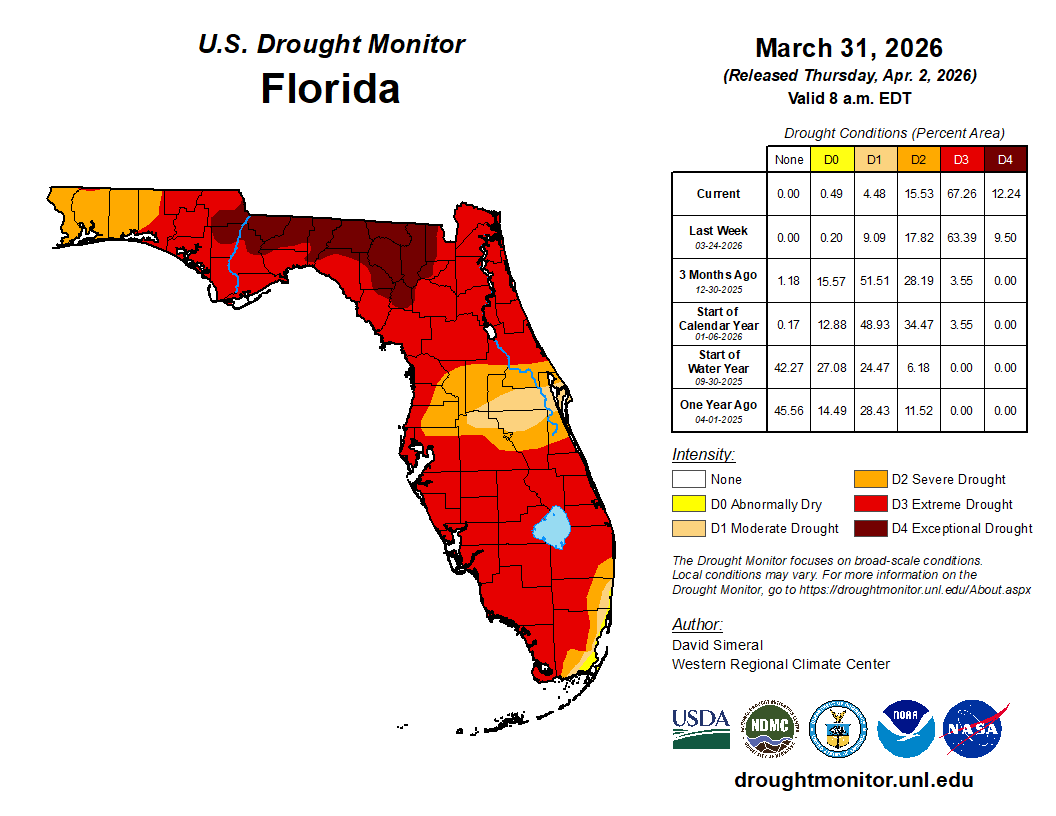
Drought conditions remained widespread and persistent, with some degradation during the month. By mid-month, drought continued to affect virtually all of Florida with 99.8% of the state experiencing some level of drought (D1-D4). As of March 17, approximately 2% of the state was in exceptional drought (D4), 71% of the state in extreme drought (D3), 18% in severe drought (D2), and 9% was in moderate drought (D1), with <1% of the state abnormally dry (D0), according to the U.S. Drought Monitor. By month’s end, approximately 12% of the state was in exceptional drought (D4), 67% was in extreme drought (D3), 16% was in severe drought (D2), and 4% was in moderate drought (D1); about 0.5% was considered abnormally dry (D0) (Figure 2 below).
As of March 31, the Lake Okeechobee water level was 12.02 ft. above sea level (Feet-NGVD29), which is below average for this time of year. At the first of March, the water level was 12.29 ft. above sea level.
Figure 3. A graphical depiction of the latest drought conditions in Florida according to the U.S. Drought Monitor (courtesy of the National Drought Mitigation Center, University of Nebraska-Lincoln).
Agriculture-Related Impacts.
Extreme or Exceptional Drought (D3-D4) covered about 80% of the state by the end of the month, which is the largest proportion of extreme to exceptional drought in the state in at least 25 years. All or virtually all of Florida has experienced some level of drought (D1-D4) for the past 8 consecutive weeks. Rainfall was more mixed this month, with some regions experiencing above average rainfall, mainly in the southern Peninsula. Most rainfall was scattered and mostly insufficient to close rainfall deficit gaps and ease the impacts that have been felt over the past several months. Temperatures stayed above average for much of the month. Winter wheat and small grains were in good to fair condition but will be impacted without more rain. Corn planting began in several counties but was slowed in some fields due to insufficient moisture. Sugarcane and watermelon have begun to show the negative impacts from the freeze in early February, but strawberries, squash and other vegetable crops are progressing well. Cattle was reported to be in fair to good condition while range and pastures are in fair condition, but many have been adversely impacted by drought with reports of very dry pastures and low to dry watering holes. For more information, consult the Crop Progress - State Stories, which are published by the USDA’s National Agricultural Statistics Service each year from December – March.
Appendix 1
Additional March departures from normal data for select Florida locations (source: NWS).
| Station | Average Temperature (˚F) | Departure from Normal (˚F) | Total Rainfall (in.) | Departure from Normal (in.) |
| Gainesville | 67.8 | +5.1 | 0.57 | -2.92 |
| Sarasota | 72.9 | +4.8 | 1.87 | -0.98 |
| Melbourne | 71.6 | +4.2 | 3.27 | +0.58 |
| Fort Myers | 74.3 | +4.0 | 2.02 | -0.05 |
| West Palm Beach | 74.6 | +3.5 | 5.82 | +2.51 |
Appendix 2
Select daily record high maximum temperatures tied or broken during March (compiled from NOAA).
| Station | Date | Record (˚F) | Broken/Tied | Last |
| Homestead | 1 | 92 | Broken | 90 in 2023 |
| Tampa | 2 | 86 | Tied | 86 in 1945 |
| Tampa | 5 | 89 | Broken | 87 in 2020 |
| Venice | 5 | 88 | Broken | 87 in 2022 |
| Fort Myers | 5 | 90 | Tied | 90 in 2022 |
| Ochopee | 6 | 90 | Broken | 89 in 2023 |
| Gainesville | 6 | 88 | Broken | 87 in 2023 |
| Tampa | 6 | 90 | Broken | 89 in 2022 |
| Crestview | 6 | 84 | Broken | 83 in 2022 |
| Marianna | 7 | 86 | Broken | 85 in 2023 |
| Orlando | 8 | 88 | Broken | 86 in 2022 |
| Miles City | 9 | 93 | Broken | 90 in 2002 |
| Ochopee | 9 | 90 | Broken | 88 in 2002 |
| Gainesville | 9 | 89 | Broken | 85 in 2022 |
| Lakeland | 9 | 89 | Broken | 88 in 2024 |
| Tallahassee | 9 | 88 | Broken | 87 in 1974 |
| Orlando | 10 | 90 | Broken | 87 in 2019 |
| Gainesville | 10 | 91 | Broken | 88 in 2019 |
| Tampa | 10 | 88 | Broken | 85 in 2016 |
| Lakeland | 10 | 91 | Broken | 88 in 1985 |
| Jacksonville | 10 | 92 | Broken | 91 in 1974 |
| Clermont | 11 | 93 | Broken | 89 in 2015 |
| Hastings | 11 | 89 | Broken | 86 in 2015 |
| Lisbon | 11 | 89 | Broken | 87 in 1974 |
| Ocala | 11 | 92 | Broken | 90 in 1974 |
| Clermont | 12 | 92 | Broken | 91 in 2015 |
| Hastings | 12 | 90 | Broken | 85 in 1997 |
| Plant City | 12 | 92 | Broken | 90 in 1911 |
| Orlando | 12 | 90 | Broken | 89 in 2001 |
| Key West | 13 | 86 | Broken | 85 in 2003 |
| Fort Pierce | 17 | 89 | Broken | 88 in 1990 |
| Chipley | 24 | 88 | Broken | 86 in 1954 |
| Homestead | 30 | 95 | Broken | 92 in 2023 |