


Prepared by Florida Climate Center
Florida State University
Tallahassee, FL

Summary:
- Monthly mean temperatures in December were near to above normal across Florida.
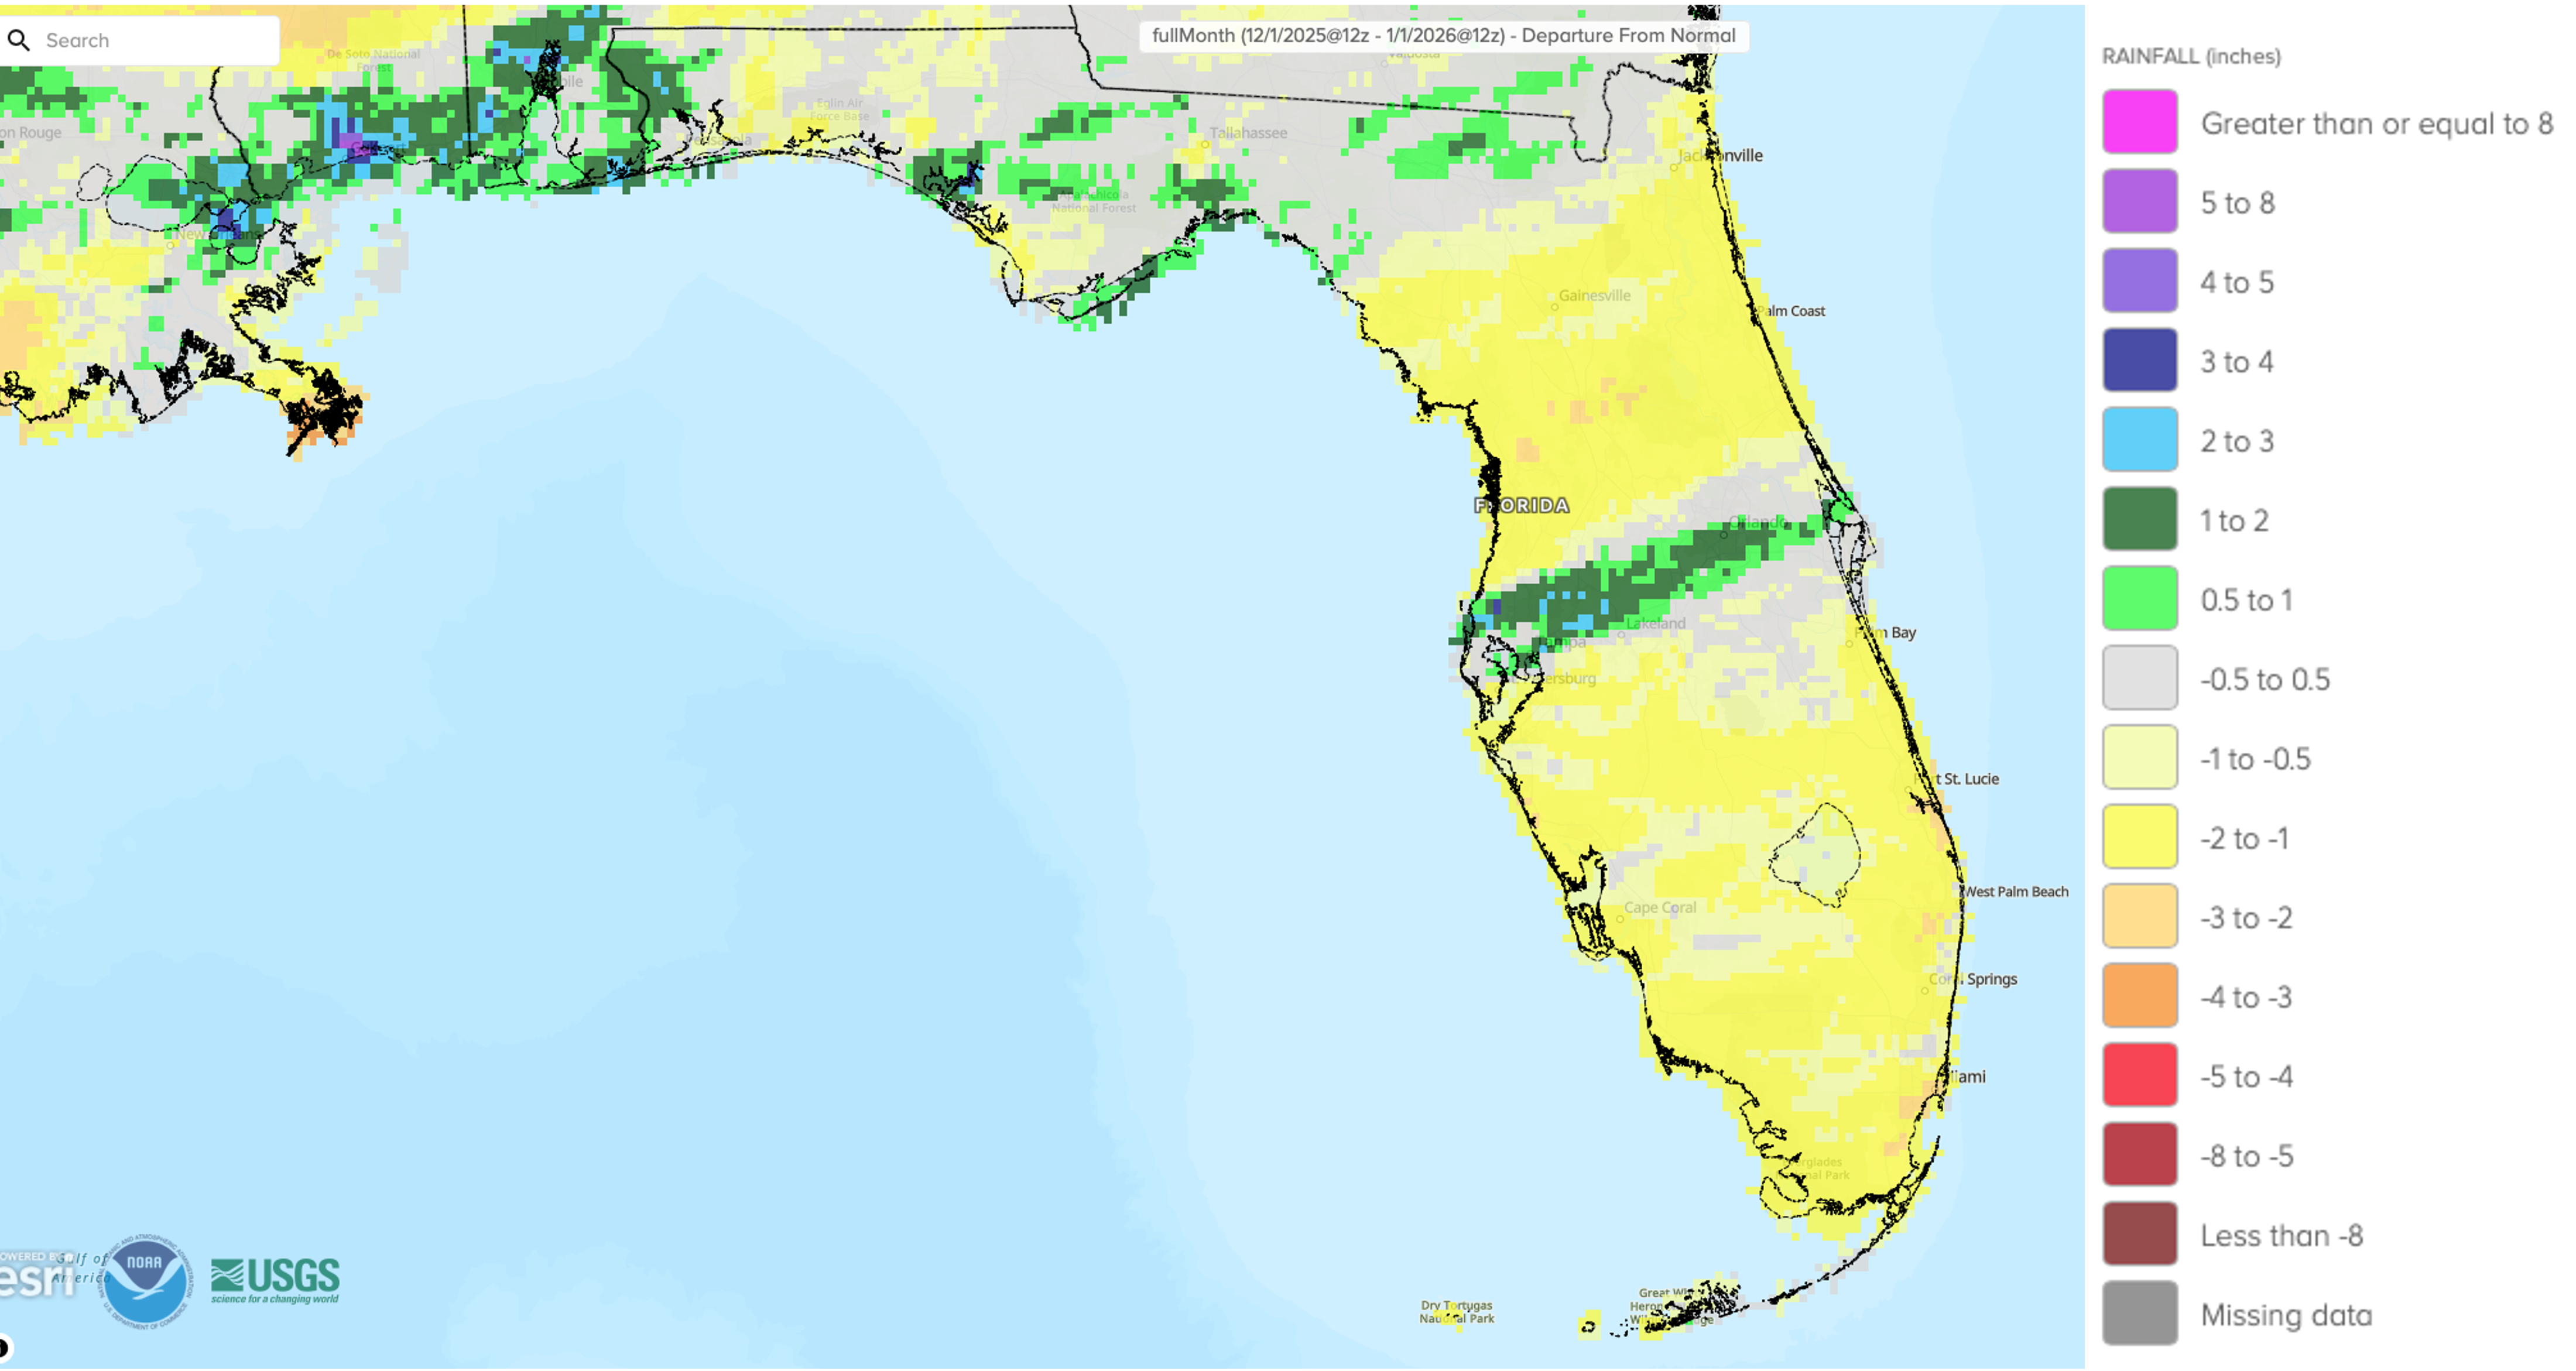
- Monthly precipitation totals in December were generally below normal, with the exception of parts of central Florida and the Panhandle.
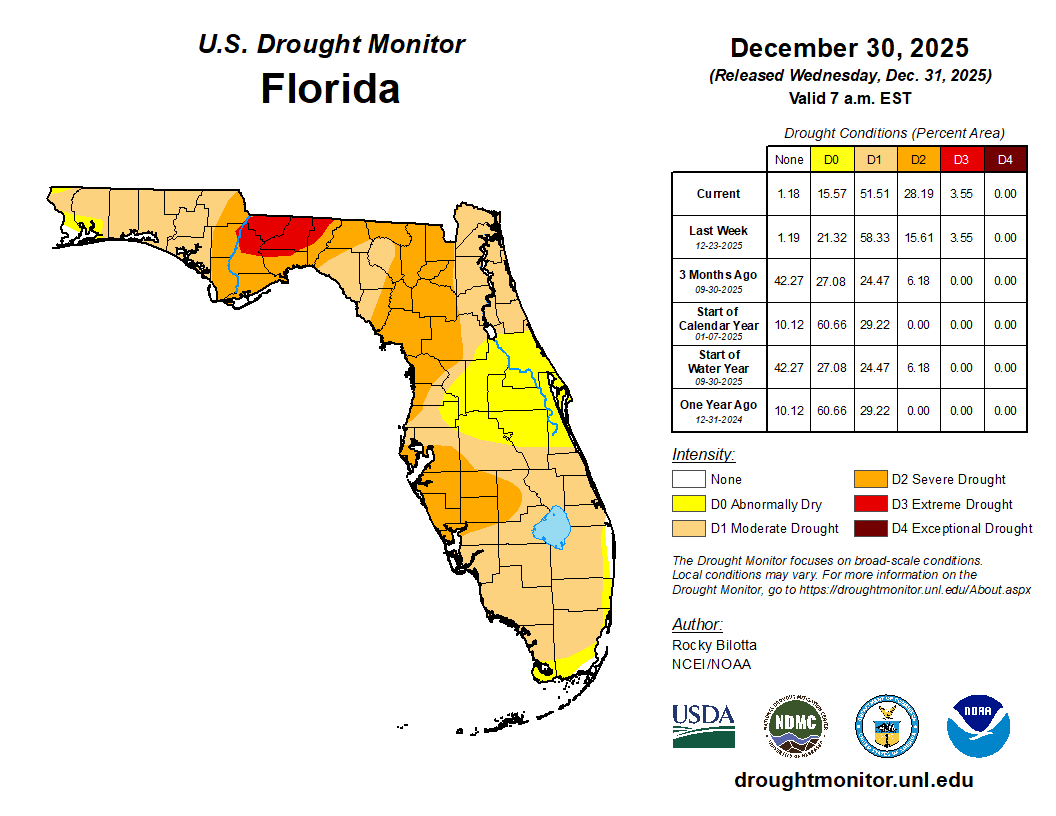
- Drought conditions improved but persisted in the Florida Panhandle, and drought expansion and degradation occurred in the Peninsula during the month.
- A La Niña advisory continued in the equatorial Pacific Ocean and a transition to ENSO-neutral is expected during January-March 2026 (75% chance).
Table 1. December average temperatures and departures from normal ( ̊F) for select cities.
| Station | Mean Temperature | Departure from Normal |
| Pensacola | 55.3 | -0.2 |
| Tallahassee | 54.4 | 0.0 |
| Jacksonville | 57.1 | +0.4 |
| Orlando | 65.5 | +2.2 |
| Tampa | 66.6 | +1.7 |
| Miami | 73.3 | +2.1 |
| Key West | 74.2 | +1.2 |
Figure 1. Monthly average temperature departures from normal (°F) in Florida for December 2025.
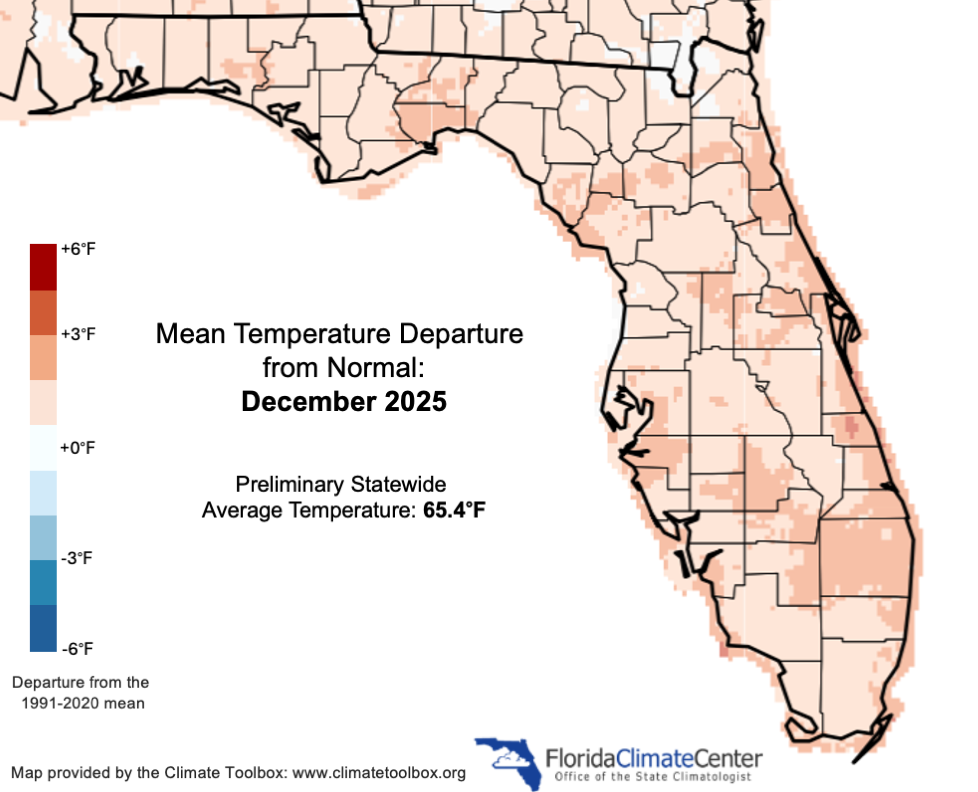
Table 2. December precipitation totals and departures from normal (inches) for selected cities.
| Station | Total Rainfall | Departure from Normal |
| Pensacola | 5.21 | -0.19 |
| Tallahassee | 3.45 | -0.79 |
| Jacksonville | 2.18 | -0.60 |
| Orlando | 3.13 | +0.65 |
| Tampa | 2.88 | +0.32 |
| Miami | 0.72 | -1.72 |
| Key West | 0.97 | -1.19 |
Figure 2. A graphical depiction of the monthly rainfall departure from normal (inches) for December 2025 (courtesy of NOAA, NWS).
La Niña Advisory.
La Niña conditions persisted over the past month in the tropical equatorial Pacific Ocean. Below-average sea surface temperatures continued across the east-central region of the equatorial Pacific Ocean. The latest weekly Niño-3.4 index was -0.5°C and the Niño-3 and Niño-1+2 indices were -0.8°C and -0.7°C, respectively. Subsurface temperature anomalies became slightly positive, and atmospheric anomalies across the tropical Pacific remained consistent with La Niña. A transition to ENSO-neutral is expected during January-March 2026 (75% chance). ENSO-neutral is likely to continue through the Northern Hemisphere late spring 2026.
Hazardous Weather Events in December.
According to the Local Storm Reports issued by the local National Weather Service offices serving Florida, there were 48 individual local reports of hazardous weather events recorded across the state during the month of December (see Table 3 for a breakdown by event type). Multiple reports of strong wind gusts and heavy rain were reported on the 7th and 8th along a frontal boundary in central Florida, stretching from Pasco to Brevard County. Overall it was another relatively quiet month for severe weather.
Table 3. Breakdown of storm reports submitted in Florida during the month of December (compiled from Iowa State University/Iowa Environmental Mesonet).
| Report Type | Number of Reports |
| Heavy Rain | 19 |
| Dense Fog | 2 |
| Flood | 0 |
| Marine Thunderstorm Wind | 5 |
| Non-Thunderstorm Wind Gust | 11 |
| Tornado/Waterspout/Funnel Cloud | 0 / 0 / 0 |
| Thunderstorm Wind Damage | 1 |
| Non-Thunderstorm Wind Damage | 0 |
| Thunderstorm Wind Gust | 10 |
Daily Record Events in December.
Table 4. Summary of daily records broken or set in Florida in December (source: NCEI Daily Weather Records).
| Category | Number of Records |
| Highest daily max. temp. | 14 |
| Highest daily min. temp. | 5 |
| Lowest daily max. temp. | 0 |
| Lowest daily min. temp. | 0 |
| Highest daily precipitation | 21 |
| Total | 40 |
Drought-Related Impacts.
Drought conditions improved but persisted in the Panhandle, with sufficient rainfall early in the month to remove exceptional drought (D4). Meanwhile, moderate to severe drought expanded in the Florida Peninsula. In mid-December, approximately 4% of the state was in extreme drought (D3), 14% was in severe drought (D2), and 51% was in moderate drought (D1); about 19% of the state was abnormally dry (D0), according to the U.S. Drought Monitor. By month’s end, roughly 4% of the state was in extreme drought (D3), 28% was in severe drought (D2), 52% was in moderate drought (D1), and 16% of the state was abnormally dry (D0) (Figure 2 below).
As of December 31, the Lake Okeechobee water level was 13.35 ft. above sea level (Feet-NGVD29), which is below average for this time of year. At the first of December, the water level was 13.66 ft. above sea level.
Figure 3. A graphical depiction of the latest drought conditions in Florida according to the U.S. Drought Monitor (courtesy of the National Drought Mitigation Center, University of Nebraska-Lincoln).
Agriculture-Related Impacts.
Appendix 1
Additional December departures from normal data for select Florida locations (source: NWS).
| Station | Average Temperature (˚F) | Departure from Normal (˚F) | Total Rainfall (in.) | Departure from Normal (in.) |
| Gainesville | 59.8 | +2.5 | 1.75 | -1.13 |
| Sarasota | 68.1 | +2.9 | 1.71 | -0.62 |
| Melbourne | 66.6 | +1.9 | 1.28 | -1.08 |
| Fort Myers | 69.6 | +2.3 | 0.64 | -1.26 |
| West Palm Beach | 72.1 | +3.1 | 0.83 | -2.65 |
Appendix 2
Christmas Day maximum temperatures, departures from normal and all-time daily records for select locations (source: NWS).
| Station | Max Temperature Dec. 25, 2025 (˚F) | Departure from Normal(˚F) | Warmest Christmas on Record (˚F) |
| Pensacola | 78 | +14 | 78 in 2023, 1974, 1955 |
| Tallahassee | 80 | +15 | 82 in 2016 |
| Jacksonville | 80 | +14 | 82 in 2015 |
| Gainesville | 81 | +13 | 83 in 2015 |
| Tampa | 80 | +7 | 86 in 2016, 2015 |
| Orlando | 79 | +6 | 86 in 2015 |
| Melbourne | 79 | +4 | 83 in 2015 |
| Miami | 81 | +4 | 85 in 2016, 1941 |
| Sarasota/Bradenton | 81 | +8 | 85 in 2016, 2015 |
| Fort Myers | 82 | +6 | 88 in 2016 |
| Key West | 77 | +0 | 83 in 2015 |