


Prepared by Florida Climate Center
The Florida State University
Tallahassee, FL

Summary:
- Average monthly temperatures in May were above normal across Florida.
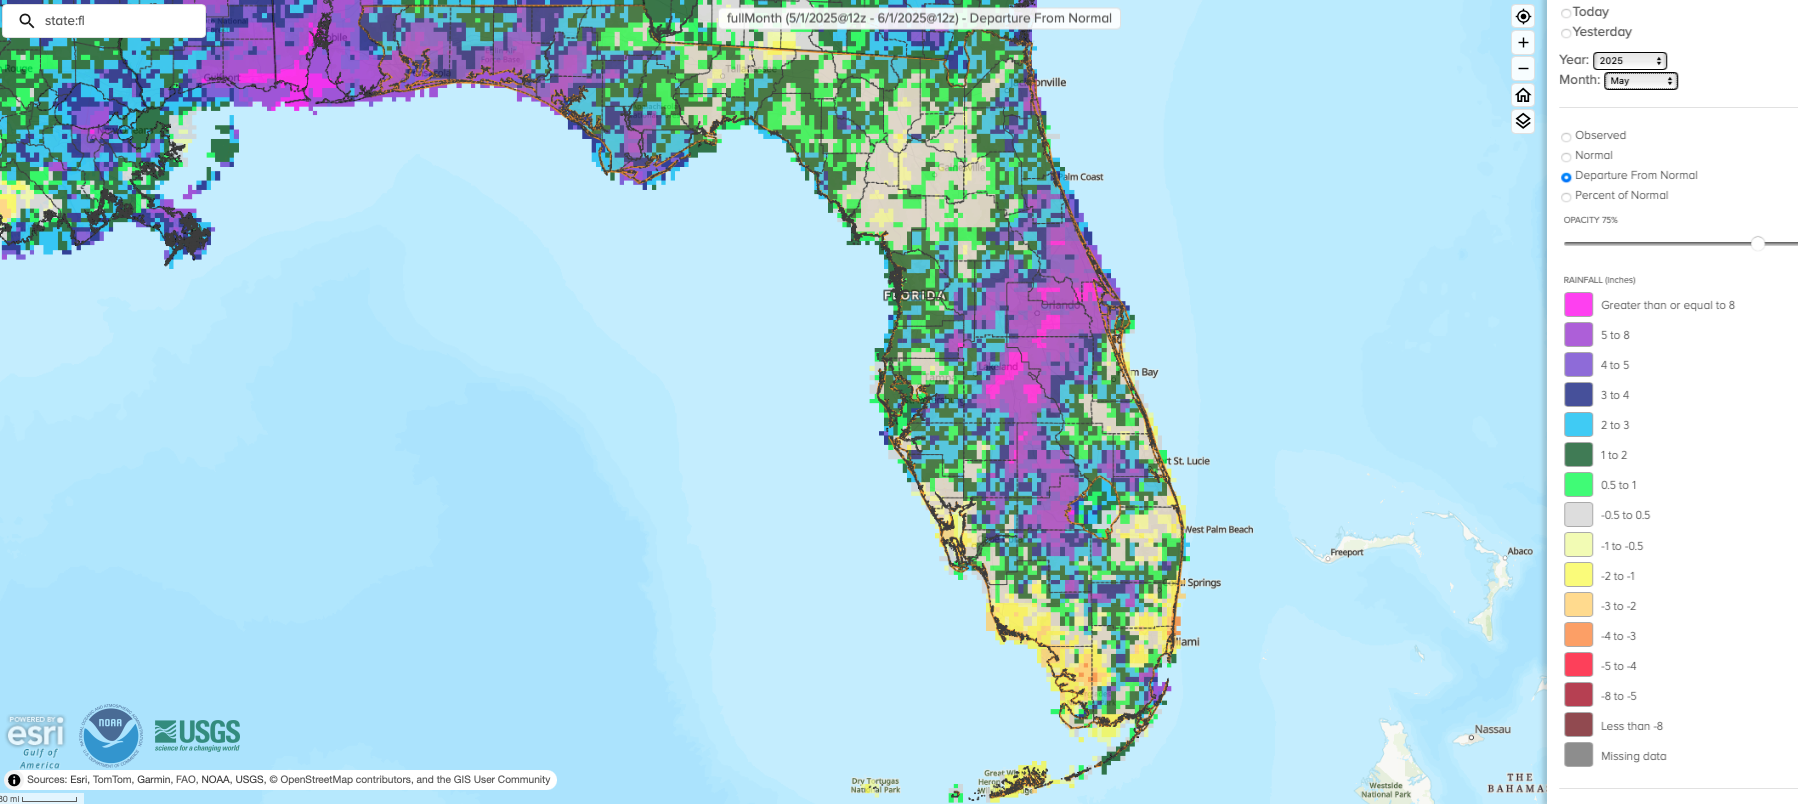
- Monthly precipitation totals in May were generally above normal except in parts of South Florida.
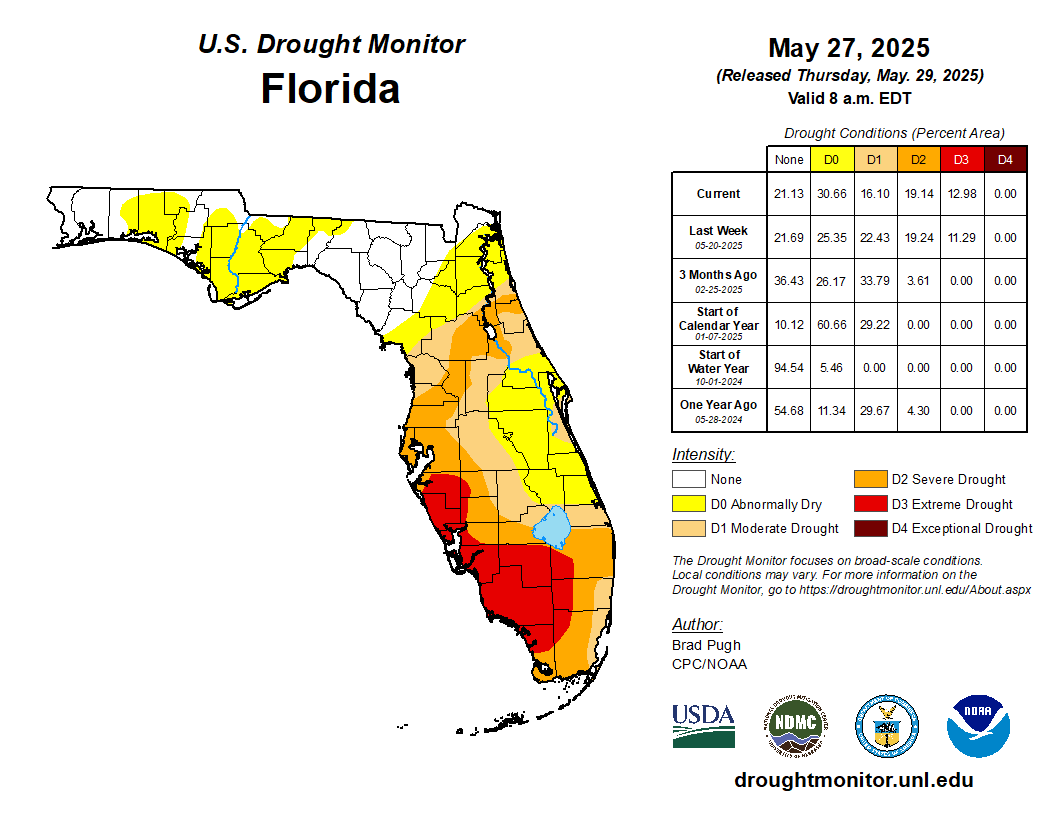
- By the end of May, drought conditions had improved across much of the state but extreme drought (D3) expanded in southwest Florida, according to the U.S. Drought Monitor.
- ENSO-neutral conditions continued in the tropical Pacific Ocean and are expected to persist through the Northern Hemisphere summer (74% chance during June-August 2025).
Table 1. May average temperatures and departures from normal ( ̊F) for selected cities.
| Station | Mean Temperature | Departure from Normal |
| Pensacola | 76.3 | +0.3 |
| Tallahassee | 78.3 | +3.1 |
| Jacksonville | 78.6 | +3.7 |
| Orlando | 80.6 | +3.3 |
| Tampa | 82.6 | +3.1 |
| Miami | 82.4 | +2.3 |
| Key West | 82.9 | +1.8 |
Table 2. May precipitation totals and departures from normal (inches) for selected cities.
| Station | Total Rainfall | Departure from Normal |
| Pensacola | 6.99 | +3.09 |
| Tallahassee | 3.43 | +0.07 |
| Jacksonville | 3.34 | -0.08 |
| Orlando | 13.18 | +9.16 |
| Tampa | 4.18 | +1.58 |
| Miami | 7.98 | +1.66 |
| Key West | 1.40 | -1.72 |
Figure 1. A graphical depiction of the monthly rainfall departure from normal (inches) for May (courtesy of NOAA, NWS).
ENSO-Neutral Conditions Present in Pacific.
ENSO-neutral conditions are currently present in the tropical equatorial Pacific Ocean. Over the past month, near-average sea surface temperatures covered most of the equatorial Pacific Ocean, and all the weekly Niño index values were near zero. ENSO-neutral conditions are favored to persist through the Northern Hemisphere summer (74% chance during June-August 2025). There is a greater than 50% chance of ENSO-neutral extending through October 2025.
Hazardous Weather Events in May.
According to the Local Storm Reports issued by the local National Weather Service offices serving Florida, there were 382 individual local reports of hazardous weather events recorded across the state during the month of May (see Table 3 for a breakdown by event type). Severe thunderstorm activity ramped up during the month, with reports of hail up to golf ball size, damaging winds, heavy rain, and several reports of tornadoes. Rip currents led to two fatalities during the month, and another fatality occurred due to a snapped tree during a thunderstorm in Ocala on the 29th. Wildfires during the month led to road closures and one fire resulted in mandatory evacuations in Marion County during the early part of the month, though the wildfire was quickly contained.
Table 3. Breakdown of storm reports submitted in Florida during the month of May (compiled from Iowa State University/Iowa Environmental Mesonet).
| Report Type | Number of Reports |
| Heavy Rain | 28 |
| Flash Flood | 4 |
| Flood | 2 |
| Hail | 92 |
| Marine Thunderstorm Wind | 43 |
| Non-Thunderstorm Wind Gust | 0 |
| Tornado/Waterspout/Funnel Cloud | 11 / 15 / 16 |
| Thunderstorm Wind Damage | 47 |
| Non-Thunderstorm Wind Damage | 0 |
| Thunderstorm Wind Gust | 108 |
| Wildfire | 8 |
| Rip Currents | 3 |
Daily Record Events in May.
Table 4. Summary of daily records broken or set in Florida in May (source: NCEI Daily Weather Records).
| Category | Number of Records |
| Highest daily max. temp. | 67 |
| Highest daily min. temp. | 79 |
| Lowest daily max. temp. | 1 |
| Lowest daily min. temp. | 0 |
| Highest daily precipitation | 46 |
| Total | 193 |
Drought-Related Impacts.
Drought conditions improved in Florida during May, but extreme drought expanded in southwest Florida which missed out on heavy rainfall during the month. In mid-May, roughly 9% of the state was in extreme drought (D3), 21% was in severe drought (D2), 21% of the state was in moderate drought (D1), and 36% was abnormally dry (D0), according to the U.S. Drought Monitor. By the end of the month, approximately 13% of the state was in extreme drought (D3), 19% was in severe drought (D2), 16% was in moderate drought (D1), and 31% of the state was abnormally dry (D0) (Figure 2 below).
As of May 31, the Lake Okeechobee water level was 10.95 ft. above sea level (Feet-NGVD29), which is below average for this time of year. At the first of the month, the water level was 11.22 ft. above sea level.
Figure 3. A graphical depiction of the latest drought conditions in Florida according to the U.S. Drought Monitor (courtesy of the National Drought Mitigation Center, University of Nebraska-Lincoln).
Agriculture-Related Impacts.
In mid-May, topsoil moisture conditions were adequate in 59% of the state, short in 31%, and very short in 9% of the state, while 1% of the state had surplus topsoil moisture conditions. By the end of May, topsoil moisture conditions were adequate in 50% of the state, short in 33%, and very short in 10% of the state; while 7% of the state had surplus topsoil moisture conditions. For more information, consult the Crop Progress and Conditions report, which is published by the USDA’s National Agricultural Statistics Service.
Appendix 1
Additional May departures from normal data for select Florida locations (Source: NWS).
| Station | Average Temperature (˚F) | Departure from Normal (˚F) | Total Rainfall (in.) | Departure from Normal (in.) |
| Gainesville | 78.4 | +3.4 | 2.86 | -0.22 |
| Sarasota | 80.1 | +2.3 | 2.80 | +0.22 |
| Melbourne | 79.9 | +3.1 | 4.43 | +0.90 |
| Fort Myers | 82.0 | +2.7 | 3.69 | +0.23 |
| West Palm Beach | 82.2 | +3.5 | 4.28 | -0.63 |
Appendix 2
Select daily record high maximum temperatures (°F) tied or broken during May 2025 (compiled from NOAA).
| Location | Date | Record (˚F) | Broken/Tied | Last |
| Bradenton | 6 | 92 | Broken | 91 in 2024 |
| Key West | 6 | 92 | Broken | 91 in 2024 |
| Jacksonville Beach | 16 | 96 | Broken | 92 in 1961 |
| Orlando | 16 | 96 | Broken | 94 in 1995 |
| Daytona Beach | 16 | 96 | Broken | 94 in 1994 |
| Jacksonville | 16 | 97 | Broken | 96 in 1995 |
| Tallahassee | 16 | 98 | Broken | 95 in 1962 |
| Clermont | 17 | 99 | Broken | 97 in 1981 |
| Daytona Beach | 17 | 94 | Broken | 93 in 2001 |
| St. Augustine | 17 | 96 | Broken | 93 in 1990 |
| Tallahassee | 17 | 98 | Broken | 94 in 1993 |
| Clermont | 18 | 98 | Broken | 96 in 2003 |
| Ft. Lauderdale | 18 | 92 | Broken | 90 in 2023 |
| Clermont | 20 | 98 | Broken | 96 in 2015 |
| Vero Beach | 21 | 96 | Broken | 95 in 2015 |
| Daytona Beach | 22 | 96 | Broken | 95 in 1938 |
| Ft. Lauderdale | 22 | 96 | Broken | 95 in 1990 |
| Fort Pierce | 22 | 97 | Broken | 95 in 1988 |
| Homestead | 22 | 98 | Broken | 96 in 2020 |
| Vero Beach | 22 | 95 | Broken | 94 in 2016 |
| Key West | 22 | 96 | Broken | 92 in 2020 |
| Ft. Lauderdale | 23 | 96 | Broken | 94 in 1951 |
| Homestead | 23 | 98 | Broken | 96 in 2015 |
| Bradenton | 24 | 97 | Broken | 95 in 2024 |
| Clermont | 24 | 99 | Broken | 98 in 2000 |
| Clermont | 25 | 100 | Broken | 98 in 2024 |
| Ft. Lauderdale | 26 | 96 | Broken | 94 in 1963 |
| Bradenton | 29 | 97 | Broken | 95 in 2024 |
| Ft. Lauderdale Beach | 29 | 94 | Broken | 92 in 2017 |