


Prepared by Florida Climate Center
The Florida State University
Tallahassee, FL

Summary:
- This month brought extreme weather and record heat to the state.
- Average monthly temperatures in May were above normal, with record warmth across central and southern Florida.
- Monthly precipitation totals were above normal in the Panhandle and below normal in the Peninsula.
- Drought expanded across central to south Florida and severe drought (D2) was introduced in Sarasota and Charlotte Counties east to parts of Highlands and Glades Counties.
- A transition to ENSO-neutral conditions is expected sometime in the next month; a transition to La Nina conditions is expected during July-September (69% chance).
Average monthly temperatures in May were above normal. Average monthly temperature departures from normal ranged from +1.5 ̊F in Pensacola to +5.5 ̊F in West Palm Beach for the month (see Table 1 and Appendix 1 for select cities). It was still technically spring, but May 2024 felt like the middle of summer in southern Florida with record breaking heat indices during the middle and end of the month. May 2024 became the hottest May on record for most stations throughout the Peninsula, including Orlando, Melbourne, Tampa, Sarasota, Lakeland, Fort Myers, Naples, West Palm Beach, Miami, Homestead, and Key West. The Hollywood North Perry Airport hit 100 ̊F on May 15th and 26th, and it hit 101 ̊F on the 19th, which became the all-time highest temperature for that station. The Sarasota Bradenton AP reached a high temperature of 99 ̊F on the 30th. West Palm Beach and Fort Lauderdale experienced a peak heat index of 115 ̊F on May 18th. The Miami International Airport station reached triple digit heat indices earliest on record and tied its 3rd-highest heat index value of 112 ̊F on the 18th and 19th. Key West hit a heat index value of 114 ̊F on the 15th. High SSTs and a large area of high pressure are contributing to these extreme temperatures. There was a total of 146 daily high maximum temperature records set during the month; select daily high maximum temperature records are provided in Appendix 2.
Table 1. May average temperatures and departures from normal ( ̊F) for selected cities.
| Station | Mean Temperature | Departure from Normal |
| Pensacola | 77.5 | +1.5 |
| Tallahassee | 78.6 | +3.4 |
| Jacksonville | 78.3 | +3.4 |
| Orlando | 81.4 | +4.1 |
| Tampa | 83.0 | +3.5 |
| Miami | 83.7 | +3.6 |
| Key West | 84.7 | +3.6 |
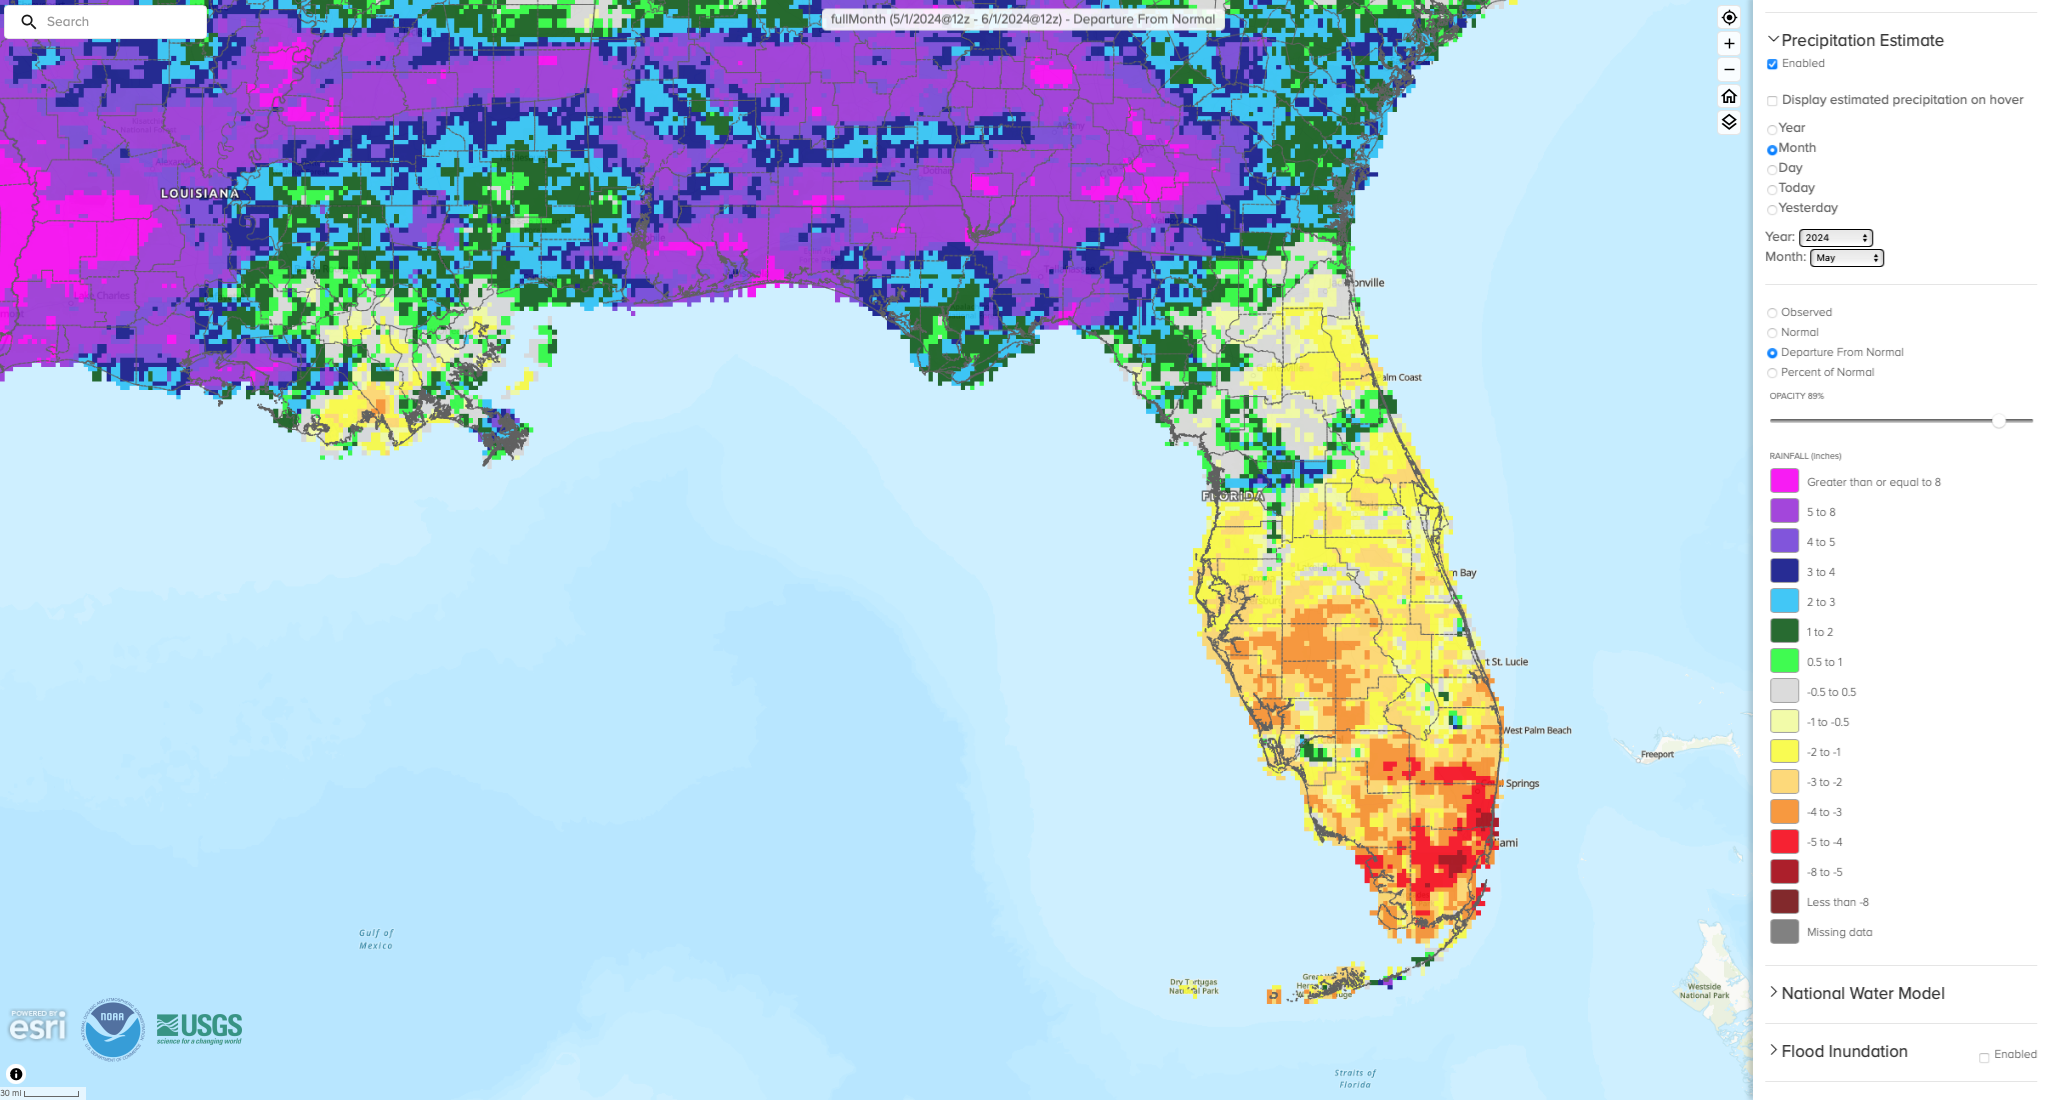
Monthly rainfall totals in May were above normal in the Panhandle and below normal across the Peninsula. The monthly precipitation departures from normal ranged from -5.89 inches in Ft. Lauderdale to +4.33 inches in Tallahassee (see Table 2 and Appendix 1 for select locations). Sarasota experienced its driest May on record (based on a 113-year period of record). As a result of drying conditions and record high temperatures across the central and southern Peninsula, moderate drought conditions expanded and severe drought emerged in southwest Florida in parts of Sarasota and Charlotte Counties east to Glades and southern Highlands County (see below for more drought information).
Table 2. May precipitation totals and departures from normal (inches) for selected cities.
| Station | Total Rainfall | Departure from Normal |
| Pensacola | 7.38 | +3.48 |
| Tallahassee | 7.69 | +4.33 |
| Jacksonville | 3.05 | -0.37 |
| Orlando | 1.80 | -2.22 |
| Tampa | 1.07 | -1.53 |
| Miami | 4.21 | -2.11 |
| Key West | 2.13 | -0.99 |
Figure 1. A graphical depiction of the monthly rainfall departure from normal (inches) for May (courtesy of NOAA, NWS).
El Niño Advisory / La Niña Watch.
El Niño conditions, the warm phase of the El Niño Southern Oscillation climate pattern in the tropical equatorial Pacific Ocean, have continued to weaken. A transition to ENSO-neutral is expected within the next month. The atmospheric components of El Niño have essentially shut off, while ocean signals have weakened with some regions seeing decreased sea surface temperatures and lower Niño index values over the last month. La Niña is expected to emerge during June-August 2024 (49% chance). Chances increase to 69% deeper into summer, during July-September 2024. Historically, La Niña conditions typically follow strong El Niños, which adds to the forecast confidence.
Hazardous Weather Events in May.
According to the Local Storm Reports issued by the local National Weather Service offices serving Florida, there were 465 individual local reports of hazardous weather events recorded across the state during the month of May (see Table 4 for a breakdown by event type). An active weather pattern this month led to severe weather across the state with high winds and golf-ball sized hail leading to downed trees, downed power lines, and flash flooding. Strong storms and straight-line winds impacted parts of southwest Florida, and the Panhandle saw multiple rounds of severe weather with straight-line winds and tornadoes. This includes an outbreak in Leon and surrounding counties on May 10th, which is described in more detail below.
Table 3. Breakdown of storm reports submitted in Florida during the month of May (compiled from Iowa State University/Iowa Environmental Mesonet).
| Report Type | Number of Reports |
| Heavy Rain | 3 |
| Flood | 3 |
| Flash Flood | 18 |
| Coastal Flood | 0 |
| Hail | 51 |
| Marine Thunderstorm Wind | 41 |
| Non-Thunderstorm Wind Gust | 18 |
| Non-Thunderstorm Wind Damage | 0 |
| Tornado/Waterspout/Funnel Cloud | 8/5/8 |
| Thunderstorm Wind Damage | 103 |
| Thunderstorm Wind Gust | 201 |
| Rip Currents | 0 |
| Lightning | 1 |
| Wildfire | 5 |
Daily Record Events in May.
Table 4. Summary of daily records broken or set in Florida in May (source: NCEI Daily Weather Records).
| Category | Number of Records |
| Highest daily max. temp. | 146 |
| Highest daily min. temp. | 172 |
| Lowest daily max. temp. | 3 |
| Lowest daily min. temp. | 0 |
| Highest daily precipitation | 29 |
| Total | 350 |
Weather/Climate Highlights of the Month: May 10th Tornadoes in Leon County.
May brought an active weather pattern both in Florida and across the country. Nationally, the number of local storm reports since January 1st ranks 2nd dating back to 2010. A tornado outbreak on May 8-10 affected much of the Southeast U.S. On the morning of May 10, a squall line affected the tri-state area with 100+ mph straight-line winds and the storm spawned 5 tornadoes in the area. Three tornadoes touched down in Tallahassee in less than 30 minutes, according to the National Weather Service. The number of broken power poles from this event exceeded that from hurricanes Hermine, Michael, and Idalia combined, according to NWS and the City of Tallahassee. Over 70,000 customers were without power on Friday, and over 400 utility poles were downed. In addition to damage to utility structures, numerous trees were broken, homes damaged, and businesses affected, including FSU, FAMU, and the Railroad Square district.
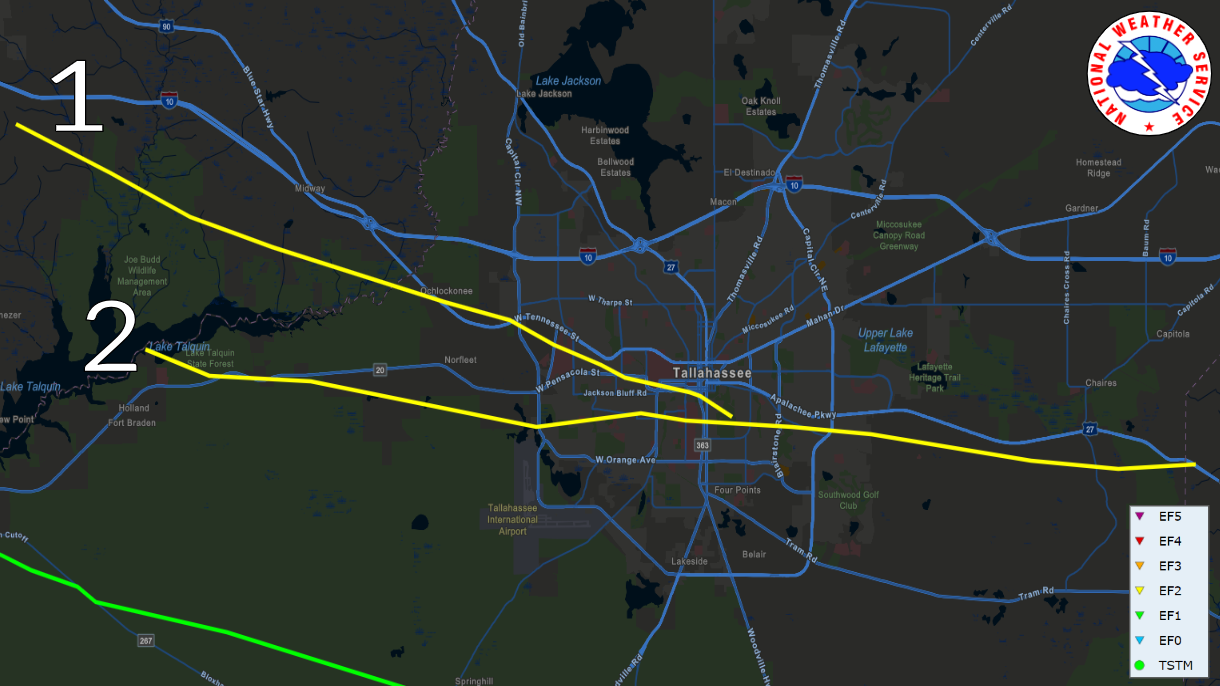
The first tornado path shown in the image above was rated an EF2. It was on the ground for nearly 20 miles with peak wind speeds of 115 mph. The second tornado was also rated EF2 and was on the ground for 27 miles. These two tornadoes converged at the Capital City Country Club in Tallahassee, where the second tornado became the dominant circulation moving on toward the east. A third tornado, rated EF1 (shown in the bottom left of the image above) moved across southern Leon County in Woodville with a path length of nearly 32 miles and peak wind speeds of 110 mph. Three other tornadoes, including an EF1 and two EF0s touched down in surrounding counties. Read more about the storm and damages from the Tallahassee National Weather Service office here: https://www.weather.gov/tae/2024_05_Tornadoes.
Drought-Related Impacts.
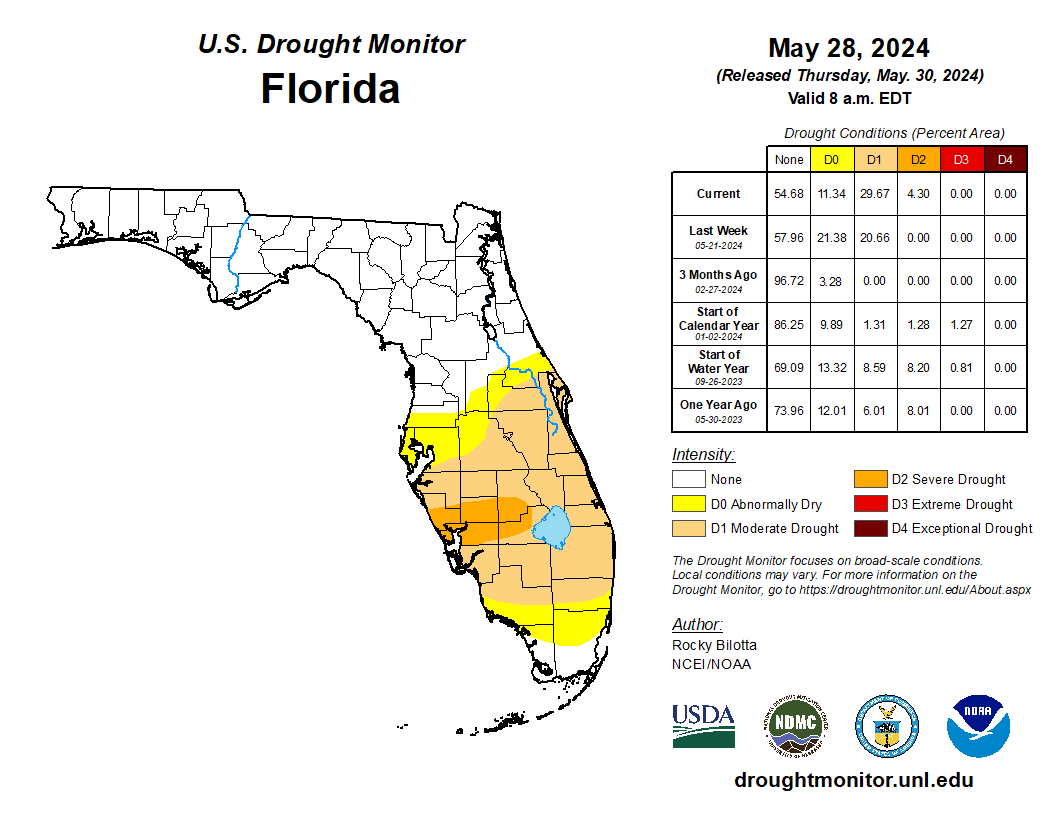
By mid-May, approximately 16% of the state was experiencing moderate drought (D1) conditions and 22% of the state was abnormally dry (D0), according to the U.S. Drought Monitor. Drought expansion and degradation occurred by the end of the month, with 4% of the state in severe drought (D2), 30% in moderate drought (D1), and 11% abnormally dry (D0) (see Figure 3 below). As of the end of the month, 13 counties in central and southern Florida had outdoor burn bans in place, and wildfires broke out during the month across these regions.
As of May 31, the Lake Okeechobee water level was 12.97 ft. above sea level (Feet-NGVD29), which is just below average for this time of year. At the first of the month, the water level was 14.18 ft. above sea level.
Figure 2. A graphical depiction of the latest drought conditions in Florida according to the U.S. Drought Monitor (courtesy of the National Drought Mitigation Center, University of Nebraska-Lincoln).
Agriculture-Related Impacts.
In mid-May, topsoil moisture conditions were adequate in 71% of the state, short in 23%, and very short in 5% of the state, while 1% of the state had surplus topsoil moisture conditions. Near the end of May, topsoil moisture conditions were adequate in 65% of the state, short in 23%, and very short in 7% of the state; 5% of the state was in surplus conditions. While much of the Southeast region has grappled with wet conditions, drought is beginning to affect the main citrus belt region in Florida with daily irrigation needed. For more information, consult the Crop Progress and Conditions report, which is published by the USDA’s National Agricultural Statistics Service.
Appendix 1
Additional May departures from normal data for select Florida locations (Source: NWS).
| Station | Average Temperature (˚F) | Departure from Normal (˚F) | Total Rainfall (in.) | Departure from Normal (in.) |
| Gainesville | 77.4 | +2.4 | 1.59 | -1.49 |
| Sarasota | 81.4 | +3.6 | 0.02 | -2.56 |
| Naples | 83.0 | +4.2 | 0.72 | -2.04 |
| Fort Myers | 83.2 | +3.9 | 3.83 | +0.37 |
| West Palm Beach | 84.2 | +5.5 | 1.18 | -3.73 |
Appendix 2
Select daily record high maximum temperatures (°F) broken during May (compiled from NOAA).
| Location | Date | Record | Broken/Tied | Last |
| Orlando | 8 | 96 | Broken | 95 in 2009 |
| Jacksonville | 8 | 97 | Broken | 95 in 2009 |
| Clermont | 9 | 97 | Broken | 96 in 2009 |
| Deland | 9 | 97 | Broken | 96 in 1916 |
| Plant City | 9 | 100 | Broken | 96 in 1955 |
| Orlando | 9 | 97 | Broken | 95 in 2009 |
| Daytona Beach | 9 | 97 | Broken | 94 in 1978 |
| Tallahassee | 9 | 96 | Broken | 95 in 2015 |
| Jacksonville | 9 | 99 | Broken | 95 in 2009 |
| Hialeah | 10 | 96 | Broken | 94 in 1998 |
| Vero Beach | 10 | 96 | Broken | 92 in 1998 |
| Fort Lauderdale | 11 | 96 | Broken | 93 in 2008 |
| West Palm Beach | 11 | 97 | Broken | 95 in 2011 |
| Key West | 11 | 94 | Broken | 90 in 2019 |
| Homestead | 13 | 96 | Broken | 93 in 2021 |
| Fort Lauderdale | 14 | 96 | Broken | 94 in 1971 |
| Key West | 15 | 92 | Broken | 90 in 1991 |
| West Palm Beach | 15 | 98 | Broken | 94 in 1995 |
| Fort Lauderdale | 16 | 96 | Broken | 94 in 1995 |
| Homestead | 17 | 97 | Broken | 92 in 2022 |
| Hialeah | 18 | 96 | Broken | 93 in 1989 |
| Orlando | 18 | 96 | Broken | 95 in 1981 |
| Fort Lauderdale | 19 | 98 | Broken | 94 in 2008 |
| West Palm Beach | 19 | 98 | Broken | 94 in 2008 |
| Miami | 19 | 96 | Broken | 94 in 1995 |
| Homestead | 20 | 100 | Broken | 93 in 2008 |
| Bradenton | 25 | 98 | Broken | 94 in 2015 |
| Bradenton | 26 | 97 | Broken | 95 in 1975 |
| Homestead | 26 | 98 | Broken | 92 in 1999 |
| Miami | 26 | 96 | Broken | 94 in 1949 |
| Homestead | 26 | 98 | Broken | 92 in 1999 |
| Miami | 26 | 96 | Broken | 94 in 1949 |
| Archbold Bio Stn | 27 | 100 | Broken | 99 in 2000 |
| Fort Lauderdale | 27 | 99 | Broken | 94 in 1924 |
| Homestead | 27 | 98 | Broken | 93 in 1999 |
| Fort Pierce | 28 | 97 | Broken | 95 in 1973 |
| West Palm Beach | 28 | 99 | Broken | 93 in 2017 |
| Stuart | 29 | 97 | Broken | 95 in 1973 |
| Bradenton | 30 | 100 | Broken | 95 in 2005 |
| Clermont | 30 | 100 | Broken | 98 in 2019 |
| Homestead | 30 | 98 | Broken | 92 in 2017 |
| Tampa | 30 | 98 | Broken | 96 in 2022 |