
Prepared by Florida Climate Center
The Florida State University
Tallahassee, FL

Summary:
- Average monthly temperatures in February were near to below normal.
- Monthly precipitation totals were below normal in North Florida and above normal in South Florida.
- With the wet and stormy weather this season, drought has virtually disappeared in Florida.
- El Niño is beginning to weaken and is expected to transition to ENSO-neutral conditions during April-June 2024 (79% chance), with a possible transition to La Niña during June-August (55% chance).
Average monthly temperatures in February were near to below normal. Average temperature departures from normal ranged from -2.2 ̊F in Key West to +0.9 ̊F in Tallahassee for the month (see Table 1 and Appendix 1 for select cities). Temperatures vacillated throughout the month between below and above normal, averaging out to near normal for the month as a whole. South Florida was the coolest part of the state, with monthly average temperatures ranging from 1-4 ̊F below normal, while the Panhandle was about 1 ̊F above normal for the month. Very few daily high or low temperature records were broken during the month.
Table 1. February average temperatures and departures from normal ( ̊F) for selected cities.
| Station | Mean Temperature | Departure from Normal |
| Pensacola | 57.5 | +0.7 |
| Tallahassee | 56.5 | +0.9 |
| Jacksonville | 57.5 | 0.0 |
| Orlando | 63.6 | 0.0 |
| Tampa | 63.3 | -1.4 |
| Miami | 69.0 | -1.7 |
| Key West | 70.1 | -2.2 |
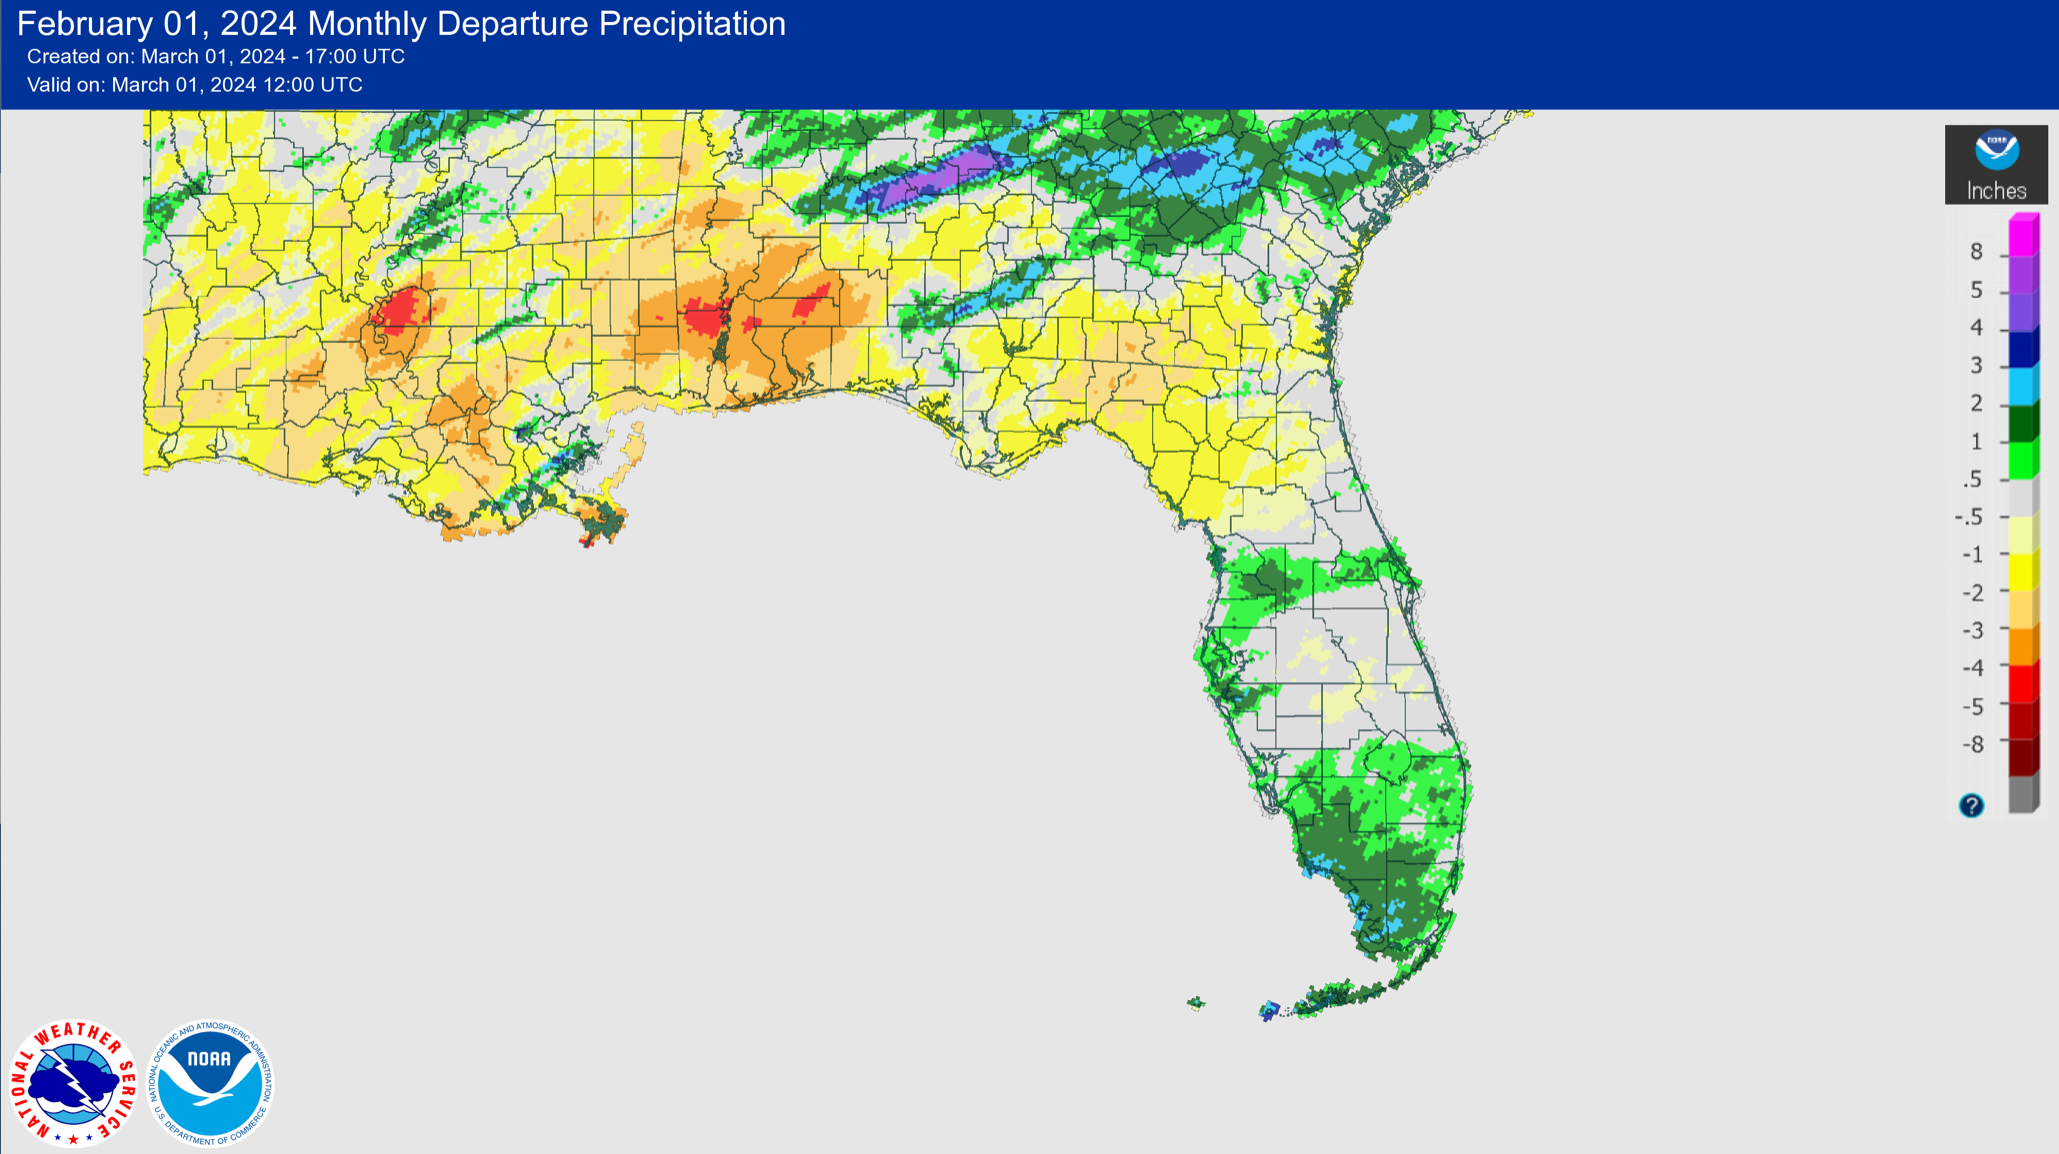
Monthly rainfall totals in February were below normal in North Florida and above normal in South Florida. The monthly precipitation departures from normal ranged from -3.40 inches in Pensacola to +2.71 inches in Key West (see Table 2 and Appendix 1 for select locations). South Florida remained wet during February, while rainfall in North Florida and the Panhandle ended up below normal for the month. Naples, Melbourne, and Key West had their 2nd-wettest February on record, while Pensacola had its 3rd-driest February on record. Winter precipitation (DJF) was above normal across Florida overall, with some areas receiving 6+ inches of surplus rainfall in the Florida Panhandle. It was the wettest winter on record for Apalachicola and Key West, and it was the 2nd-wettest winter on record in Tallahassee, Venice, Fort Myers, and Melbourne. El Nino rainfall since December led to drought removal across the state by the end of February.
Table 2. February precipitation totals and departures from normal (inches) for selected cities.
| Station | Total Rainfall | Departure from Normal |
| Pensacola | 1.37 | -3.40 |
| Tallahassee | 2.25 | -2.03 |
| Jacksonville | 2.44 | -0.42 |
| Orlando | 2.41 | +0.37 |
| Tampa | 3.32 | +0.70 |
| Miami | 3.03 | +0.88 |
| Key West | 4.25 | +2.71 |
Figure 1. A graphical depiction of the monthly rainfall departure from normal (inches) for February (courtesy of NOAA, NWS).
El Niño Advisory.
El Niño conditions, the warm phase of the El Niño Southern Oscillation climate pattern in the tropical equatorial Pacific Ocean, continued but SST anomalies and area-averaged subsurface temperature anomalies have weakened in the eastern and east-central Pacific. Atmospheric anomalies across the topical Pacific Ocean also weakened. A transition to ENSO-neutral conditions is expected during April-June 2024 (79% chance). There are increasing chances of a transition to La Niña during June-August (55% chance). Despite the spring predictability barrier, historical data indicate that La Niña tends to follow strong El Niño events, providing greater reliability in the forecast.
Hazardous Weather Events in February.
According to the Local Storm Reports issued by the local National Weather Service offices serving Florida, there were 206 individual local reports of hazardous weather events recorded across the state during the month of February (see Table 4 for a breakdown by event type). Stormy weather was reported throughout the month, with strong winds and up to 1.5-inch sized hail. Several tornadoes were reported, with some damage associated with these storms but no injuries or fatalities.
Table 3. Breakdown of storm reports submitted in Florida during the month of February (compiled from Iowa State University/Iowa Environmental Mesonet).
| Report Type | Number of Reports |
| Heavy Rain | 8 |
| Flood | 0 |
| Flash Flood | 0 |
| Coastal Flood | 1 |
| Hail | 40 |
| Non-Thunderstorm Wind Gust | 93 |
| Non-Thunderstorm Wind Damage | 0 |
| Tornado/Waterspout/Funnel Cloud | 8/0/0 |
| Thunderstorm Wind Damage | 9 |
| Thunderstorm Wind Gust | 46 |
| Rip Currents | 1 |
| Wildfire | 1 |
Daily Record Events in February.
Table 4. Summary of daily records broken or set in Florida in February (source: NCEI Daily Weather Records).
| Category | Number of Records |
| Highest daily max. temp. | 1 |
| Highest daily min. temp. | 4 |
| Lowest daily max. temp. | 1 |
| Lowest daily min. temp. | 0 |
| Highest daily precipitation | 25 |
| Total | 31 |
Weather/Climate Highlights of the Month: El Niño.
This El Niño event will rank as the 5th-strongest El Niño on record since 1950, with a SST Niño-3.4 index value over +2.0 ºC. This has been a very typical and impactful El Niño event, with a very cloudy, rainy and stormy winter across Florida. Severe weather reports since January 1 show a cluster of tornado and severe wind reports in the Panhandle and southeast Florida.
El Niño started a bit late, and we had a streak of around 30 consecutive days without measurable rainfall in north Florida during October-November, which resulted in the development of flash drought in the western Panhandle in November. However, by December, El Niño rainfall began to kick in and during December-February, some places had as many as 30 days with measurable rainfall. Stream flows are now running normal to above normal across the state. It became the cloudiest winter on record in the Florida Peninsula, based on an 84-year period.
All strong El Niño events in the past were followed by a rapid transition to La Niña conditions the following summer. It is looking likely that this will happen again this year. Given recent forecasts, we are now in both an El Niño Advisory and a La Niña watch at the same time.
Drought-Related Impacts.
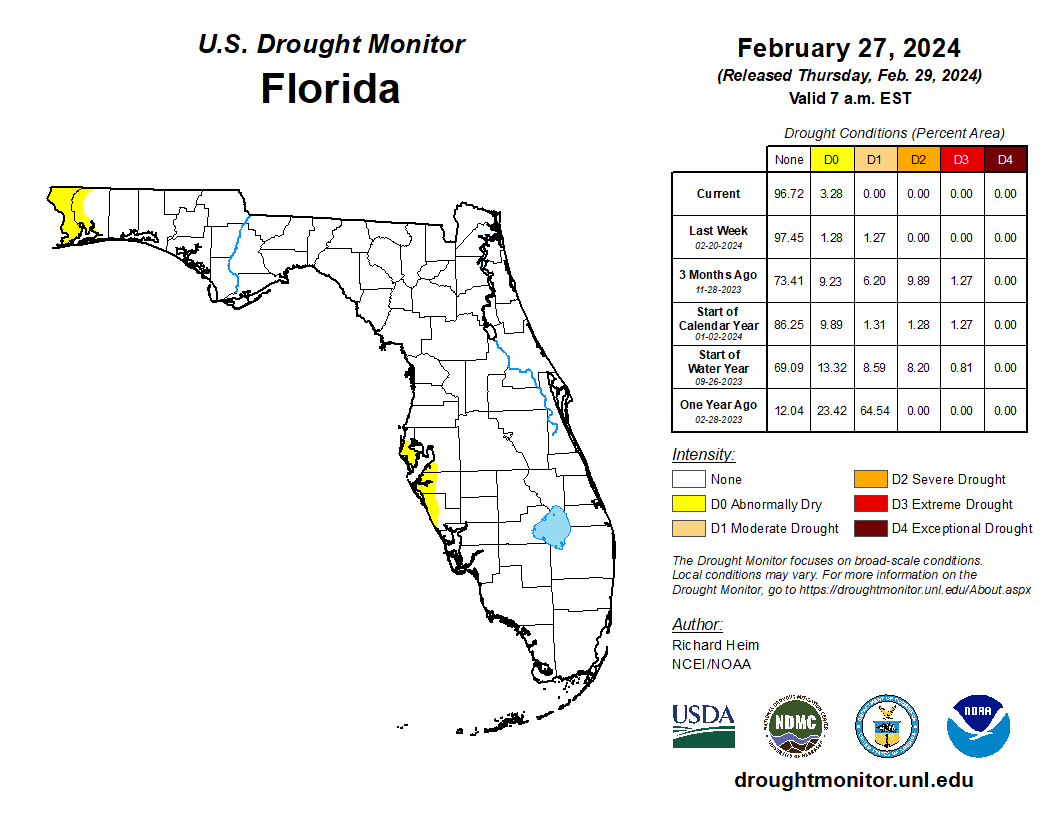
Above-normal rainfall this winter has led to drought removal in Florida. By mid-February, approximately 1.27% of the state remained in moderate drought (D1) and 1.28% was abnormally dry (D0), according to the U.S. Drought Monitor. By the end of the month, moderate drought (D1) had been removed and 3.28% was abnormally dry (D0) (see Figure 3 below).
As of February 29, the Lake Okeechobee water level was 16.15 ft. above sea level (Feet-NGVD29), which is above average for this time of year. At the first of the month, the water level was 16.28 ft. above sea level.
Figure 2. A graphical depiction of the latest drought conditions in Florida according to the U.S. Drought Monitor (courtesy of the National Drought Mitigation Center, University of Nebraska-Lincoln).
Agriculture-Related Impacts.
In February, moderate amounts of rainfall and near normal temperatures have led to mostly fair to good pasture and livestock conditions during the month. Some sugarcane operations were delayed due to high winds and heavy rain. Blueberries have been starting to bloom; however, strawberry producers in central Florida experienced significant fruit damage and drop from rain and wind mid-month. Heavy rains also delayed rice planting. First spring leaf out was delayed in northern Florida this season due to cold conditions earlier in winter. For more information, consult the Crop Progress State Stories, which is published by the USDA’s National Agricultural Statistics Service December through March.
Appendix 1
Additional February departures from normal data for select Florida locations (Source: NWS).
| Station | Average Temperature (˚F) | Departure from Normal (˚F) | Total Rainfall (in.) | Departure from Normal (in.) |
| Gainesville | 58.4 | 0.0 | 2.45 | -0.22 |
| Sarasota | 63.4 | -1.4 | 3.26 | -1.34 |
| Naples | 64.9 | -0.3 | 2.90 | +0.84 |
| Fort Myers | 65.6 | -1.7 | 2.61 | +0.83 |
| West Palm Beach | 67.5 | -0.9 | 3.05 | +0.42 |