
Prepared by Florida Climate Center
The Florida State University
Tallahassee, FL

Summary:
- Average monthly temperatures in January were near normal for the month.
- Monthly precipitation totals in January were generally above normal, but below normal in parts of central and southeastern Florida.
- With the recent wet and stormy weather so far this season, drought continued to improve in Florida; an area of moderate drought remains along the west-central coast.
- El Niño is expected to persist for the next several months, with a 73% chance of transitioning to ENSO-neutral conditions during April-June 2024. Chances of a historically strong event are just over 50% this winter.
Average monthly temperatures in January were near normal. Average temperature departures from normal ranged from -1.9 ̊F in Pensacola to +2.2 ̊F in Miami for the month (see Table 1 and Appendix 1 for select cities). A hard freeze affected the state in the middle of the month, with minimum temperatures below freezing for three consecutive nights across North Florida and the Panhandle. Crestview reached a low of 18 ̊F on the 17th, which was 20 ̊F below normal but did not set a new record minimum temperature. Temperatures rebounded, however, with well above normal temperatures toward the end of the month. The coolest part of the state for the month was the western Panhandle, while the warmest are of the state was southeastern Florida. Select daily high maximum temperature records tied or broken during the month are provided in Appendix 2.
Table 1. January average temperatures and departures from normal ( ̊F) for selected cities.
| Station | Mean Temperature | Departure from Normal |
| Pensacola | 51.3 | -1.9 |
| Tallahassee | 53.1 | +0.9 |
| Jacksonville | 54.8 | +0.6 |
| Orlando | 62.2 | +1.6 |
| Tampa | 61.7 | -0.3 |
| Miami | 70.8 | +2.2 |
| Key West | 71.4 | +0.8 |
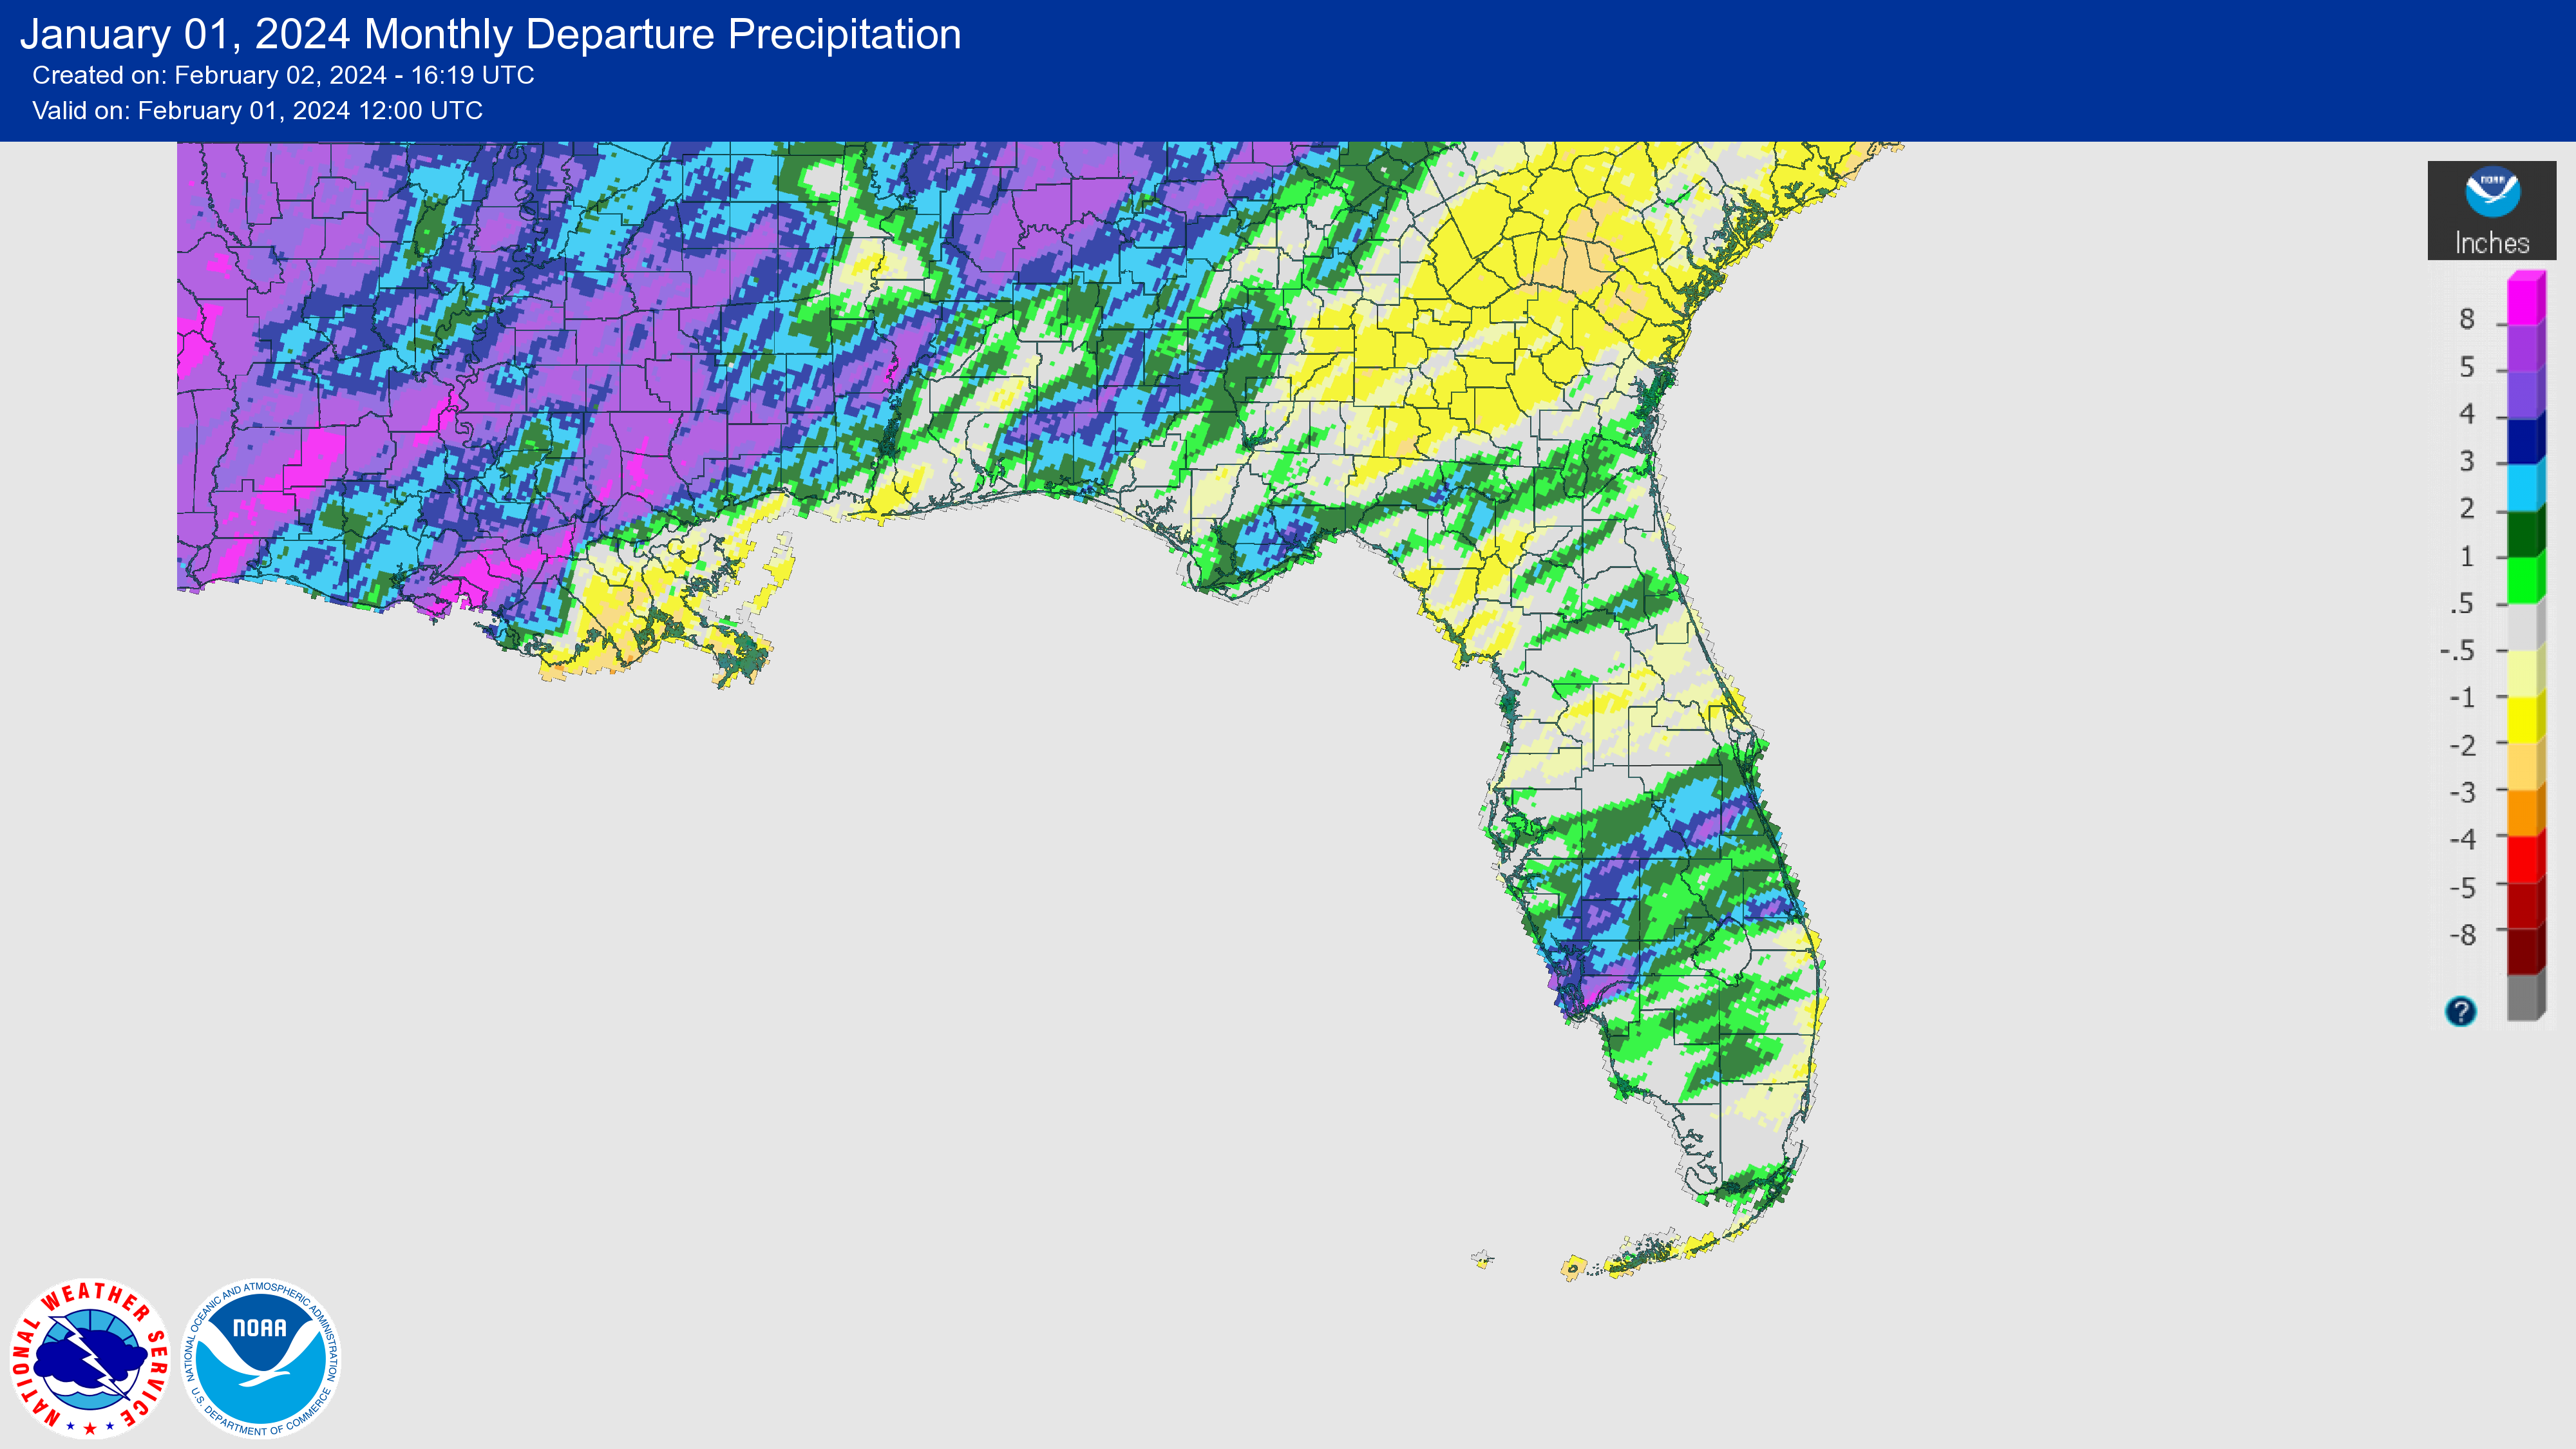
Monthly rainfall totals in January were generally above normal, but below normal in parts of central and southeast Florida. The monthly precipitation departures from normal ranged from -0.94 inches in Miami to +2.43 inches in Fort Myers (see Table 2 and Appendix 1 for select locations). Rain fell in areas that needed it. Heavy rain in south Florida led to drought improvement along west-central coastal areas that have been affected by long-term drought. Naples had its 6th-wettest January on record with a total of 2.21 inches of rain for the month. Fort Myers had its 7th-wettest January on record with monthly precipitation totaling 4.86 inches. Drought was removed in the Panhandle, which had between 5 and 7 inches of rain for the month.
Table 2. January precipitation totals and departures from normal (inches) for selected cities.
| Station | Total Rainfall | Departure from Normal |
| Pensacola | 6.29 | +1.26 |
| Tallahassee | 5.35 | +0.94 |
| Jacksonville | 4.02 | +0.74 |
| Orlando | 1.59 | -0.89 |
| Tampa | 3.12 | +0.47 |
| Miami | 0.89 | -0.94 |
| Key West | 1.83 | 0.00 |
Figure 1. A graphical depiction of the monthly rainfall departure from normal (inches) for January (courtesy of NOAA, NWS).
El Niño Advisory.
El Niño conditions, the warm phase of the El Niño Southern Oscillation climate pattern in the tropical equatorial Pacific Ocean, are expected to continue for the next several months. ENSO-neutral conditions are favored during April-June 2024 (now up to a 73% chance). Above-average sea surface temperature anomalies across the equatorial Pacific Ocean have been indicative of a strong El Niño. The largest anomalies have been observed in the central and east-central Pacific, with the latest weekly values at +1.4°C in Niño-4, +1.9°C in Niño-3.4, and +2.0° C in Niño-3 regions. There remains a just over 50% chance of reaching “historically strong” levels this winter.
Hazardous Weather Events in January.
According to the Local Storm Reports issued by the local National Weather Service offices serving Florida, there were 311 individual local reports of hazardous weather events recorded across the state during the month of January (see Table 4 for a breakdown by event type). A severe weather outbreak occurred across the Panhandle and central Florida on January 9th. The storm system moved across the state and led to an outbreak of approximately 14 tornadoes reported in southern GA, AL and in FL, along with damaging straight-line winds. The most powerful tornado, an EF3, was confirmed in Bay County in Lower Grand Lagoon which then moved into Panama City, leaving severe damage along its path. Several EF2 and EF1 tornadoes were reported elsewhere in the Panhandle. An EF1 was reported in northern Hillsborough County and an EF0 in Pinellas County associated with a squall line. In all, there were 9 injuries and 1 fatality associated with the storms.
Table 3. Breakdown of storm reports submitted in Florida during the month of January (compiled from Iowa State University/Iowa Environmental Mesonet).
| Report Type | Number of Reports |
| Heavy Rain | 1 |
| Flood | 2 |
| Flash Flood | 2 |
| Coastal Flood | 6 |
| Hail | 7 |
| Non-Thunderstorm Wind Gust | 34 |
| Non-Thunderstorm Wind Damage | 13 |
| Tornado/Waterspout/Funnel Cloud | 26/3/3 |
| Thunderstorm Wind Damage | 144 |
| Thunderstorm Wind Gust | 68 |
| Lightning | 1 |
| Rip Currents | 1 |
Daily Record Events in January.
Table 4. Summary of daily records broken or set in Florida in January (source: NCEI Daily Weather Records).
| Category | Number of Records |
| Highest daily max. temp. | 30 |
| Highest daily min. temp. | 58 |
| Lowest daily max. temp. | 1 |
| Lowest daily min. temp. | 1 |
| Highest daily precipitation | 31 |
| Total | 121 |
Drought-Related Impacts.
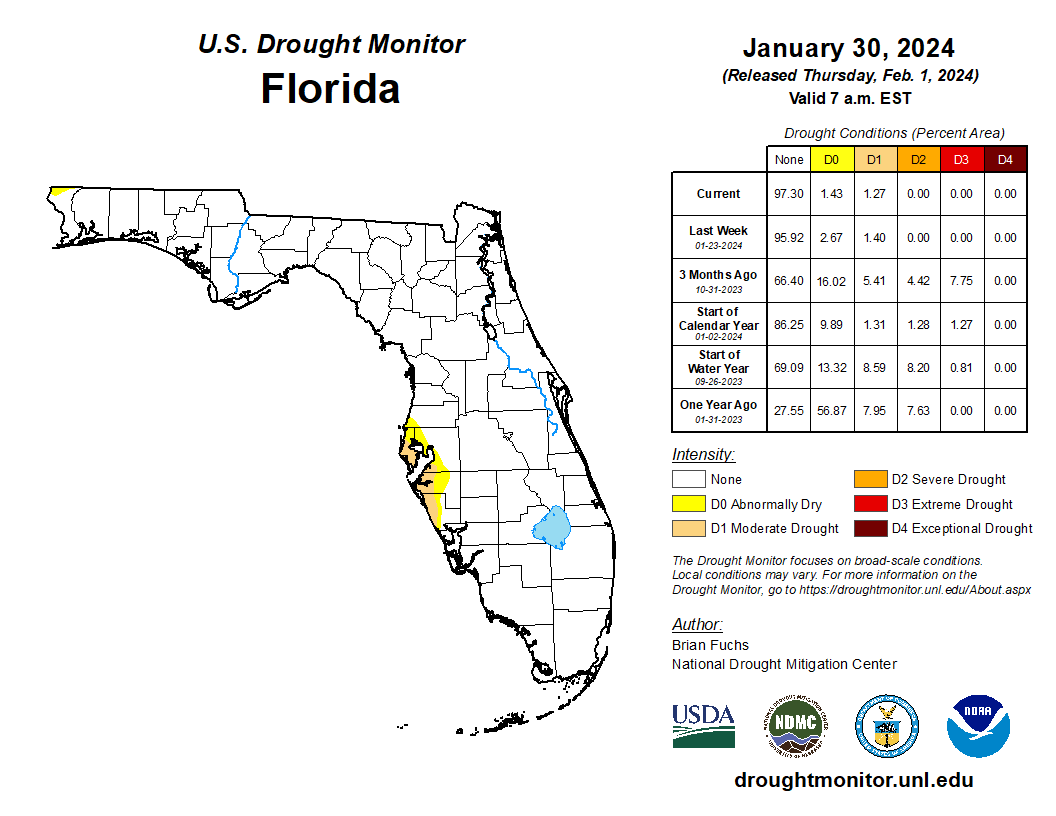
Stormy, wet conditions in Florida have led to improved drought conditions across west-central Florida and the western Panhandle. By mid-January, approximately 1.4% of the state was in moderate drought (D1) and 2.7% was abnormally dry (D0), according to the U.S. Drought Monitor. By the end of the month, slight improvement had occurred with 1.3% of the state in moderate drought (D1) and 1.4% abnormally dry (D0) (see Figure 2 below). Drought removal is likely during February-April.
As of January 31, the Lake Okeechobee water level was 16.29 ft. above sea level (Feet-NGVD29), which is above average for this time of year. At the first of the month, the water level was 15.98 ft. above sea level.
Figure 2. A graphical depiction of the latest drought conditions in Florida according to the U.S. Drought Monitor (courtesy of the National Drought Mitigation Center, University of Nebraska-Lincoln).
Agriculture-Related Impacts.
In January, a hard freeze was experienced during the middle of the month in many northern counties but no significant impacts to crops were reported. Drought improved due to moderate to heavy rainfall observed across much of the state during the month. Soil moisture increased as a result. Pasture conditions were mostly fair to good, though some pastures were overly saturated due to the frequent and heavy rainfall. Livestock was also mostly fair to good but supplemental hay was used when pastures were too wet or growth was limited due to cold temperatures. Some sugarcane operations were delayed due to high winds and heavy rain. Damages to citrus crops due to the hard freeze mid-month are still being assessed but were likely confined to new plantings. Among the crops that were planted and harvested in January included sugarcane, tomatoes, green beans, avocado, and tropical fruits. For more information, consult the Crop Progress State Stories, which is published by the USDA’s National Agricultural Statistics Service December through March.
Appendix 1
Additional January departures from normal data for select Florida locations (Source: NWS).
| Station | Average Temperature (˚F) | Departure from Normal (˚F) | Total Rainfall (in.) | Departure from Normal (in.) |
| Gainesville | 56.6 | +1.8 | 3.44 | +0.15 |
| Sarasota | 63.0 | +0.6 | 4.31 | +1.52 |
| Naples | 66.3 | +1.0 | 2.21 | +0.53 |
| Fort Myers | 65.5 | +0.8 | 4.86 | +2.43 |
| West Palm Beach | 68.3 | +2.0 | 2.62 | -0.85 |
Appendix 2
Select daily record high maximum temperatures (°F) broken or tied during January (compiled from NOAA).
| Location | Date | Record | Broken/Tied | Last |
| Lakeland | 9 | 91 | Broken | 87 in 2013 |
| Miami | 12 | 87 | Broken | 84 in 2018 |
| West Palm Beach | 12 | 87 | Broken | 83 in 2020 |
| Fort Lauderdale | 13 | 86 | Broken | 83 in 2020 |
| Homestead | 13 | 86 | Broken | 83 in 2020 |
| Perrine | 13 | 85 | Broken | 83 in 1994 |
| Miami | 13 | 86 | Broken | 84 in 1993 |
| Key West | 15 | 84 | Tied | 84 in 2020 |
| Hialeah | 16 | 85 | Tied | 85 in 1997 |
| Homestead | 16 | 84 | Broken | 83 in 1991 |
| West Palm Beach | 16 | 85 | Broken | 84 in 1954 |
| Fort Lauderdale | 17 | 84 | Broken | 82 in 2020 |
| Perrine | 17 | 84 | Broken | 83 in 1991 |
| Tallahassee | 24 | 80 | Broken | 78 in 1974 |
| Tampa | 25 | 86 | Broken | 84 in 2012 |
| Gainesville | 25 | 83 | Broken | 82 in 2023 |
| Clermont | 27 | 86 | Broken | 85 in 1950 |
| Hastings | 27 | 82 | Broken | 81 in 2017 |
| Plant City | 27 | 88 | Broken | 86 in 1962 |
| Tampa | 27 | 85 | Broken | 82 in 2009 |
| Orlando | 27 | 85 | Broken | 84 in 1962 |
| Gainesville | 27 | 84 | Broken | 82 in 1962 |
| Lakeland | 27 | 85 | Broken | 84 in 1962 |
| Clermont | 28 | 87 | Broken | 84 in 2021 |
| Hialeah | 28 | 86 | Broken | 85 in 1963 |
| Fort Lauderdale | 29 | 85 | Broken | 82 in 2012 |