
Prepared by Florida Climate Center
The Florida State University
Tallahassee, FL

Key Points:
- Average monthly temperatures in November were above normal.
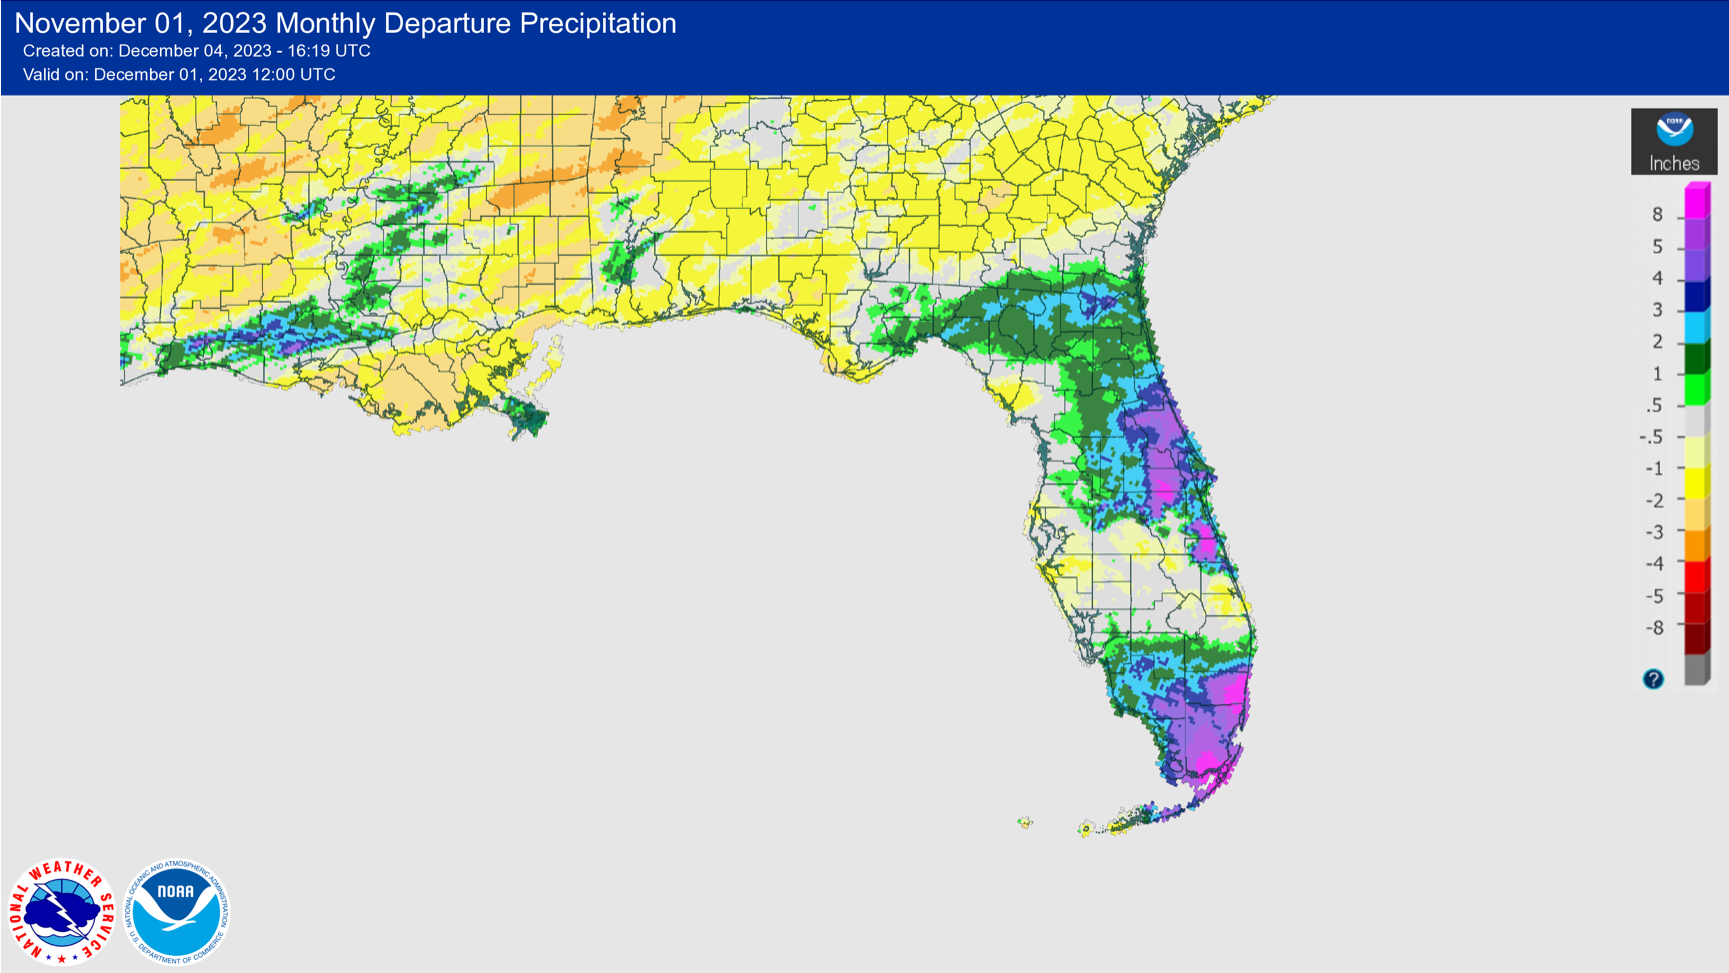
- Monthly precipitation totals in November were below normal in the western Panhandle and west central Florida where rainfall was most needed; eastern and southern areas received above normal precipitation for the month.
- With a shift to a wetter pattern, drought improvement or removal is expected over the coming weeks.
- El Niño is expected to persist for the next several months, with a 62% chance of continuing in spring (April-June 2024); chances of a strong event are greater than 55%, and there is about a 1-in-3 chance for a “historically strong” event for the November-January season.
Average monthly temperatures in November were near to above average. Average temperature departures from normal ranged from -0.7 ̊F in Jacksonville to 3.0 ̊F Miami for the month (see Table 1 and Appendix 1 for select cities). Miami experienced its 4th-warmest November on record. Tallahassee reached a low of 27 ̊ F and 28 ̊F on the 29th and 30th, respectively, at the airport, which was between 10 ̊F to 14 ̊F degrees below normal. The Jacksonville airport also reached a freezing temperature of 32 ̊ F on the 30th. The probability of the first freeze of the season happening at this time of year in North Florida is 50% according to climatology. Select daily high maximum temperature records tied or broken during the month are provided in Appendix 2.
Table 1. November average temperatures and departures from normal ( ̊F) for selected cities.
| Station | Mean Temperature | Departure from Normal |
| Pensacola | 61.7 | +0.3 |
| Tallahassee | 61.4 | +1.2 |
| Jacksonville | 61.6 | -0.7 |
| Orlando | 70.0 | +1.8 |
| Tampa | 70.4 | +0.6 |
| Miami | 77.8 | +3.0 |
| Key West | 78.1 | +1.5 |
Monthly rainfall totals in November were below normal in the western Panhandle and west central Florida and above average elsewhere. The monthly precipitation departures from normal ranged from -1.95 inches in Jacksonville to +5.83 inches in Miami (see Table 2 and Appendix 1 for select locations). Naples saw its 2nd-wettest November on record (based on a 22-year period), with 3.70 inches of rain. Fort Lauderdale collected 11.23 inches of rainfall in November, ranking as the wettest November on record there. However, coastal southwest Florida continues to see its driest year-to-date on record, including at the Naples, Sarasota, and Venice stations. In addition, many locations across north Florida went 30 consecutive days without measurable rainfall between mid-October and mid-November.
Table 2. November precipitation totals and departures from normal (inches) for selected cities.
| Station | Total Rainfall | Departure from Normal |
| Pensacola | 4.12 | -0.30 |
| Tallahassee | 3.34 | +0.24 |
| Jacksonville | 3.95 | -1.95 |
| Orlando | 5.21 | +3.42 |
| Tampa | 1.85 | +0.45 |
| Miami | 9.36 | +5.83 |
| Key West | 1.56 | -0.49 |
Figure 1. A graphical depiction of the monthly rainfall departure from normal (inches) for November (courtesy of NOAA, NWS).
El Niño Advisory.
El Niño conditions, the warm phase of the El Niño Southern Oscillation climate pattern in the tropical equatorial Pacific Ocean, continue to strengthen. El Niño is likely to persist through the Northern Hemisphere winter and into spring, with a 62% chance during April-June 2024. Above-average sea surface temperature anomalies across the equatorial Pacific Ocean have been indicative of a strong El Niño. As a result, there is a greater than 55% chance of at least a strong El Niño event (≥ 1.5°C in Niño-3.4 for a seasonal average). There is a 35% chance that this El Niño could become “historically strong” (≥ 2.0°C) for the November-January season.
Hazardous Weather Events in November.
According to the Local Storm Reports issued by the local National Weather Service offices serving Florida, there were 122 individual local reports of hazardous weather events recorded across the state during the month of November (see Table 4 for a breakdown by event type).
Table 3. Breakdown of storm reports submitted in Florida during the month of November (compiled from Iowa State University/Iowa Environmental Mesonet).
| Report Type | Number of Reports |
| Heavy Rain | 31 |
| Flood | 2 |
| Flash Flood | 6 |
| Coastal Flood | 1 |
| Hail | 0 |
| Non-Thunderstorm Wind Gust | 52 |
| Non-Thunderstorm Wind Damage | 6 |
| Tornado/Waterspout/Funnel Cloud | 0/2/0 |
| Thunderstorm Wind Damage | 0 |
| Thunderstorm Wind Gust | 22 |
Daily Record Events in November.
Table 4. Summary of daily records broken or set in Florida in November (source: NCEI Daily Weather Records).
| Category | Number of Records |
| Highest daily max. temp. | 22 |
| Highest daily min. temp. | 8 |
| Lowest daily max. temp. | 6 |
| Lowest daily min. temp. | 4 |
| Highest daily precipitation | 35 |
| Total | 75 |
Weather/Climate Highlight of the Month:
2023 is on pace to become the hottest year in recorded history globally, according to the World Meteorological Organization. In Florida, many locations are also very likely to see their hottest year on record based on year-to-date average mean temperatures through November 30, including Pensacola, Tallahassee, Fort Myers, Miami, and Key West. The departures from normal for the 11-month period are running close to 3°F above normal.
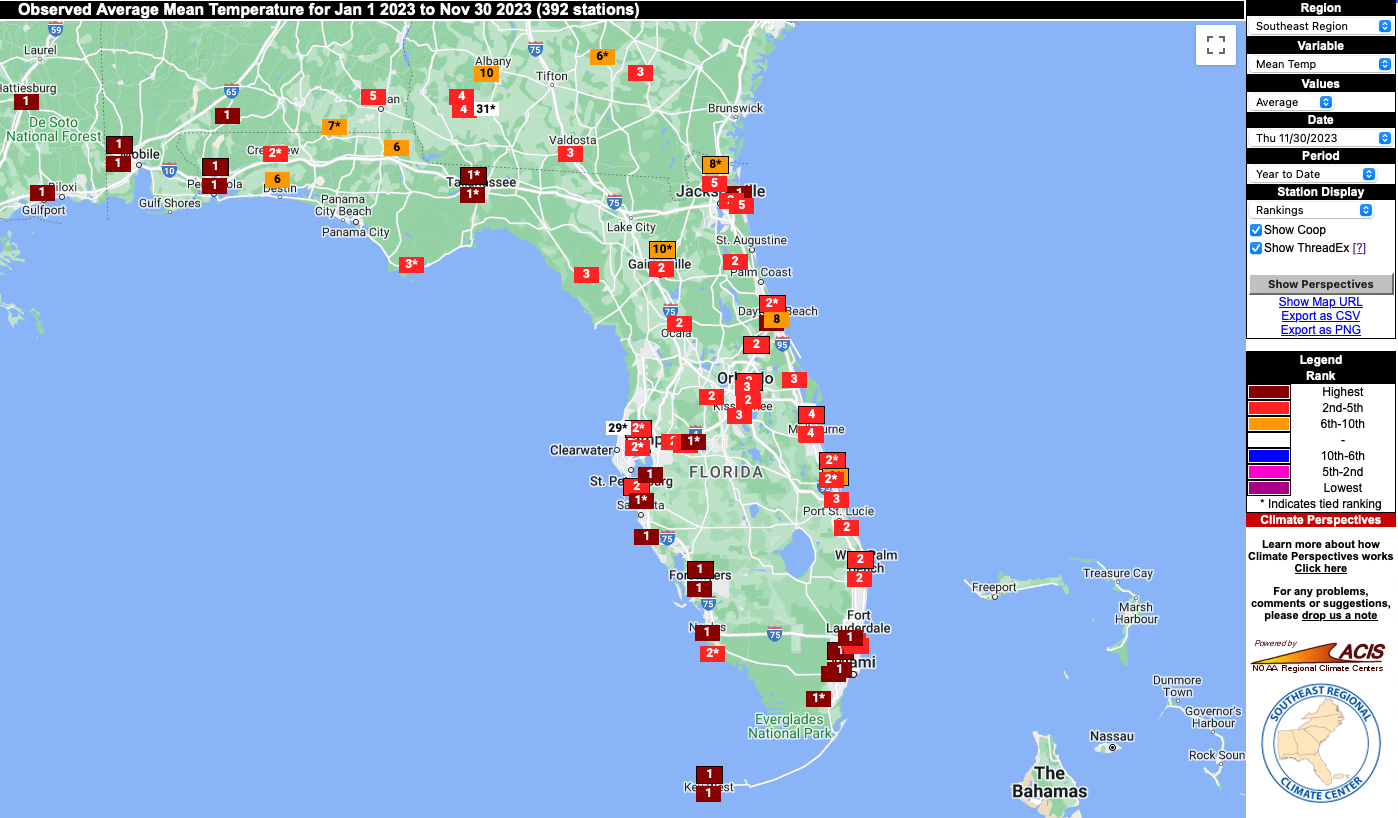
Year to date temperature rankings through November 30, 2023, based on average mean temperatures (Source: Southeast Regional Climate Center's Climate Perspectives Tool).
Drought-Related Impacts.
Drought conditions persisted across the western Panhandle through much of the month, where flash drought had developed. Many locations across northern Florida went one month, or close to, without measurable rainfall. The lack of rain caused problems for forage and livestock producers and small grain farmers. Declines in the pecan harvest which is down about 30% this year can be attributed to these recent dry conditions, as well as to Hurricane Idalia. Wet fields elsewhere in the state are starting to cause issues with citrus crops.
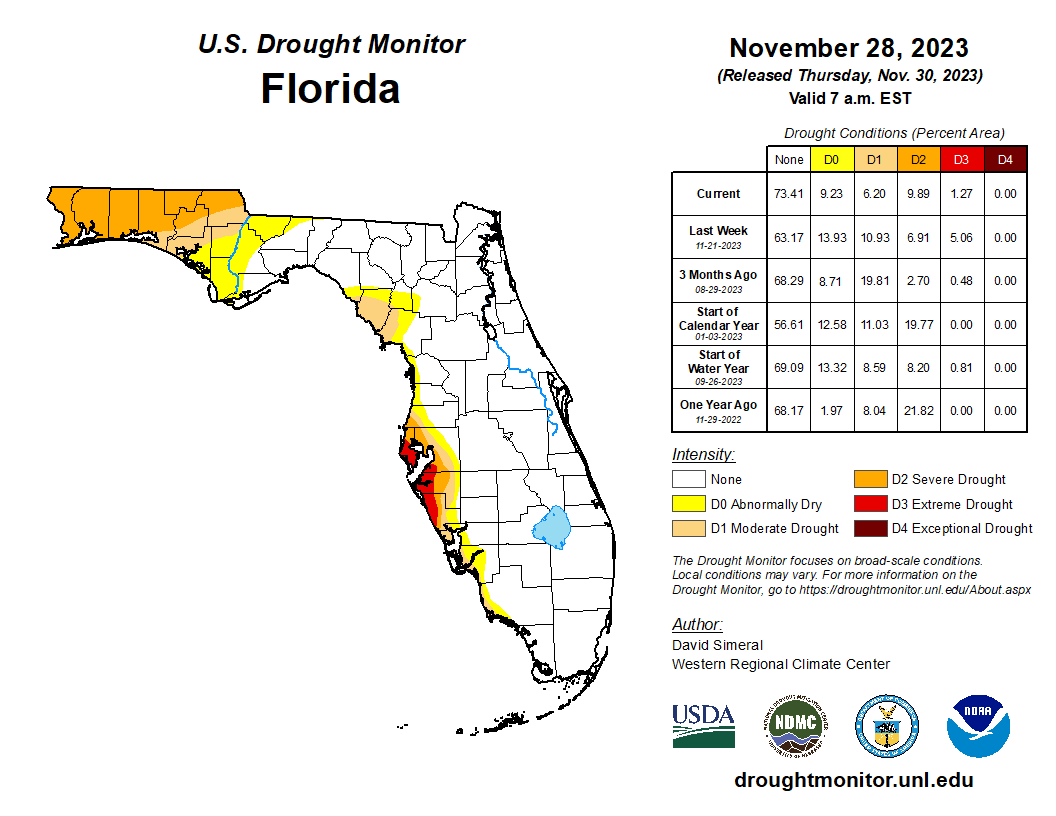
Throughout November, drought persisted but improved slightly across the Panhandle and west coast of Florida. By the 14th, roughly 8% of the state was in extreme drought (D3), 4% was in severe drought (D2), 9% was experiencing moderate drought (D1), and 30% was abnormally dry (D0), according to the U.S. Drought Monitor. By the end of the month, only 1% of the state was in extreme drought (D3), 10% was in severe drought (D2), 6% was in moderate drought (D1), and 9% remained abnormally dry (D0) (see Figure 2 below). Drought improvement or removal is expected everywhere during December.
As of November 30, the Lake Okeechobee water level was 15.98 ft. above sea level (Feet-NGVD29), which is above average for this time of year. At the first of the month, the water level was 16.16 ft. above sea level.
Figure 2. A graphical depiction of the latest drought conditions in Florida according to the U.S. Drought Monitor (courtesy of the National Drought Mitigation Center, University of Nebraska-Lincoln).
Agriculture-Related Impacts.
In mid-November, topsoil moisture conditions were adequate in 51% of the state, short in 31%, and very short in 18% of the state, while 0% of the state was experiencing surplus topsoil moisture conditions. By November 26, conditions improved with topsoil moisture conditions adequate in 73% of the state, short in 15%, and very short in only 1% of the state; 11% of the state was in surplus. For more information, consult the Crop Progress and Conditions Report, which is published by the USDA’s National Agricultural Statistics Service.
Appendix 1
Additional November departures from normal data for select Florida locations (Source: NWS).
| Station | Average Temperature (˚F) | Departure from Normal (˚F) | Total Rainfall (in.) | Departure from Normal (in.) |
| Gainesville | 63.7 | +1.0 | 2.39 | +0.60 |
| Sarasota | 71.1 | +1.0 | 0.67 | -1.14 |
| Naples | 73.4 | +1.0 | 3.70 | +2.31 |
| Fort Myers | 73.0 | +1.5 | 2.97 | +1.19 |
| West Palm Beach | 75.2 | +2.2 | 4.46 | +0.84 |
Appendix 2
Select daily record high maximum temperatures (°F) broken or tied during November (compiled from NOAA).
| Location | Date | Record | Broken/Tied | Last |
| Homestead | 1 | 90 | Tied | 90 in 2020 |
| Perrine | 1 | 90 | Tied | 90 in 2019 |
| Plant City | 10 | 91 | Broken | 90 in 2018 |
| Tampa | 10 | 89 | Broken | 87 in 2002 |
| Orlando | 10 | 89 | Broken | 87 in 2015 |
| Gainesville | 10 | 87 | Broken | 84 in 2020 |
| Miami | 10 | 89 | Tied | 89 in 2015 |
| Lakeland | 10 | 90 | Broken | 89 in 1986 |
| Jacksonville | 10 | 86 | Broken | 84 in 2002 |
| Tallahassee | 10 | 87 | Tied | 87 in 2020 |
| Bradenton | 11 | 89 | Broken | 87 in 1994 |
| Clermont | 11 | 90 | Broken | 88 in 2015 |
| Deland | 11 | 87 | Tied | 87 in 2002 |
| Plant City | 11 | 94 | Broken | 90 in 1972 |
| Wauchula | 11 | 91 | Broken | 89 in 1972 |
| Orlando | 11 | 89 | Broken | 87 in 2002 |
| Gainesville | 11 | 89 | Broken | 85 in 2002 |
| Cross City | 11 | 88 | Broken | 86 in 2002 |
| Fort Myers | 11 | 91 | Tied | 91 in 1979 |
| Miami | 11 | 89 | Tied | 89 in 2002 |
| Tampa | 11 | 88 | Tied | 88 in 1986 |
| Clermont | 12 | 89 | Broken | 88 in 2002 |
| Plant City | 12 | 92 | Broken | 90 in 2018 |
| Wauchula | 12 | 90 | Broken | 89 in 1986 |
| Vero Beach | 26 | 86 | Broken | 85 in 2018 |