
Prepared by Florida Climate Center
The Florida State University
Tallahassee, FL

Key Points:
- Average monthly temperatures in September were above normal but more tempered compared to the last few months.
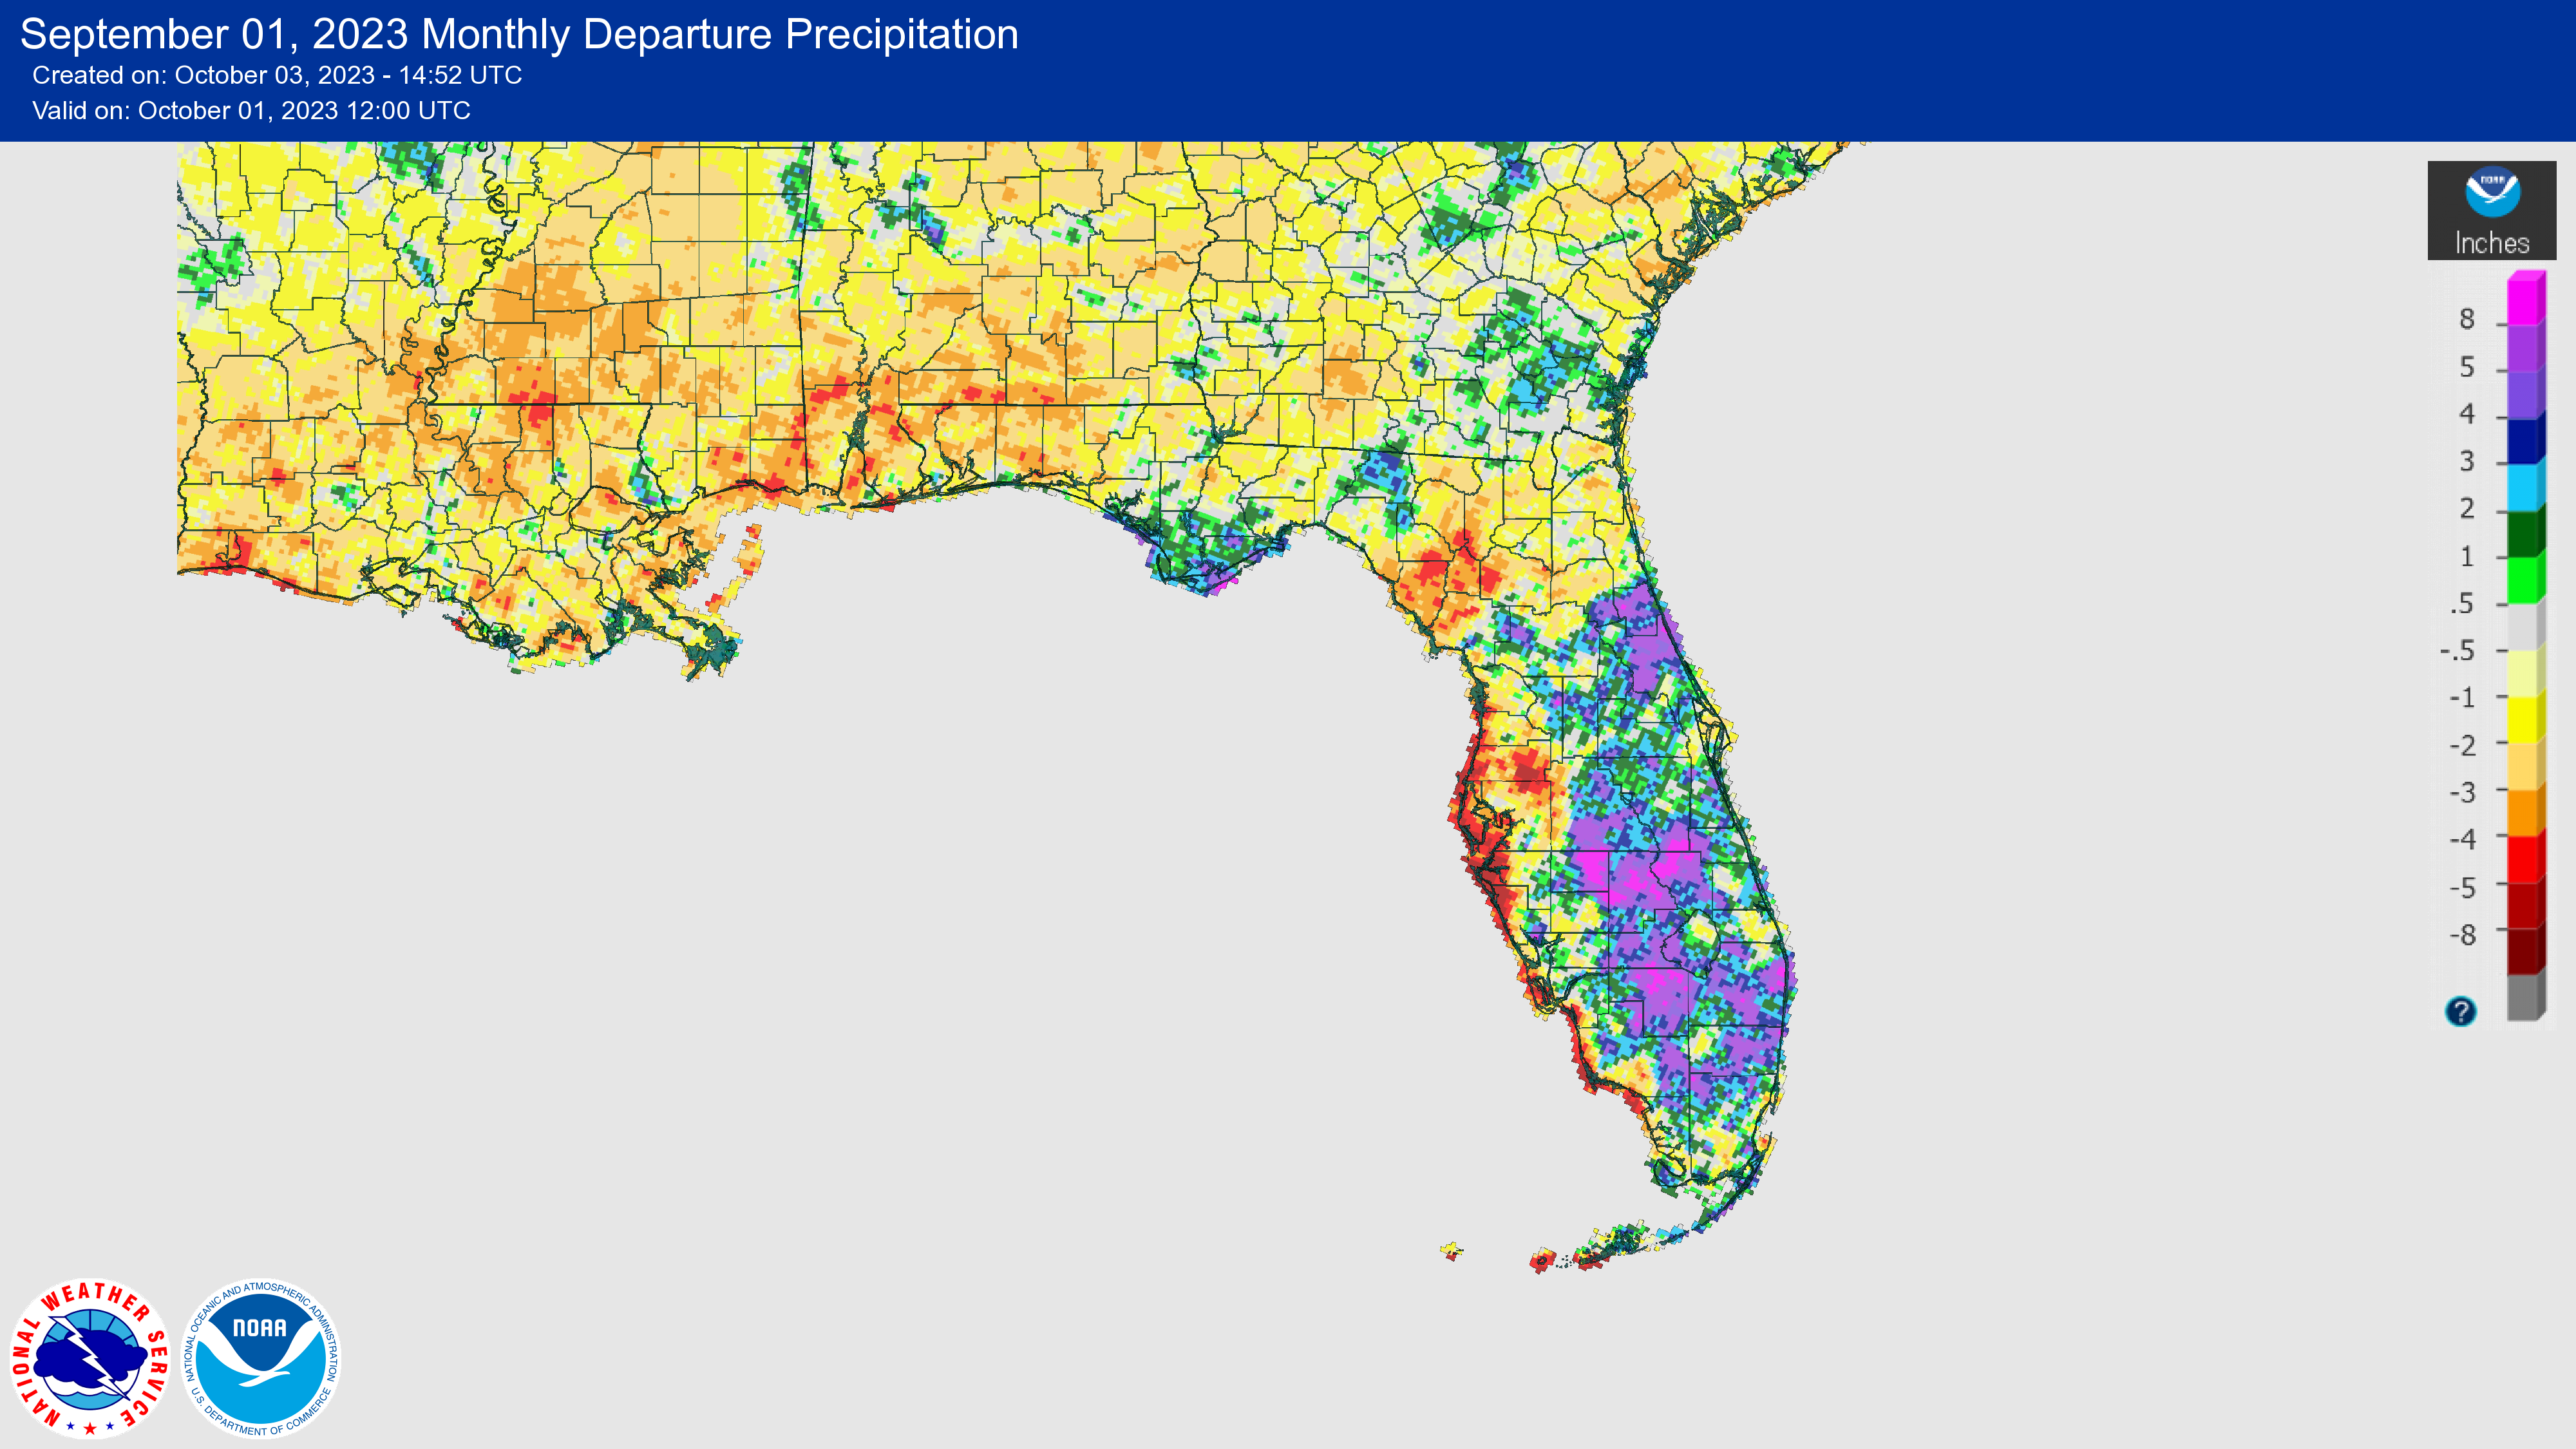
- Monthly precipitation totals in September were above normal in the Peninsula and below normal across western Florida and the Panhandle.
- Extreme drought remained confined to coastal west-central Florida throughout the month, and severe drought emerged in the western Panhandle by month’s end.
- An El Niño Advisory continues and there is increased confidence that it will persist into the winter (greater than 95% chance) and become a strong event (greater than 70% chance).
Average monthly temperatures in September were above average but more tempered compared to the summer months. Average temperature departures from normal ranged from -0.5 ̊F in Jacksonville to +2.3 ̊F in Naples for the month (see Table 1 and Appendix 1 for select cities). West coastal and southern locations experienced one of their top 5 warmest Septembers on record, including Fort Myers (2nd-warmest), Tampa (3rd-warmest), Lakeland (3rd-warmest), Miami (3rd-warmest), Key West (3rd-warmest), and Sarasota (4th-warmest). Pensacola had its 10th-warmest September on record. The record-breaking hot summer ended with Key West, Miami, Pensacola, and Sarasota all recording their hottest summer on record. Select daily high maximum temperature records tied or broken during the month of September are provided in Appendix 2.
Table 1. September average temperatures and departures from normal ( ̊F) for selected cities.
| Station | Mean Temperature | Departure from Normal |
| Pensacola | 81.2 | +1.2 |
| Tallahassee | 79.7 | +0.6 |
| Jacksonville | 78.3 | -0.5 |
| Orlando | 82.3 | +1.3 |
| Tampa | 83.8 | +1.1 |
| Miami | 84.7 | +1.7 |
| Key West | 85.4 | +1.3 |
Monthly rainfall totals in September were above normal in the Peninsula and below normal across western Florida and the Panhandle. The monthly precipitation departures from normal ranged from -5.62 inches in Naples to +5.18 inches in West Palm Beach (see Table 2 and Appendix 1 for select locations). Most of the rainfall during the month occurred in the central and eastern Peninsula. While Idalia’s rainfall led to a contraction of drought in southwest Florida, monthly precipitation totals along the west Florida coast were below normal and not enough to bring coastal areas out of drought. Venice, Sarasota, and Tarpon Springs continue to experience their driest year on record, to date.
Table 2. September precipitation totals and departures from normal (inches) for selected cities.
| Station | Total Rainfall | Departure from Normal |
| Pensacola | 3.53 | -3.08 |
| Tallahassee | 5.29 | +0.38 |
| Jacksonville | 9.00 | +1.44 |
| Orlando | 7.28 | +0.91 |
| Tampa | 5.97 | -0.12 |
| Miami | 12.76 | +2.54 |
| Key West | 8.77 | +1.53 |
Figure 1. A graphical depiction of the monthly rainfall departure from normal (inches) for September (courtesy of NOAA, NWS).
El Niño Advisory.
El Niño, the warm phase of the El Niño Southern Oscillation climate pattern in the tropical equatorial Pacific Ocean, continued in August. There is strong confidence that El Niño will persist through the Northern Hemisphere winter 2023-24, with greater than 95% chance through January – March 2024. Forecasters are more confident in the probability of a strong El Niño event (≥1.5°C for the November-January seasonal average in Niño-3.4), above a 70% chance. While El Niño events favor wetter and cooler than normal winters in Florida, the odds of a cooler-than-normal winter is increasingly less likely with the warming temperature trends seen over the last decade in the state.
Hazardous Weather Events in September.
According to the Local Storm Reports issued by the local National Weather Service offices serving Florida, there were 339 individual local reports of hazardous weather events recorded across the state during the month of September (see Table 4 for a breakdown by event type). Two fatalities occurred during the month, one from a lightning strike and another due to rip currents. Several injuries were also reported from rip currents. Severe thunderstorms caused extensive damages and many downed trees throughout the month. Straight-line wind gusts were estimated at 85-90 mph in Wakulla County on the 8th.
Table 3. Breakdown of storm reports submitted in Florida during the month of September (compiled from Iowa State University/Iowa Environmental Mesonet).
| Report Type | Number of Reports |
| Heavy Rain | 49 |
| Flood | 14 |
| Flash Flood | 4 |
| Coastal Flood | 15 |
| Hail | 29 |
| Lightning | 2 |
| Non-Thunderstorm Wind Gust | 4 |
| Non-Thunderstorm Wind Damage | 0 |
| Tornado/Waterspout/Funnel Cloud | 3/24/11 |
| Thunderstorm Wind Damage | 64 |
| Thunderstorm Wind Gust | 117 |
| Rip Currents | 3 |
Daily Record Events in September.
Table 4. Summary of daily records broken or set in Florida in September (source: NCEI Daily Weather Records).
| Category | Number of Records |
| Highest daily max. temp. | 34 |
| Highest daily min. temp. | 20 |
| Lowest daily max. temp. | 1 |
| Lowest daily min. temp. | 9 |
| Highest daily precipitation | 22 |
| Total | 86 |
Weather/Climate Highlight of the Month: Idalia contributes to a record-breaking disaster year.
Hurricane Idalia’s estimated damages are in the $2-$5 billion range, contributing to a record-breaking disaster year. 2023 has had 23 billion-dollar disasters to date, which already sets a record for the highest annual number of billion-dollar disasters dating back to 1980. While total loss and damage assessments are still underway, Hurricane Idalia’s total agricultural losses in Florida alone are estimated at $80-$370 million. Idalia caused extensive damage to agricultural infrastructure and crops, with pecans, vegetables, harvestable fruit, and cotton especially hard hit in impacted areas of Florida and Georgia.
Drought-Related Impacts.
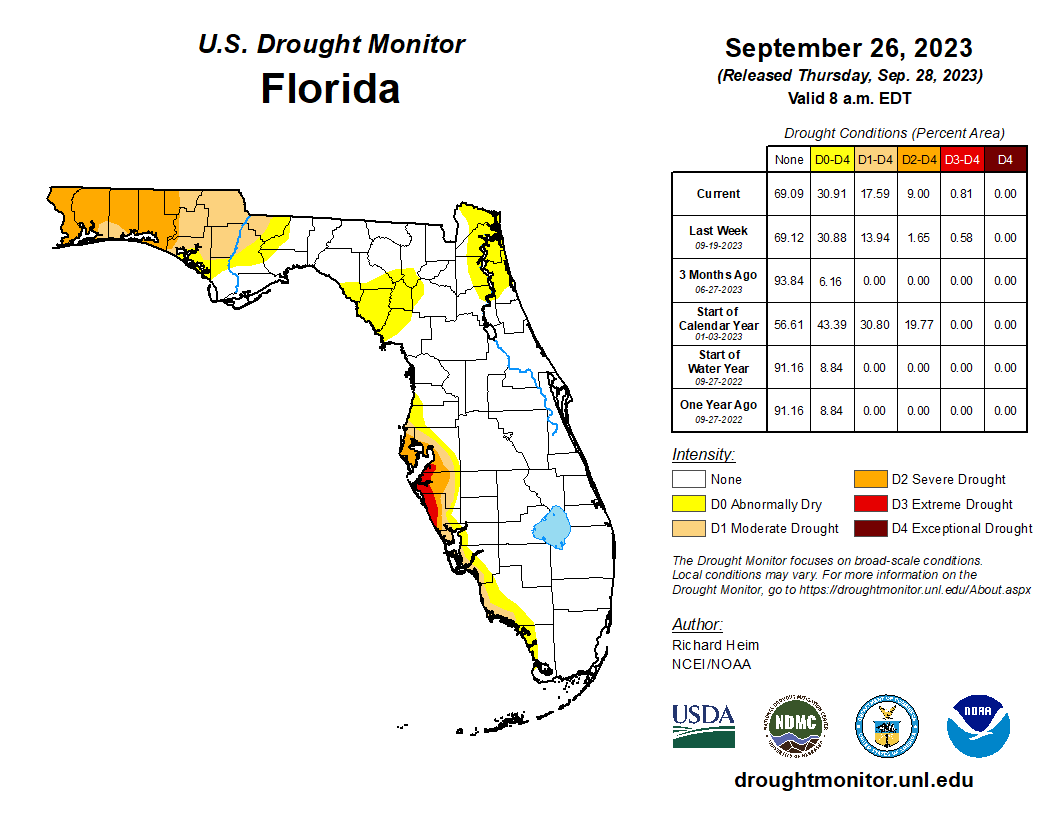
Drought continued to impact the state throughout the month. Extreme drought along the west-central coast persisted with monthly rainfall totals below normal, while moderate drought persisted in the western Panhandle. Abnormally dry conditions emerged in northeast Florida by mid-month. By the 12th, roughly 1% of the state was in extreme drought (D3), 1% was in severe drought (D2), 10% was experiencing moderate drought (D1), and 14% was abnormally dry (D0), according to the U.S. Drought Monitor. By the end of the month, about 1% of the state was in extreme drought (D3), 8% was in severe drought (D2), 9% was in moderate drought (D1), and 13% was abnormally dry (D0) (see Figure 2 below).
As of September 30, the Lake Okeechobee water level was 15.73 ft. above sea level (Feet-NGVD29), which is above average for this time of year. At the first of the month, the water level was 15.36 ft. above sea level.
Figure 2. A graphical depiction of the latest drought conditions in Florida according to the U.S. Drought Monitor (courtesy of the National Drought Mitigation Center, University of Nebraska-Lincoln).
Agriculture-Related Impacts.
In mid-September, topsoil moisture conditions were adequate in 68% of the state, short in 25%, and very short in 2% of the state, while 5% of the state was experiencing surplus topsoil moisture conditions. By September 24, topsoil moisture conditions were adequate in 60% of the state, short in 30%, and very short in 1% of the state; 9% of the state was in surplus. For more information, consult the Crop Progress and Conditions Report, which is published by the USDA’s National Agricultural Statistics Service.
Appendix 1
Additional September departures from normal data for select Florida locations (Source: NWS).
| Station | Average Temperature (˚F) | Departure from Normal (˚F) | Total Rainfall (in.) | Departure from Normal (in.) |
| Gainesville | 79.0 | +0.2 | 3.80 | -1.25 |
| Sarasota | 82.8 | +0.6 | 1.88 | -4.12 |
| Naples | 84.7 | +2.3 | 2.08 | -5.62 |
| Fort Myers | 83.7 | +1.5 | 7.15 | -1.85 |
| West Palm Beach | 82.8 | +0.9 | 13.14 | +5.18 |
Appendix 2
Select daily record high maximum temperatures (°F) broken or tied during September (compiled from NOAA).
| Location | Date | Record | Broken/Tied | Last |
| Fort Lauderdale | 1 | 95 | Broken | 94 in 1998 |
| Vero Beach | 1 | 93 | Tied | 93 in 2007 |
| Ochopee | 1 | 96 | Tied | 96 in 2009 |
| Key West | 1 | 95 | Tied | 95 in 2022 |
| Homestead | 2 | 98 | Broken | 97 in 2021 |
| Tarpon Springs | 4 | 98 | Tied | 98 in 1912 |
| Crestview | 6 | 96 | Broken | 95 in 1999 |
| Tallahassee | 6 | 96 | Tied | 96 in 2010 |
| Daytona Beach | 7 | 94 | Tied | 94 in 1949 |
| Crestview | 7 | 97 | Tied | 97 in 2019 |
| Clermont | 11 | 96 | Broken | 95 in 2019 |
| Plant City | 11 | 100 | Broken | 98 in 1915 |
| Fort Myers | 11 | 96 | Tied | 96 in 1990 |
| Clermont | 12 | 98 | Broken | 96 in 2015 |
| Tampa | 12 | 96 | Broken | 95 in 2021 |
| Fort Myers | 12 | 96 | Broken | 94 in 2021 |
| Key West | 12 | 94 | Broken | 92 in 1948 |
| Miami | 12 | 94 | Broken | 93 in 2022 |
| Clermont | 13 | 95 | Tied | 95 in 2015 |
| Plant City | 13 | 100 | Broken | 97 in 2018 |
| Key West | 13 | 94 | Broken | 92 in 2011 |
| Miami | 13 | 96 | Broken | 93 in 2022 |
| Key West | 14 | 95 | Broken | 93 in 2015 |
| Homestead | 15 | 95 | Broken | 94 in 2022 |
| Key West | 15 | 94 | Broken | 93 in 2007 |
| Tampa | 16 | 95 | Broken | 94 in 1987 |
| Key West | 16 | 93 | Broken | 92 in 2011 |
| Bradenton | 17 | 95 | Tied | 95 in 1990 |
| Melbourne | 18 | 93 | Tied | 93 in 2004 |
| Key West | 18 | 93 | Broken | 92 in 1990 |
| Fort Pierce | 19 | 95 | Broken | 94 in 2020 |
| Clermont | 26 | 96 | Broken | 95 in 2020 |
| Ochopee | 29 | 96 | Broken | 95 in 2011 |
| Miami | 29 | 93 | Tied | 93 in 1980 |