
Prepared by Florida Climate Center
The Florida State University
Tallahassee, FL

Key Points:
- Average monthly temperatures in August were above normal across Florida and many new records were set.
- Monthly precipitation totals in August were near or below normal across the state.
- Extreme drought continued to affect coastal west central Florida throughout the month, and drought degradation occurred in the Panhandle due to a combination of below-normal rainfall and extreme heat.
- An El Niño Advisory continues and there is increased confidence that it will persist into the winter (greater than 95% chance). There is also increasing confidence in the probability of a strong El Niño event.
- Hurricane Idalia made landfall near Keaton Beach, Florida as a Category 3 hurricane on August 30 with maximum wind speeds of 125 mph, becoming the strongest hurricane to make landfall in the Big Bend since the Cedar Key hurricane of 1896.
Average monthly temperatures in August were above normal across the state. Average temperature departures from normal ranged from +1.9 ̊F in Key West to +5.3 ̊F in Pensacola for the month (see Table 1 and Appendix 1 for select cities). High temperatures and oppressive humidity affected much of the state again this month. Pensacola reached a maximum temperature of 105 ̊F on the 26th, which was the hottest temperature recorded in Florida during the month. New all-time record high minimum temperatures were set as well, including 88 ̊F in Key West on the 9th and 86 ̊F in Naples on the 30th. Most stations statewide recorded their hottest August on record, based on monthly average temperatures, including Pensacola, Tallahassee, Gainesville, Tampa, Daytona Beach, Sarasota, Orlando, Fort Myers, Naples, Miami, and Key West.
In addition, August 2023 was the hottest month ever recorded for several locations based on monthly average temperatures, including Tallahassee (old record was 85.5 ̊F set in July 1932), Pensacola (old record was 85.7 ̊F set in August 1951), Tampa (old record was 86.5 ̊F set in July 2023), Miami (old record was 86.5 ̊F set in July 2023), Naples at 85.3 ̊F (old record was 85.0 set in July 1942), Vero Beach at 84.3 ̊F (old record was 83.8 ̊F set in August 2020), Daytona Beach at 85.0 ̊F (old record was 84.5 ̊F set in June 1998), Orlando (old record was 85.2 ̊F set in July 2016), and Gainesville which tied its old record of 84.0 ̊F set in June 1998 and August 2011. Many stations across the state are on pace to see their warmest year on record, based on year-to-date average temperatures January – August. Select daily high maximum and minimum temperature records tied or broken during the month are provided in Appendices 2 and 3.
Table 1. August average temperatures and departures from normal ( ̊F) for selected cities.
| Station | Mean Temperature | Departure from Normal |
| Pensacola | 88.3* | +5.3 |
| Tallahassee | 86.4* | +4.0 |
| Jacksonville | 84.5 | +2.4 |
| Orlando | 85.9* | +3.3 |
| Tampa | 86.9* | +2.9 |
| Miami | 86.6* | +2.4 |
| Key West | 87.4 | +1.9 |
*Indicates a new record for hottest month ever recorded at station.
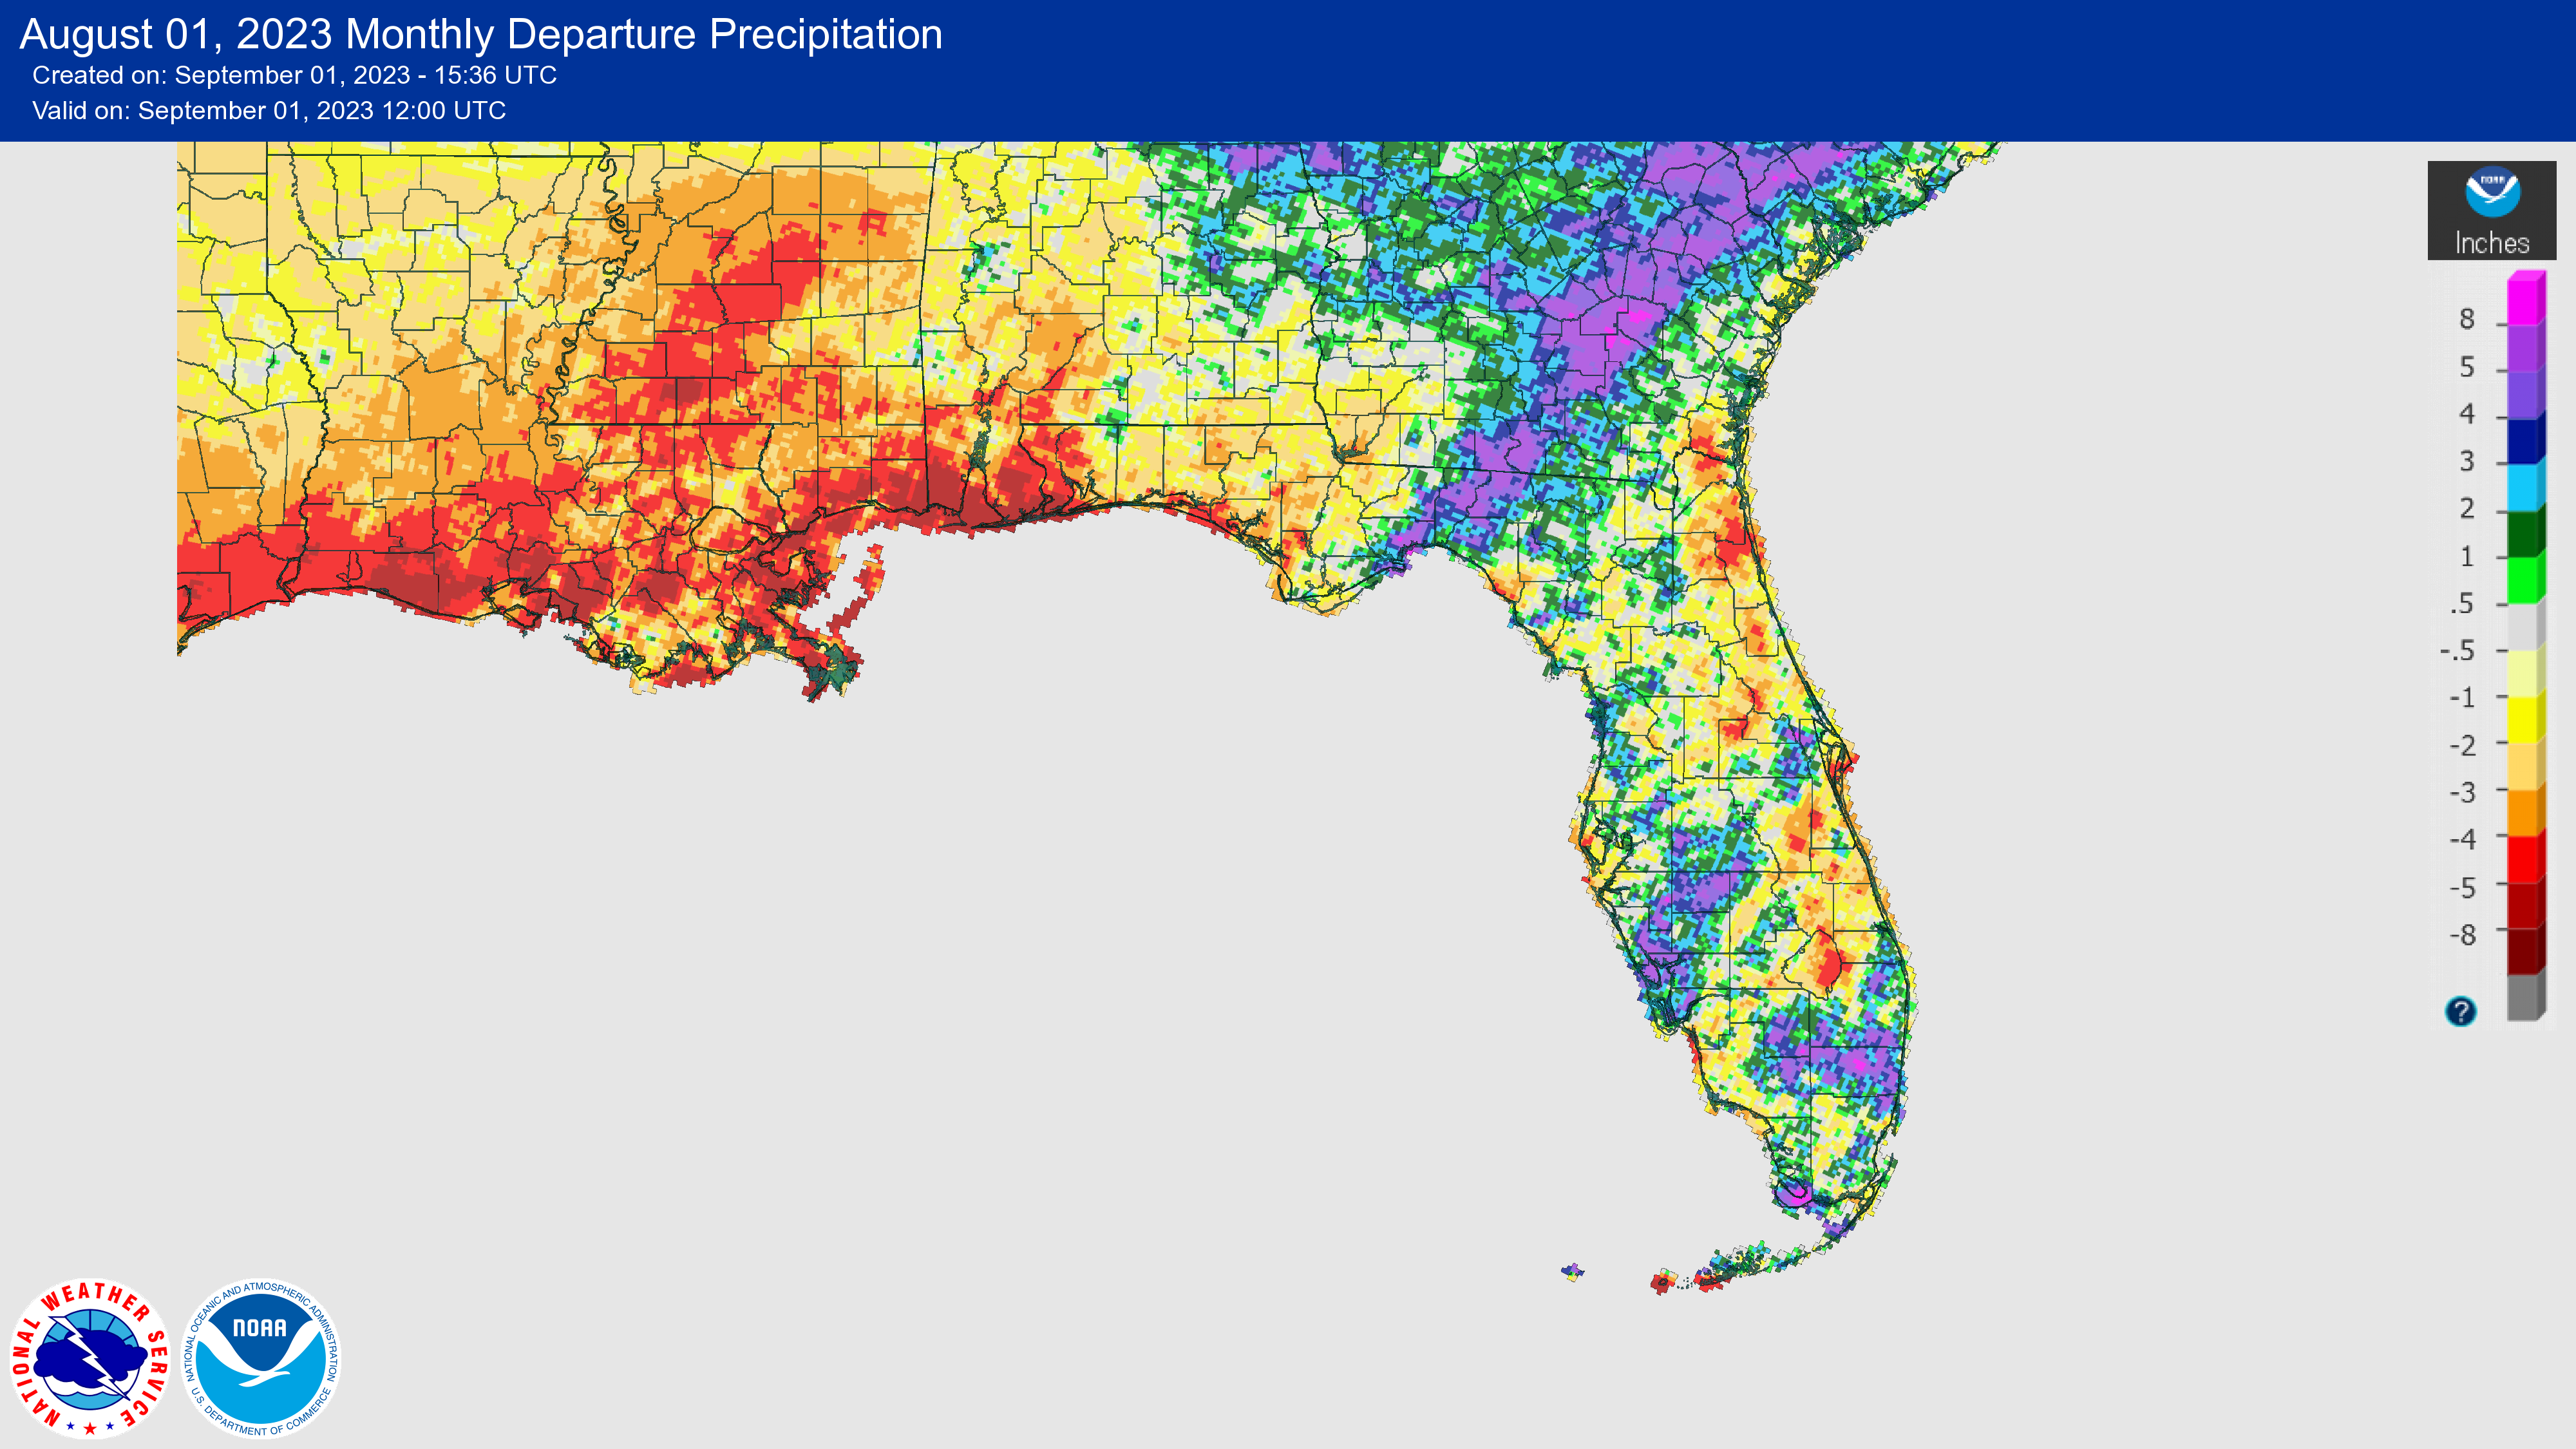
Monthly rainfall totals in August were generally near to below normal. The monthly precipitation departures from normal ranged from -4.98 inches in Pensacola to +2.71 inches in Cross City (see Table 2 and Appendix 1 for select locations). Monthly rainfall totals in the Panhandle were generally well below normal, and the monthly deficit at Pensacola of -4.98 inches ranked as their 6th-driest August on record. The Peninsula had some winners and losers with spotty rainfall throughout the month. Naples collected a mere 4.05 inches, which ranked as the 3rd-driest August on record and did little to alleviate their year-to-date rainfall deficit which now stands at -19.17 inches through August. Fort Lauderdale saw 11.49 inches of rain during the month, which ranked as their 4th-wettest August on record. West Florida and Big Bend regions recorded several inches of rain from Hurricane Idalia, with storm totals generally between 2 and 4 inches and over 6 inches in some locations.
Table 2. August precipitation totals and departures from normal (inches) for selected cities.
| Station | Total Rainfall | Departure from Normal |
| Pensacola | 2.52 | -4.98 |
| Tallahassee | 5.20 | -2.40 |
| Jacksonville | 4.98 | -1.90 |
| Orlando | 8.15 | +0.46 |
| Tampa | 9.97 | +0.94 |
| Miami | 10.25 | +0.67 |
| Key West | 6.31 | +0.94 |
Figure 1. A graphical depiction of the monthly rainfall departure from normal (inches) for August (courtesy of NOAA, NWS).
El Niño Advisory.
El Niño conditions, the warm phase of the El Niño Southern Oscillation climate pattern, in the tropical equatorial Pacific Ocean continued in August. There is strong confidence that El Niño will persist through the Northern Hemisphere winter 2023-24, with greater than 95% chance through December 2023 – February 2024. Forecasters are more confident in the probability of a strong El Niño event, with a more than 60% chance of Niño-3.4 ≥ 1.5°C for the November-January seasonal average. However, a strong El Niño event does not necessarily mean stronger impacts locally.
Hazardous Weather Events in August.
According to the Local Storm Reports issued by the local National Weather Service offices serving Florida, there were 799 individual local reports of hazardous weather events recorded across the state during the month of August (see Table 4 for a breakdown by event type). There were many reports of extreme heat during the month, with heat indices in the 110s°F and peaking above 120°F in parts of the Panhandle (Wakulla and Bay Counties). Lightning strikes resulted in 2 injuries and 1 fatality. Another fatality occurred due to rip currents. Hurricane Idalia, a category 3 hurricane at the time of landfall, caused damaging storm surge across much of the western coast and Big Bend regions of Florida, from Naples to St. George Island. Idalia caused very few injuries and no fatalities; one person was injured when a tree fell on a home in Hamilton County on the 30th. More information about the storm is below.
Table 3. Breakdown of storm reports submitted in Florida during the month of August (compiled from Iowa State University/Iowa Environmental Mesonet).
| Report Type | Number of Reports |
| Heavy Rain | 39 |
| Flood | 12 |
| Flash Flood | 6 |
| Coastal Flood | 1 |
| Hail | 3 |
| Lightning | 6 |
| Non-Thunderstorm Wind Gust | 6 |
| Non-Thunderstorm Wind Damage | 0 |
| Tornado/Waterspout/Funnel Cloud/Landspout | 2/17/7/1 |
| Thunderstorm Wind Damage | 46 |
| Thunderstorm Wind Gust | 240 |
| Extreme Heat | 78 |
| Tropical Cyclone | 325 |
| Storm Surge | 7 |
| Rip Currents | 3 |
Daily Record Events in August.
Table 4. Summary of daily records broken or set in Florida in August (source: NCEI Daily Weather Records).
| Category | Number of Records |
| Highest daily max. temp. | 156 |
| Highest daily min. temp. | 196 |
| Lowest daily max. temp. | 7 |
| Lowest daily min. temp. | 2 |
| Highest daily precipitation | 26 |
| Total | 387 |
Weather/Climate Highlight of the Month: Hurricane Idalia
Hurricane Idalia made landfall in the Big Bend region at Keaton Beach, Florida on the morning of August 30 as a major Category 3 hurricane with maximum winds of 125 mph. Idalia underwent rapid intensification in the Gulf of Mexico as it approached land, with an increase in wind speeds of 55 mph in less than 24 hours, briefly reaching Category 4 strength. Just before landfall, the storm weakened slightly but still made landfall as a major Cat-3 hurricane.
Idalia became the second major hurricane of the 2023 Atlantic hurricane season and the 10th named storm of the season, a few weeks ahead of climatology. Idalia is the strongest hurricane to make landfall in the Big Bend since the Cedar Key hurricane of 1896, which also had maximum winds of 125 mph. Idalia became the first hurricane since Hurricane Gladys in 1968 (which made landfall as a category 2 storm near Homosassa Springs) to make direct landfall in the Big Bend region. The last major hurricane to hit the Big Bend was in 1950 when Hurricane Easy brushed the coast near Cedar Key and moved south to make a second landfall in western Florida near Hernando Beach.
Idalia caused widespread impacts to Florida’s west coast and devastated coastal Big Bend communities with high winds and storm surge, including areas at and near Keaton Beach, Steinhatchee, and Cedar Key, as well as causing flooding further south near Hernando Beach, Punta Gorda, and Tarpon Springs. Inland areas like Perry and Mayo were badly hit as the storm maintained hurricane strength into southeastern Georgia before impacting the Carolinas. Reported rainfall totals in Florida associated with Idalia include 6.67 inches in Madison County (Mesonet station), 6.11 inches in Jefferson County (CoCoRaHS), and 7.66 inches in Charlotte County (CoCoRaHS). Peak wind gusts included 85 mph in Perry, 83 mph in Keaton Beach, and 85.3 mph in Mayo. Many customers in north Florida were without power after the storm and continued to be through the Labor Day weekend.
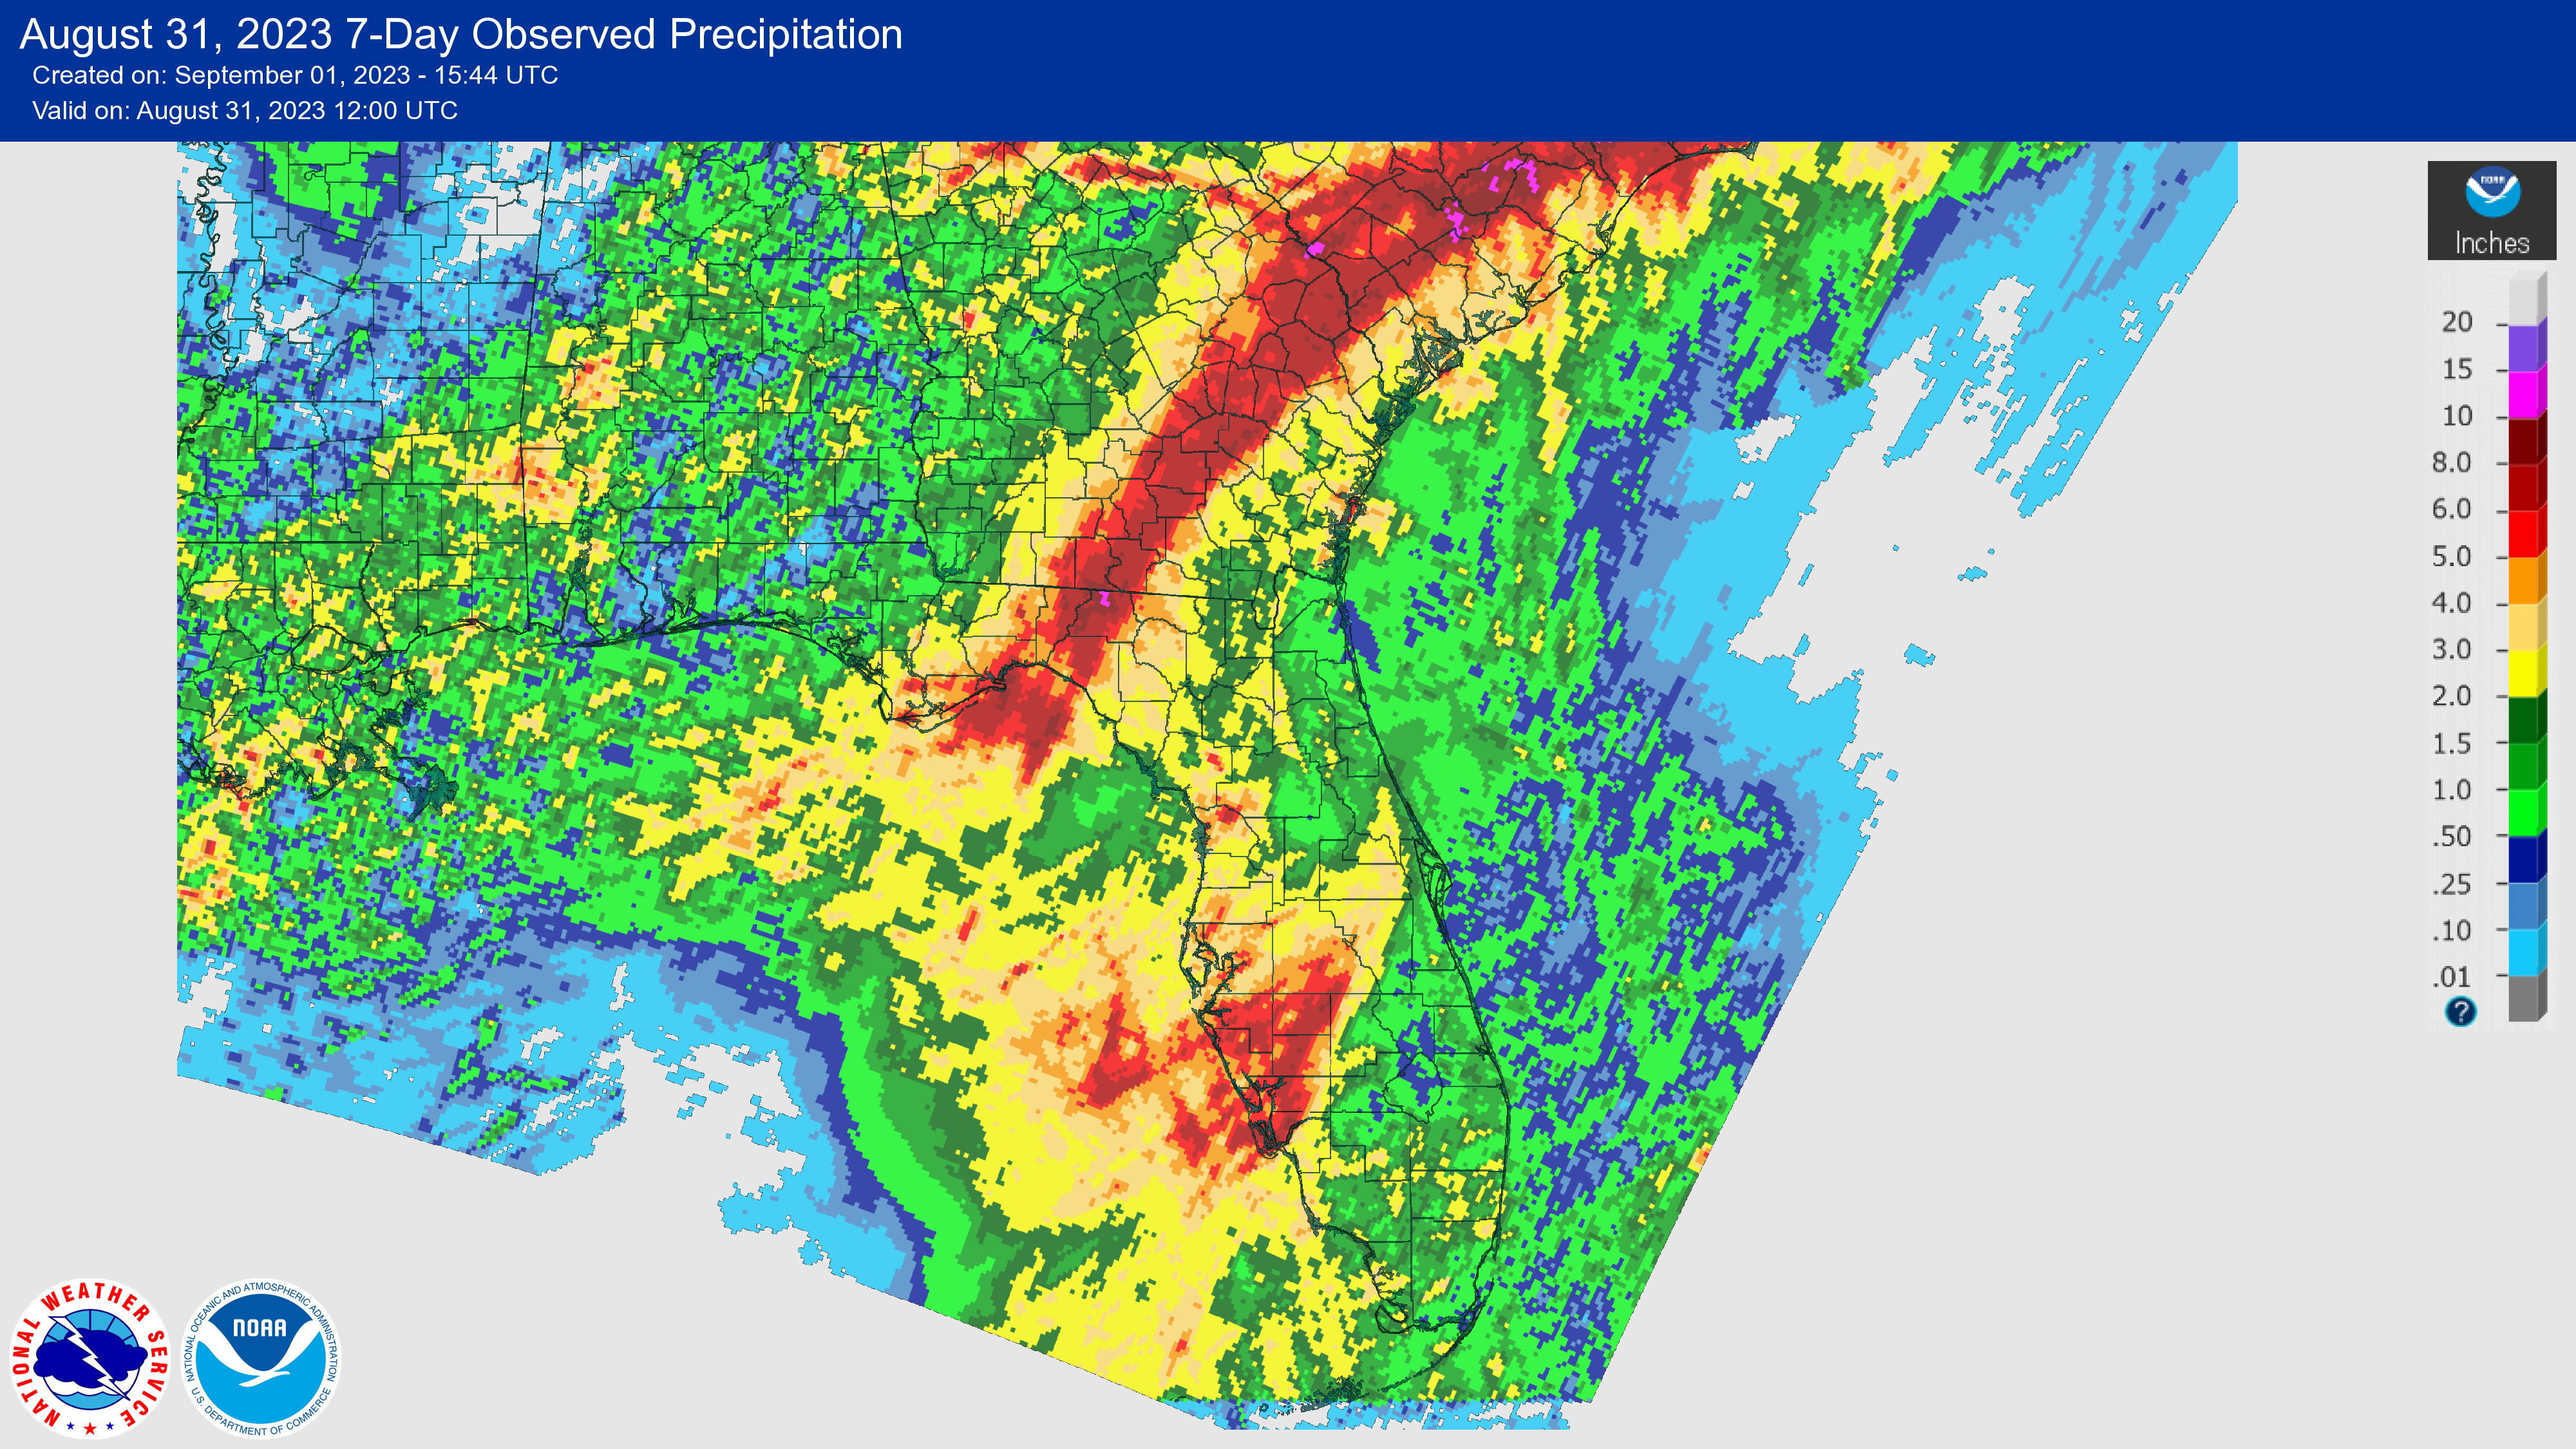
Hurricane Idalia rainfall clearly seen over Florida and the Southeast U.S. in weekly rainfall map (Source: National Weather Service).
Drought-Related Impacts.
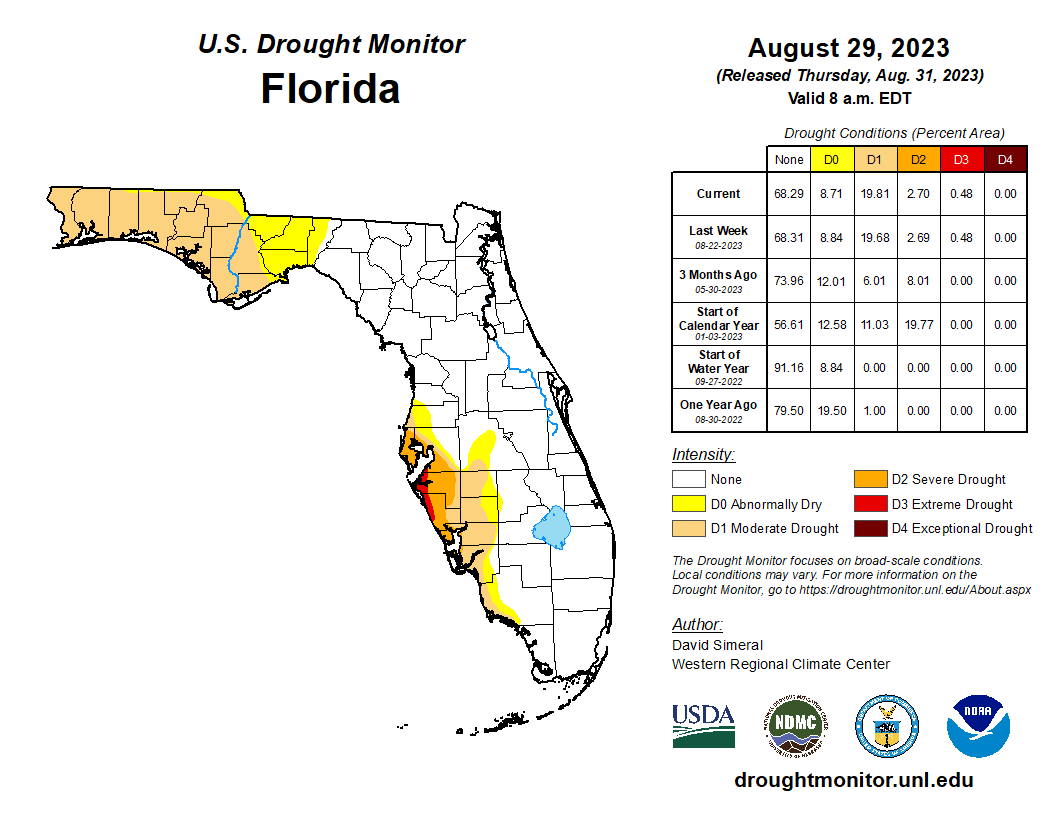
In mid-August, a lack of rainfall combined with extreme heat led to the development of abnormally dry conditions in the Panhandle. By the 15th, roughly 1% of the state was in extreme drought (D3), 3% was in severe drought (D2), 4% was in moderate drought (D1), and 23% was abnormally dry (D0), according to the U.S. Drought Monitor. By the end of the month, continued dryness and extreme heat led to the development of drought in the Panhandle while rainfall from Hurricane Idalia led to slight improvement in drought along the west central coast. As of August 29th, 0.5% of the state was in extreme drought (D3), 2.7% was in severe drought (D2), 20% was in moderate drought (D1), and about 9% was abnormally dry (D0) (see Figure 2 below).
As of August 31, the Lake Okeechobee water level was 15.36 ft. above sea level (Feet-NGVD29), which is above average for this time of year. At the first of the month, the water level was 15.18 ft. above sea level.
Figure 2. A graphical depiction of the latest drought conditions in Florida according to the U.S. Drought Monitor (courtesy of the National Drought Mitigation Center, University of Nebraska-Lincoln).
Agriculture-Related Impacts.
In mid-August, topsoil moisture conditions were adequate in 69% of the state, short in 17%, and very short in 6% of the state, while 8% of the state was experiencing surplus topsoil moisture conditions. Toward the end of August, topsoil moisture conditions were adequate in 62% of the state, short in 17%, and very short in 16% of the state; just 5% of the state was in surplus. For more information, consult the Crop Progress and Conditions Report, which is published by the USDA’s National Agricultural Statistics Service.
Appendix 1
Additional August departures from normal data for select Florida locations (Source: NWS).
| Station | Average Temperature (˚F) | Departure from Normal (˚F) | Total Rainfall (in.) | Departure from Normal (in.) |
| Gainesville | 84.0 | +2.7 | 6.14 | -0.26 |
| Sarasota | 85.9 | +2.5 | 9.12 | +0.01 |
| Naples | 87.0 | +3.7 | 4.05 | -4.84 |
| Fort Myers | 85.9 | +2.5 | 9.69 | -0.74 |
| West Palm Beach | 85.3 | +2.1 | 5.68 | -3.00 |
| Cross City | 84.3 | +3.1 | 10.81 | +2.71 |
Appendix 2
Select daily record high maximum temperatures (°F) broken or tied during August (compiled from NOAA).
| Location | Date | Record | Broken/Tied | Last |
| Homestead | 1 | 96 | Broken | 95 in 2010 |
| Key West | 1 | 94 | Broken | 93 in 1991 |
| Key West | 2 | 95 | Broken | 93 in 2007 |
| Crestview | 2 | 101 | Broken | 100 in 1990 |
| Crestview | 3 | 100 | Broken | 99 in 2015 |
| Key West | 4 | 94 | Broken | 93 in 2007 |
| Jacksonville Beach | 5 | 97 | Broken | 95 in 1954 |
| Niceville | 5 | 100 | Broken | 99 in 1989 |
| Key West | 5 | 94 | Broken | 93 in 2007 |
| Pensacola | 5 | 102 | Broken | 98 in 1989 |
| Bradenton | 6 | 98 | Broken | 95 in 2017 |
| Homestead | 7 | 99 | Broken | 95 in 2016 |
| Plant City | 7 | 103 | Broken | 98 in 2022 |
| Key West | 7 | 96 | Broken | 95 in 2022 |
| Tallahassee | 7 | 99 | Broken | 98 in 1956 |
| Bradenton | 8 | 100 | Broken | 96 in 1993 |
| Clermont | 8 | 99 | Broken | 98 in 2007 |
| Titusville | 8 | 99 | Broken | 98 in 2011 |
| Daytona Beach | 8 | 98 | Broken | 97 in 1989 |
| Bradenton | 9 | 101 | Broken | 96 in 1993 |
| Clermont | 9 | 100 | Broken | 97 in 2020 |
| Tampa | 9 | 97 | Broken | 96 in 2020 |
| Vero Beach | 9 | 97 | Broken | 95 in 1989 |
| Bradenton | 10 | 99 | Broken | 97 in 1993 |
| Homestead | 10 | 98 | Broken | 96 in 2019 |
| Mayport | 10 | 101 | Broken | 97 in 2007 |
| Daytona Beach | 10 | 99 | Broken | 96 in 1984 |
| Vero Beach | 10 | 98 | Broken | 97 in 1955 |
| Homestead | 11 | 100 | Broken | 97 in 2018 |
| Jacksonville | 11 | 102 | Broken | 99 in 2006 |
| Bradenton | 12 | 100 | Broken | 96 in 1984 |
| Ocala | 12 | 100 | Broken | 98 in 2011 |
| Orlando | 12 | 100 | Broken | 97 in 2011 |
| Pensacola | 12 | 100 | Broken | 99 in 1954 |
| Tallahassee | 12 | 100 | Tied | 100 in 2011 |
| Clermont | 13 | 101 | Broken | 97 in 2021 |
| Tampa | 13 | 100 | Broken | 96 in 1999 |
| Gainesville | 13 | 99 | Broken | 97 in 1999 |
| Usher Tower | 14 | 100 | Broken | 96 in 2007 |
| Tallahassee | 14 | 100 | Broken | 99 in 2007 |
| Kissimmee | 16 | 98 | Broken | 96 in 1998 |
| Crestview | 23 | 102 | Broken | 100 in 2011 |
| Tallahassee | 25 | 102 | Broken | 99 in 1989 |
| Pensacola | 26 | 105 | Broken | 100 in 2011 |
| Chipley | 27 | 102 | Broken | 100 in 2011 |
| Crestview | 27 | 103 | Broken | 99 in 2011 |
| Pensacola | 27 | 101 | Broken | 98 in 2011 |
| Miami | 31 | 96 | Broken | 95 in 1998 |
Appendix 3
Select daily record high minimum temperatures (°F) broken during August (compiled from NOAA).
| Location | Date | Record | Last |
| Jacksonville Beach | 1 | 84 | 81 in 1999 |
| Key West | 1 | 86 | 85 in 2015 |
| Bradenton | 2 | 79 | 78 in 2022 |
| Daytona Beach | 3 | 81 | 79 in 2014 |
| Orlando | 3 | 78 | 77 in 2020 |
| Pensacola | 4 | 82 | 81 in 2008 |
| Bradenton | 7 | 82 | 79 in 2015 |
| Key West | 7 | 87 | 85 in 2016 |
| Miami | 7 | 83 | 82 in 2017 |
| West Palm Beach | 7 | 83 | 82 in 2017 |
| Pensacola | 7 | 84 | 82 in 1972 |
| Bradenton | 8 | 81 | 79 in 2012 |
| Fort Myers | 8 | 82 | 80 in 2008 |
| Key West | 8 | 87 | 85 in 2009 |
| Orlando | 8 | 82 | 79 in 2017 |
| Tampa | 8 | 83 | 80 in 2021 |
| Vero Beach | 8 | 81 | 80 in 2017 |
| Lakeland | 8 | 81 | 77 in 2013 |
| Clermont | 9 | 80 | 78 in 2019 |
| Orlando | 9 | 81 | 79 in 1987 |
| Fort Myers | 9 | 82 | 79 in 2019 |
| Key West | 9 | 88 | 85 in 2007 |
| Bradenton | 10 | 83 | 79 in 2018 |
| Kissimmee | 10 | 80 | 78 in 2017 |
| Venice | 10 | 81 | 80 in 2019 |
| Pensacola | 10 | 84 | 79 in 2015 |
| Orlando | 10 | 82 | 79 in 2022 |
| Lisbon | 11 | 78 | 76 in 2007 |
| Pensacola | 11 | 84 | 80 in 1987 |
| Deland | 12 | 81 | 77 in 1955 |
| Lisbon | 11 | 78 | 76 in 2007 |
| Sanford | 12 | 80 | 77 in 2020 |
| Tampa | 12 | 79 | 77 in 2019 |
| Tampa | 13 | 80 | 77 in 2019 |
| Vero Beach | 13 | 80 | 77 in 2020 |
| Tallahassee | 13 | 79 | 76 in 2019 |
| Miami | 14 | 83 | 82 in 2020 |
| Naples | 15 | 81 | 79 in 1949 |
| Orlando | 20 | 78 | 77 in 2007 |
| Jacksonville Beach | 21 | 82 | 80 in 2019 |
| Pensacola | 23 | 81 | 79 in 2021 |
| Tallahassee | 23 | 79 | 77 in 2021 |
| Key West | 28 | 85 | 84 in 2020 |
| Naples | 30 | 86 | 81 in 2005 |
| Fort Lauderdale | 31 | 82 | 81 in 2014 |