
Prepared by Florida Climate Center
The Florida State University
Tallahassee, FL

Key Points:
- July 2023 was the hottest July on record for many stations, and July 2023 became the hottest month ever recorded at several stations.
- July 2023 tied June 1998 as the hottest month ever in Florida.
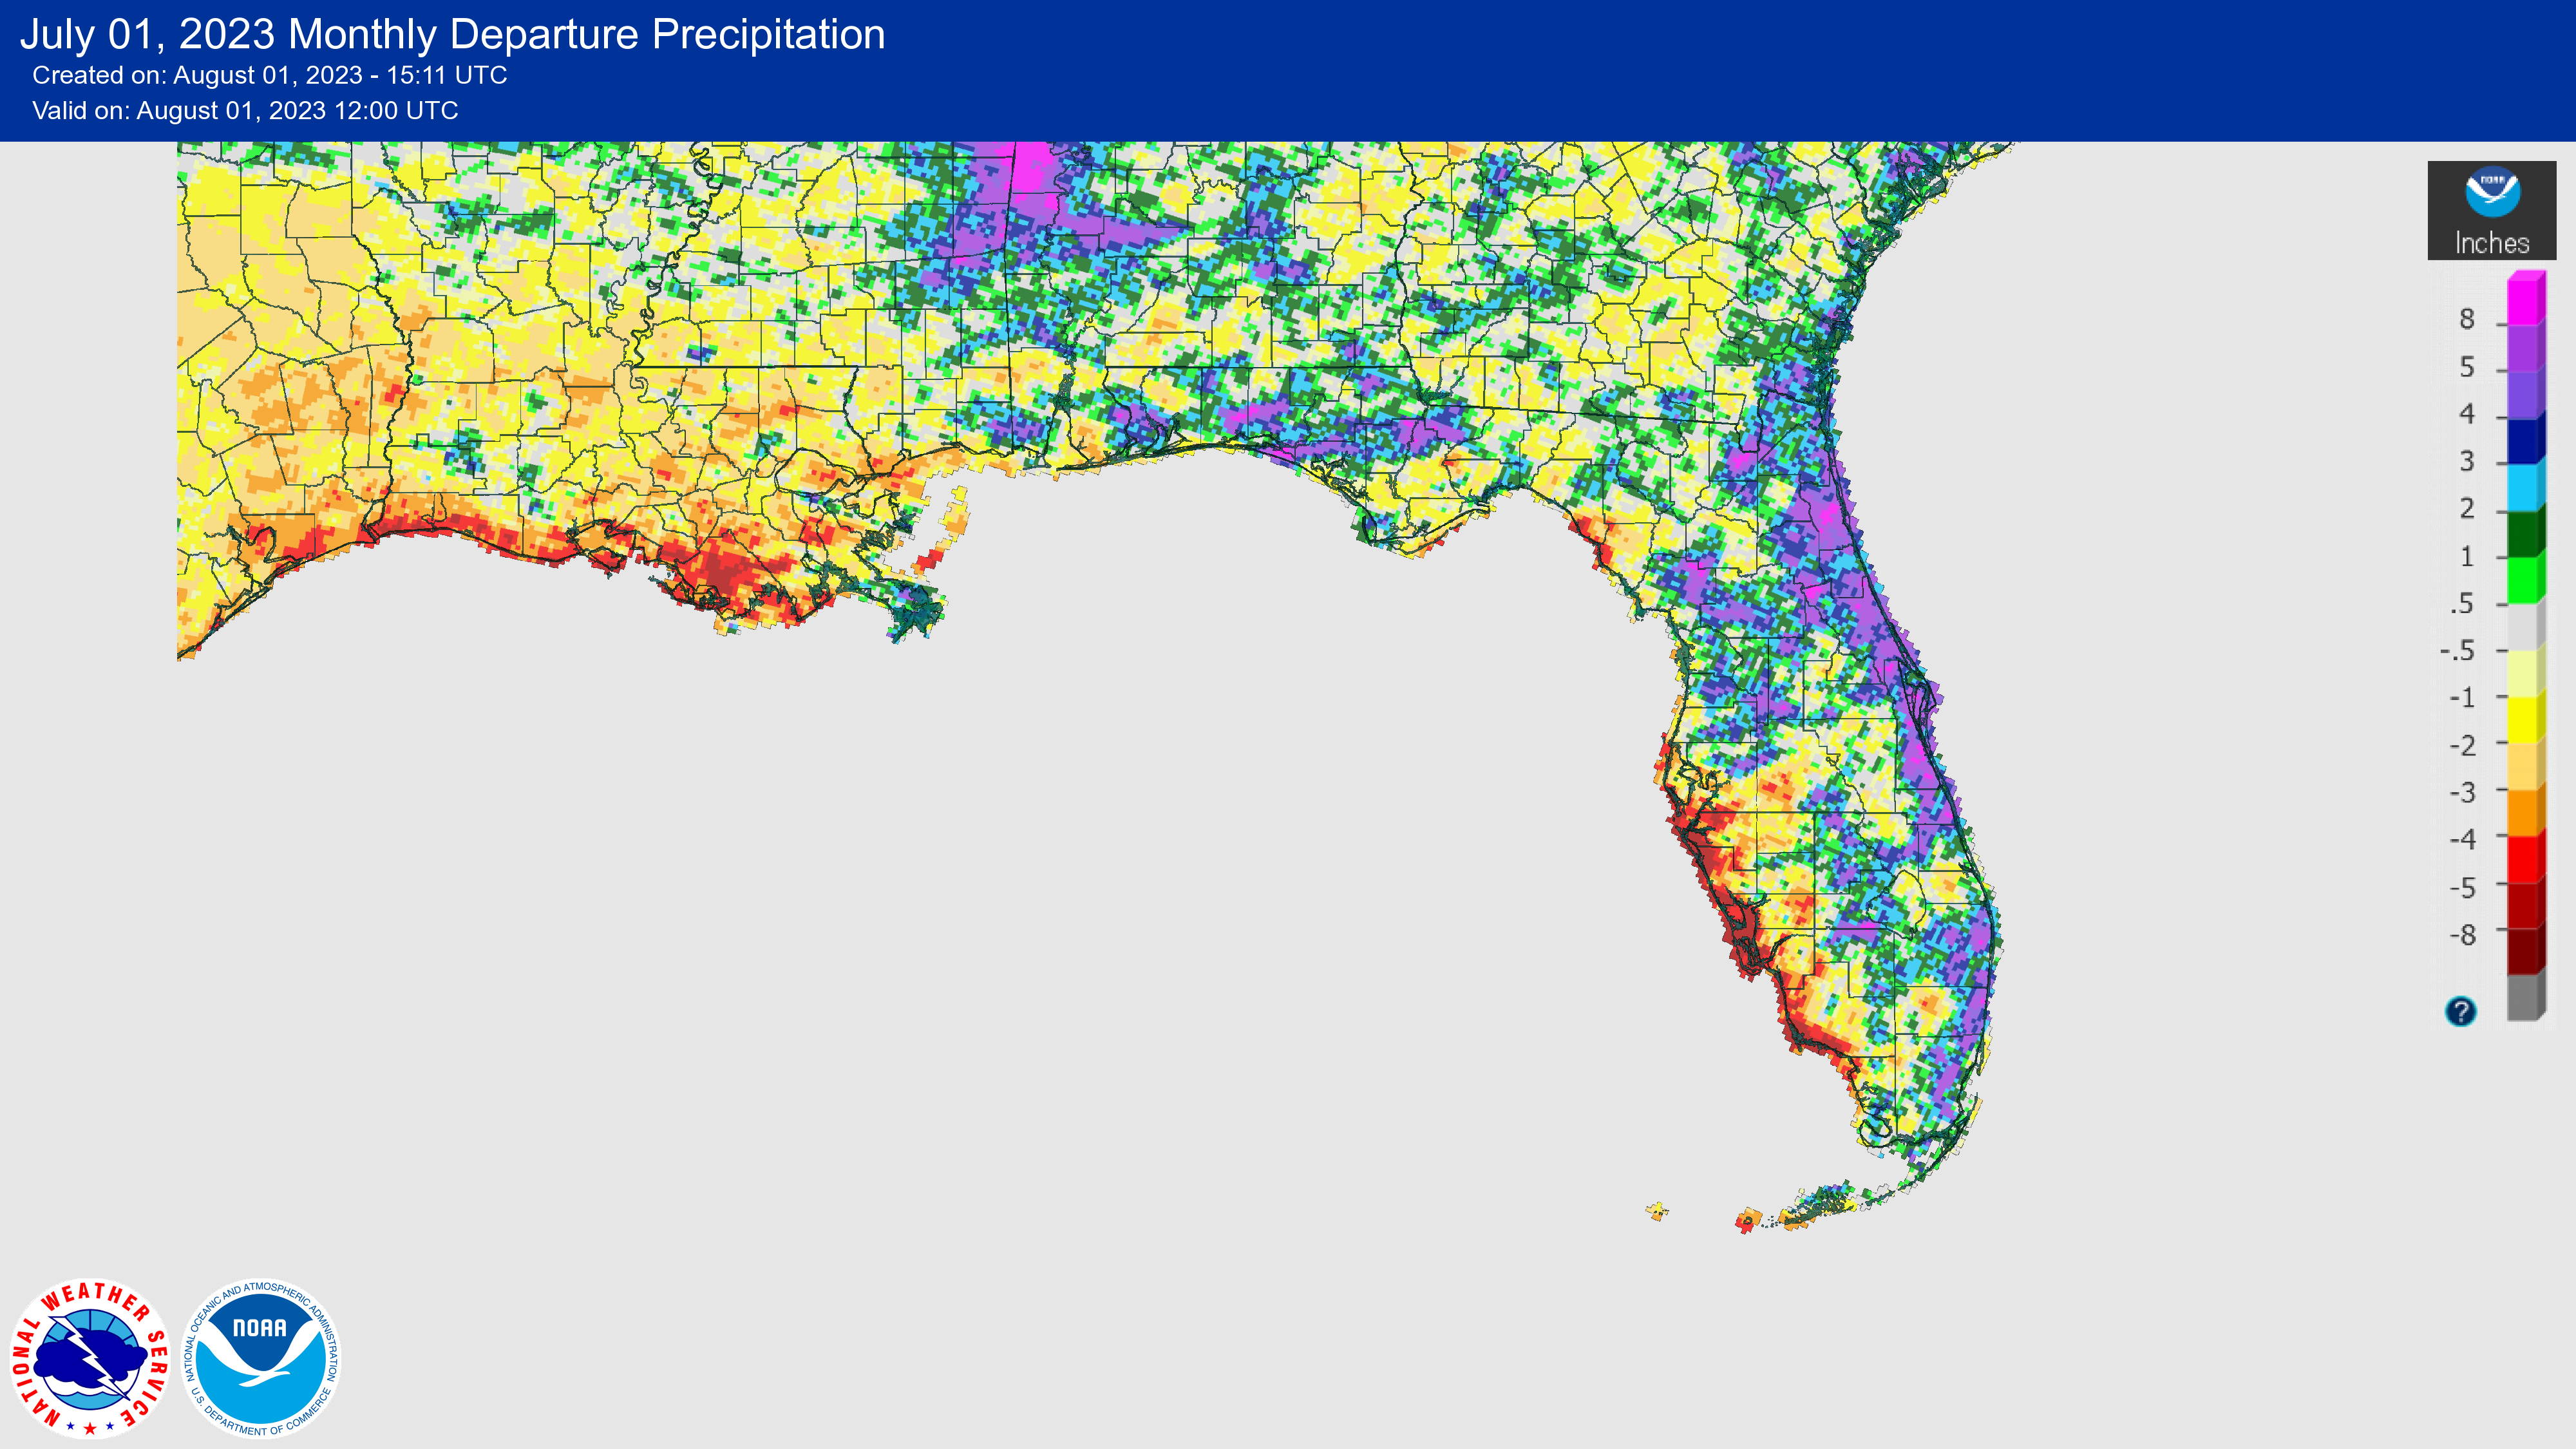
- Monthly precipitation totals for July were above normal across the eastern coast but well below normal along the west Florida coast.
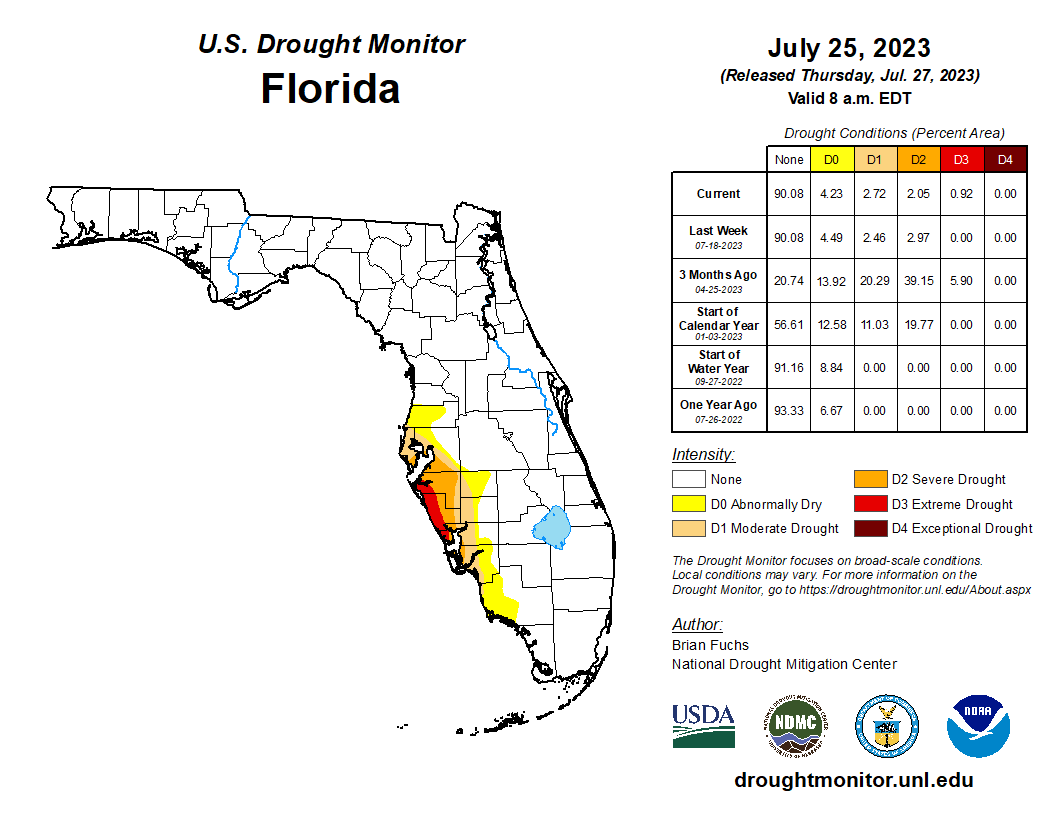
- Extreme drought was reintroduced to the Florida west coast by the end of the month, with continued below-normal rainfall.
- An El Niño Advisory continues and has a 90% chance of persisting through the Northern Hemisphere winter, peaking with moderate to strong intensity.
Average monthly temperatures in July were above normal across the state. Average temperature departures from normal ranged from +0.7 ̊F in Melbourne to +3.0 ̊F in Sarasota for the month (see Table 1 and Appendix 1 for select cities). High temperatures and oppressive humidity affected much of the state. Triple digit temperatures were reached in several locations, such as Tallahassee on the 1st and 21st (100 ̊F) and on the 30th (101 ̊F), and Clermont on the 4th (102 ̊F) and 5th (101 ̊F). Most places statewide saw one of their top 5 hottest Julys on record, and several locations observed their hottest July on record, based on monthly average temperatures, including Pensacola, Jacksonville, Tampa, Sarasota, Vero Beach, Fort Myers, Naples, Miami, and Key West. South Florida experienced record-breaking heat indices, with Miami reaching a heat index over 110 ̊F on both the 9th and 10th, as well as a record 46 consecutive days with a heat index above 100 ̊F. In addition, not only was July 2023 the hottest July on record for Miami, it was the hottest month ever recorded at the Miami International Airport station, since 1937. July 2023 also tied June 1998 as Florida's hottest month ever, based on statewide monthly average temperatures. Select daily high maximum temperature records tied or broken during the month are provided in Appendix 2.
Table 1. July average temperatures and departures from normal ( ̊F) for selected cities.
| Station | Mean Temperature | Departure from Normal |
| Pensacola | 85.5 | +2.0 |
| Tallahassee | 84.6 | +2.1 |
| Jacksonville | 84.7 | +2.2 |
| Orlando | 84.9 | +2.3 |
| Tampa | 86.5 | +2.7 |
| Miami | 86.5 | +2.4 |
| Key West | 87.7 | +2.3 |
Monthly rainfall totals in July were near to above normal in the Panhandle and eastern Florida, while the western coast was well below normal. The monthly precipitation departures from normal ranged from -6.29 inches in Sarasota to +5.91 inches in West Palm Beach (see Table 2 and Appendix 1 for select locations). July saw plentiful rainfall, but much of the rain was confined to the eastern coast and the Panhandle. Indeed, July became a tale of two Peninsulas – plentiful rainfall in the east and much below normal rainfall along the west coast. The Sarasota-Bradenton area had its 2nd-driest July on record, and Naples had its 3rd-driest July on record. Melbourne had its 2nd-wettest July on record, Vero Beach was 3rd-wettest, and Fort Lauderdale had its 5th-wettest July on record. Fort Lauderdale has had its wettest year on record to date, while the Sarasota-Bradenton area has had its driest year on record so far, where the year-to-date rainfall deficit stands at 20.68 inches.
Table 2. July precipitation totals and departures from normal (inches) for selected cities.
| Station | Total Rainfall | Departure from Normal |
| Pensacola | 6.99 | -0.90 |
| Tallahassee | 6.41 | -0.73 |
| Jacksonville | 7.93 | +1.16 |
| Orlando | 6.82 | -0.64 |
| Tampa | 2.84 | -4.91 |
| Miami | 7.42 | +0.06 |
| Key West | 1.46 | -2.17 |
Figure 1. A graphical depiction of the monthly rainfall departure from normal (inches) for July (courtesy of NOAA, NWS).
El Niño Advisory.
Weak El Niño conditions, the warm phase of the El Niño Southern Oscillation climate pattern, in the tropical equatorial Pacific Ocean continued in July. El Niño is still expected to persist through the Northern Hemisphere winter 2023-24 (90% chance). Forecasters favor continued growth of El Niño through the fall, peaking this winter with moderate-to-strong intensity (81% chance of November-January Niño-3.4 ≥ 1.0°C). However, a strong El Niño, with seasonally averaged Niño-3.4 values equal to or greater than 2.0°C (rivaling the winters of 1997-98 or 2015-16), has only a 20% chance of occurring.
Hazardous Weather Events in July.
According to the Local Storm Reports issued by the local National Weather Service offices serving Florida, there were 595 individual local reports of hazardous weather events recorded across the state during the month of July (see Table 4 for a breakdown by event type). July saw active weather with heavy rain, thunderstorm activity, and strong wind gusts. Three fatalities occurred during the month due to rip currents. No tornadoes were reported during the month.
Table 3. Breakdown of storm reports submitted in Florida during the month of July (compiled from Iowa State University/Iowa Environmental Mesonet).
| Report Type | Number of Reports |
| Heavy Rain | 37 |
| Flood | 10 |
| Flash Flood | 22 |
| Coastal Flood | 0 |
| Hail | 13 |
| Lightning | 4 |
| Non-Thunderstorm Wind Gust | 9 |
| Non-Thunderstorm Wind Damage | 0 |
| Tornado/Waterspout/Funnel Cloud | 0/17/2 |
| Thunderstorm Wind Damage | 120 |
| Thunderstorm Wind Gust | 351 |
| Rip Currents | 10 |
Daily Record Events in July.
Table 4. Summary of daily records broken or set in Florida in July (source: NCEI Daily Weather Records).
| Category | Number of Records |
| Highest daily max. temp. | 72 |
| Highest daily min. temp. | 89 |
| Lowest daily max. temp. | 6 |
| Lowest daily min. temp. | 2 |
| Highest daily precipitation | 39 |
| Total | 208 |
Weather/Climate Highlight of the Month: Extreme Heat
July 2023 was the hottest month ever recorded for many stations in Florida, based on monthly average temperatures, including Miami, Key West, Tampa, Fort Myers (dating back to 1892), and Bradenton (dating back to 1911). A marine heatwave has also affected areas around the Florida Keys, with water temperatures reaching the upper 90s, which is well above normal and has led to coral bleaching and die-off. A buoy in Manatee Bay recorded an extreme water temperature of 101 ̊F on July 24th, which received a lot of media attention. While this was not representative of ocean sea surface temperatures, coastal and open ocean temperatures in the Atlantic, Gulf of Mexico, and around the Florida Keys were much above normal in July, contributing to oppressive humidity and high heat indices in South Florida.
Globally, the past two months have been record-breaking. June 2023 was the warmest June on record globally, and July 2023 is set to be the hottest month ever recorded.
Drought-Related Impacts.
In mid-July, severe drought (D2) was introduced to the western coast of the Peninsula as year-to-date rainfall deficits continued to accumulate. About 3% of the state was in severe drought (D2), 3% was in moderate drought (D1), and 8% was abnormally dry, according to the U.S. Drought Monitor. As the month neared its end, continued below-normal rainfall led to the introduction of extreme drought confined to the west Florida coast. As of July 25, 1% of the state was in extreme drought (D3), 2% was in severe drought (D2), 3% was in moderate drought (D1), and 4% was abnormally dry (Figure 2 below).
As of July 31, the Lake Okeechobee water level was 15.13 ft. above sea level (Feet-NGVD29), which is above average for this time of year. At the first of the month, the water level was 14.65 ft. above sea level.
Figure 2. A graphical depiction of the latest drought conditions in Florida according to the U.S. Drought Monitor (courtesy of the National Drought Mitigation Center, University of Nebraska-Lincoln).
Agriculture-Related Impacts.
In mid-July, topsoil moisture conditions were adequate in 69% of the state, short in 8%, and very short in 3% of the state, while 20% of the state was experiencing surplus topsoil moisture conditions. By the end of July, topsoil moisture conditions were adequate in 73% of the state, short in 16%, and very short in 5% of the state; 6% of the state was in surplus. For more information, consult the Crop Progress and Conditions Report, which is published by the USDA’s National Agricultural Statistics Service.
Appendix 1
Additional July departures from normal data for select Florida locations (Source: NWS).
| Station | Average Temperature (˚F) | Departure from Normal (˚F) | Total Rainfall (in.) | Departure from Normal (in.) |
| Gainesville | 83.4 | +2.0 | 4.57 | -2.11 |
| Sarasota | 86.2 | +3.1 | 1.10 | -6.29 |
| Melbourne | 83.8 | +0.7 | 11.79 | +5.29 |
| Fort Myers | 86.1 | +2.9 | 4.24 | -5.14 |
| West Palm Beach | 84.5 | +1.4 | 11.54 | +5.91 |
Appendix 2
Select daily record high maximum temperatures (°F) broken or tied during July (compiled from NOAA).
| Location | Date | Record | Broken/Tied | Last |
| Homestead | 1 | 98 | Broken | 97 in 2007 |
| Tampa | 1 | 97 | Broken | 95 in 2014 |
| Tallahassee | 2 | 100 | Tied | 100 in 1998 |
| Plant City | 2 | 100 | Broken | 99 in 2019 |
| Clermont | 4 | 102 | Broken | 97 in 2019 |
| Plant City | 4 | 103 | Broken | 99 in 1997 |
| Orlando | 4 | 98 | Broken | 96 in 2016 |
| Tampa | 4 | 97 | Broken | 96 in 1998 |
| Canal Point | 5 | 99 | Broken | 97 in 1992 |
| Clermont | 5 | 101 | Broken | 98 in 2016 |
| Plant City | 5 | 104 | Broken | 98 in 2019 |
| Jacksonville | 5 | 98 | Tied | 98 in 1969 |
| Miami | 6 | 95 | Tied | 95 in 2009 |
| West Palm Beach | 6 | 97 | Broken | 95 in 2016 |
| Miami | 7 | 97 | Broken | 95 in 2020 |
| Lakeland | 7 | 99 | Broken | 98 in 1992 |
| Miami | 8 | 96 | Broken | 95 in 2020 |
| Vero Beach | 9 | 96 | Broken | 95 in 2020 |
| Homestead | 10 | 100 | Broken | 98 in 2020 |
| Miles City | 11 | 102 | Broken | 100 in 2008 |
| Miami | 11 | 96 | Broken | 95 in 2010 |
| Perrine | 12 | 95 | Broken | 94 in 2022 |
| Miami | 12 | 97 | Broken | 95 in 1981 |
| Bradenton | 14 | 97 | Tied | 97 in 2020 |
| Fort Myers | 19 | 97 | Tied | 97 in 1979 |
| Tampa | 19 | 96 | Tied | 96 in 2010 |
| Bradenton | 20 | 98 | Broken | 96 in 2014 |
| Canal Point | 20 | 97 | Broken | 96 in 2016 |
| Clermont | 21 | 99 | Broken | 98 in 2021 |
| Tampa | 21 | 96 | Broken | 95 in 2016 |
| Tallahassee | 21 | 100 | Tied | 100 in 1942 |
| Jacksonville | 21 | 100 | Broken | 99 in 1993 |
| Homestead | 23 | 98 | Broken | 97 in 2021 |
| Miami | 23 | 98 | Broken | 95 in 2005 |
| Fort Lauderdale | 24 | 98 | Broken | 97 in 2005 |
| Homestead | 24 | 99 | Broken | 96 in 2018 |
| Naples | 24 | 98 | Broken | 97 in 2009 |
| Key West | 25 | 97 | Broken | 96 in 2022 |
| Crestview | 27 | 100 | Broken | 99 in 1993 |
| Jacksonville Beach | 29 | 100 | Broken | 98 in 1968 |
| Miles City | 30 | 101 | Broken | 100 in 2016 |