
Prepared by Florida Climate Center
The Florida State University
Tallahassee, FL

Key Points:
- Monthly mean temperatures in June were near normal for the month.
- Monthly precipitation totals for June were mixed, with above normal rainfall in southeast and north-central Florida and below normal rainfall in southwest Florida and the central Panhandle.
- Drought conditions improved across the state during the month, and by mid-month drought had been removed with lingering abnormally dry conditions along the west-central coast.
- An El Niño Advisory went into effect in June and El Niño conditions are expected to strengthen in the tropical Pacific in the coming months.
- Short-lived Tropical Storm Arlene formed in the Gulf of Mexico early in the month, while two tropical storms formed in the eastern Atlantic Ocean, Bret and Cindy, which is more typical of August for this part of the Atlantic Basin.
Average monthly temperatures in June were near normal across the state. Average temperature departures from normal ranged from -0.8 ̊F in Melbourne to +1.3 ̊F in Key West for the month (see Table 1 and Appendix 1 for select cities). Many places came close to reaching triple-digit temperatures near the end of the month, including Tallahassee which peaked at 99 ̊F on the 28th. Statewide, June ranked 29th warmest on record for Florida. However, Florida continues to see its hottest year on record so far, from January through June. Select daily high maximum temperature records tied or broken during the month are provided in Appendix 2.
| Station | Mean Temperature | Departure from Normal |
| Pensacola | 81.6 | -0.1 |
| Tallahassee | 80.9 | +0.1 |
| Jacksonville | 80.1 | -0.2 |
| Orlando | 82.1 | +0.9 |
| Tampa | 83.2 | +0.3 |
| Miami | 83.7 | +0.9 |
| Key West | 85.4 | +1.3 |
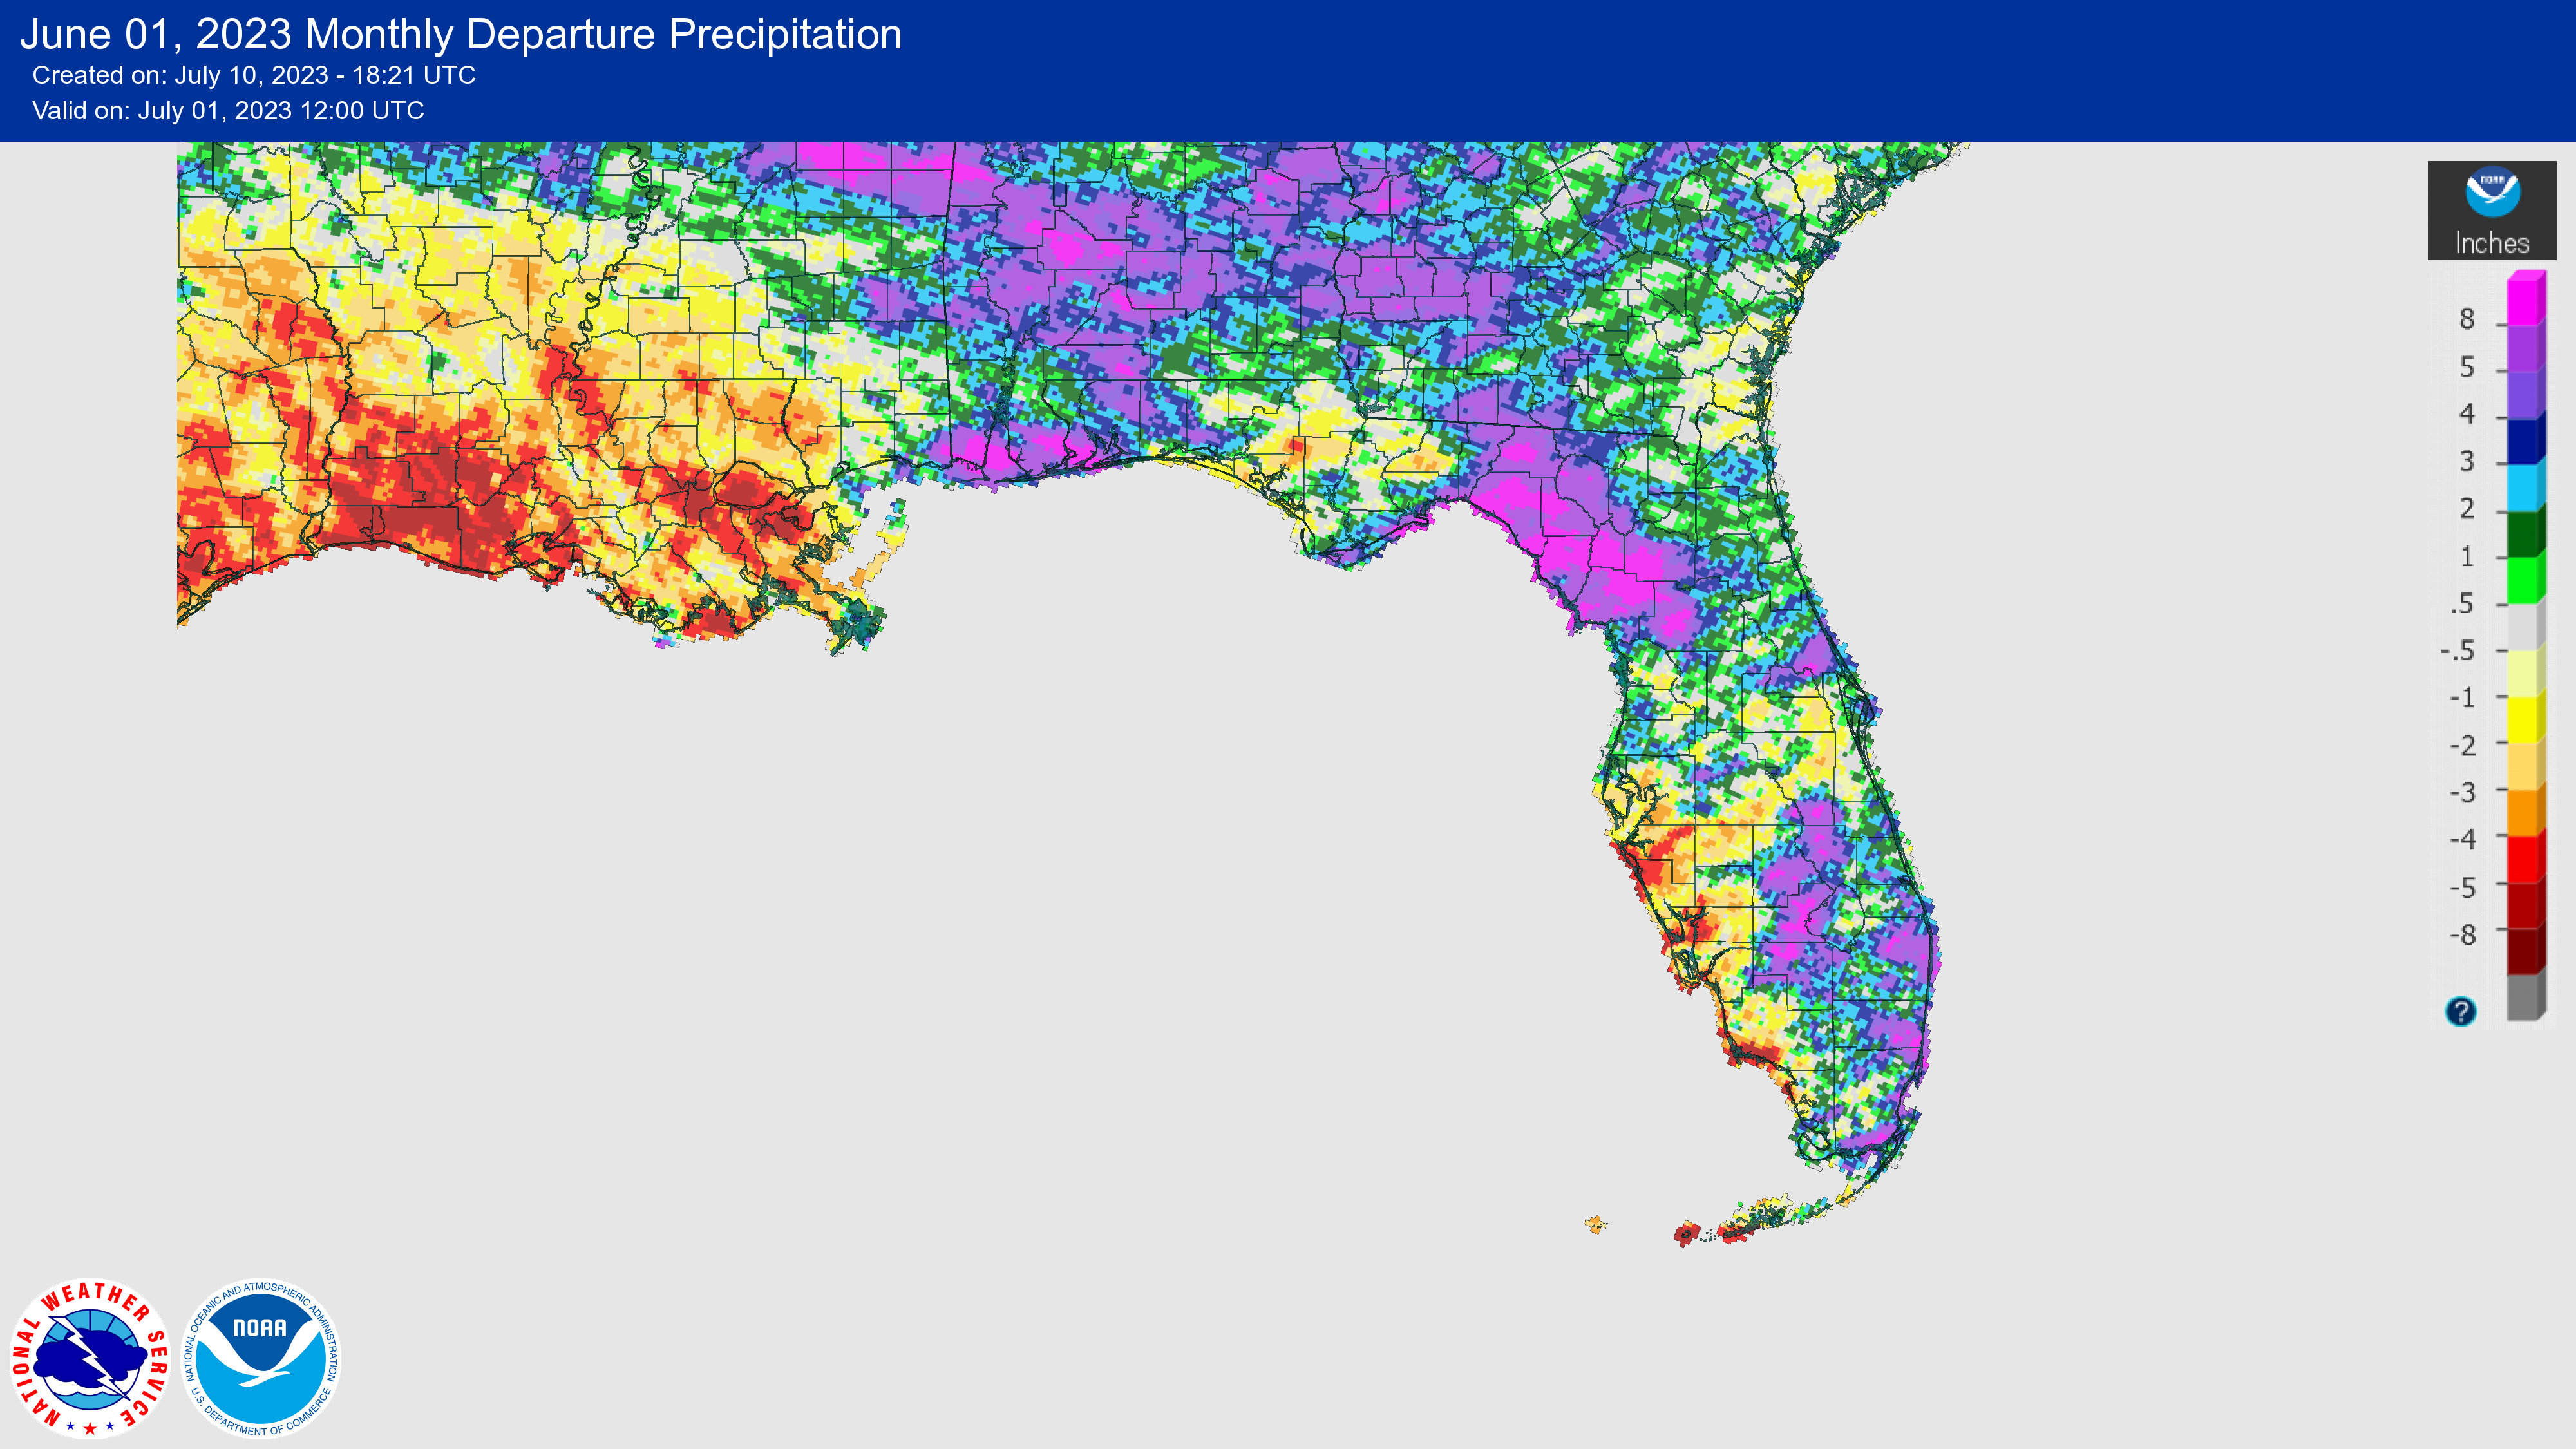
Monthly rainfall totals across the state in June were mixed. Above normal rainfall occurred in southeast and Big Bend regions of Florida and below normal rainfall affected southwest Florida and the central Panhandle. The monthly precipitation departures from normal ranged from -4.67 inches in Sarasota to +10.36 inches in Cross City (see Table 2 and Appendix 1 for select locations). Cross City experienced its wettest June on record, with a monthly rainfall total of 17.51 inches. Several other locations had one of their top 5 wettest Junes on record, including Lakeland (3rd-wettest), Gainesville (5th-wettest), Ocala (5th-wettest), and Vero Beach (5th-wettest). Pensacola had its 7th-wettest June on record, with much of its monthly rainfall falling in a single heavy rain event on the 15th, which produced 9.30 inches of rain mostly in a 6-hour period.
Table 2. June precipitation totals and departures from normal (inches) for selected cities.
| Station | Total Rainfall | Departure from Normal |
| Pensacola | 13.82 | +6.50 |
| Tallahassee | 5.65 | -2.11 |
| Jacksonville | 7.63 | +0.03 |
| Orlando | 7.31 | -0.74 |
| Tampa | 4.20 | -3.17 |
| Miami | 7.87 | -2.64 |
| Key West | 2.85 | -1.38 |
Figure 1. A graphical depiction of the monthly rainfall departure from normal (inches) for June (courtesy of NOAA, NWS).
El Niño Advisory.
An El Niño, the warm phase of the El Niño Southern Oscillation, developed in the tropical Pacific Ocean in June. The coupled ocean-atmosphere system reflected emerging El Niño conditions in May, including anomalous warmth in sea surface temperatures and below the surface of the equatorial Pacific Ocean. El Niño conditions are expected to gradually strengthen through the Northern Hemisphere winter. By the end of the year (November-January), there is an 84% chance of at least a moderate El Niño event (Niño-3.4 ≥ 1.0°C), and about a 56% chance of a strong El Niño (Niño-3.4 ≥ 1.5°C), according to the Climate Prediction Center at NOAA. This means that El Niño conditions are expected during the peak of the Atlantic Hurricane Season, August-October.
Hazardous Weather Events in June.
According to the Local Storm Reports issued by the local National Weather Service offices serving Florida, there were 1,032 individual local reports of hazardous weather events recorded across the state during the month of June (see Table 4 for a breakdown by event type). An active weather pattern continued in June with many severe weather reports submitted across the state, especially in the Panhandle and northern Florida regions. One lightning-related hospitalization was reported on the 1st of the month. 9 fatalities due to rip currents were reported. These included mostly out-of-town vacationers and occurred in Volusia County on the 2nd, Bay County on the 15th, 18th, 21st and 24th, and Walton County on the 22nd and 24th. Another fatality occurred in Escambia on the 16th due to downed limbs that fell on a manufactured home during a severe thunderstorm with an embedded small tornado. Heavy rain and thunderstorms generated nearly a foot of rain in a 3-hour period on the 16th in Escambia County as well, leading to flash flooding with rainfall totals of 14+ inches over a 6-hour period. A brief EF-2 tornado impacted Pensacola Beach on the same day, causing significant damage to homes and boats but no injuries or fatalities were reported. Golf ball sized hail was reported in Flagler County on the 19th.
Table 3. Breakdown of storm reports submitted in Florida during the month of June (compiled from Iowa State University/Iowa Environmental Mesonet).
| Report Type | Number of Reports |
| Heavy Rain | 42 |
| Flood | 24 |
| Flash Flood | 27 |
| Coastal Flood | 3 |
| Hail | 51 |
| Lightning | 1 |
| High Sustained Wind | 1 |
| Non-Thunderstorm Wind Gust | 22 |
| Non-Thunderstorm Wind Damage | 0 |
| Tornado/Waterspout/Funnel Cloud | 5/31/8 |
| Thunderstorm Wind Damage | 218 |
| Thunderstorm Wind Gust | 587 |
| Rip Currents | 11 |
| Wildfire | 1 |
Daily Record Events in June.
Table 4. Summary of daily records broken or set in Florida in June (source: NCEI Daily Weather Records).
| Category | Number of Records |
| Highest daily max. temp. | 16 |
| Highest daily min. temp. | 11 |
| Lowest daily max. temp. | 6 |
| Lowest daily min. temp. | 2 |
| Highest daily precipitation | 31 |
| Total | 66 |
Weather/Climate Highlight of the Month:
Tropical Storm Arlene formed in the Gulf of Mexico at the start of the Atlantic hurricane season on June 2. The storm drifted southward and quickly weakened as it entered unfavorable conditions for development. Two other early season tropical storms formed in the eastern Atlantic Ocean during the month, Bret and Cindy, which is not typical in this part of the Atlantic until August. Neither storm impacted the U.S. Sea surface temperatures in the Atlantic and Gulf of Mexico have been above average this summer and exceptionally warm.
Drought-Related Impacts.
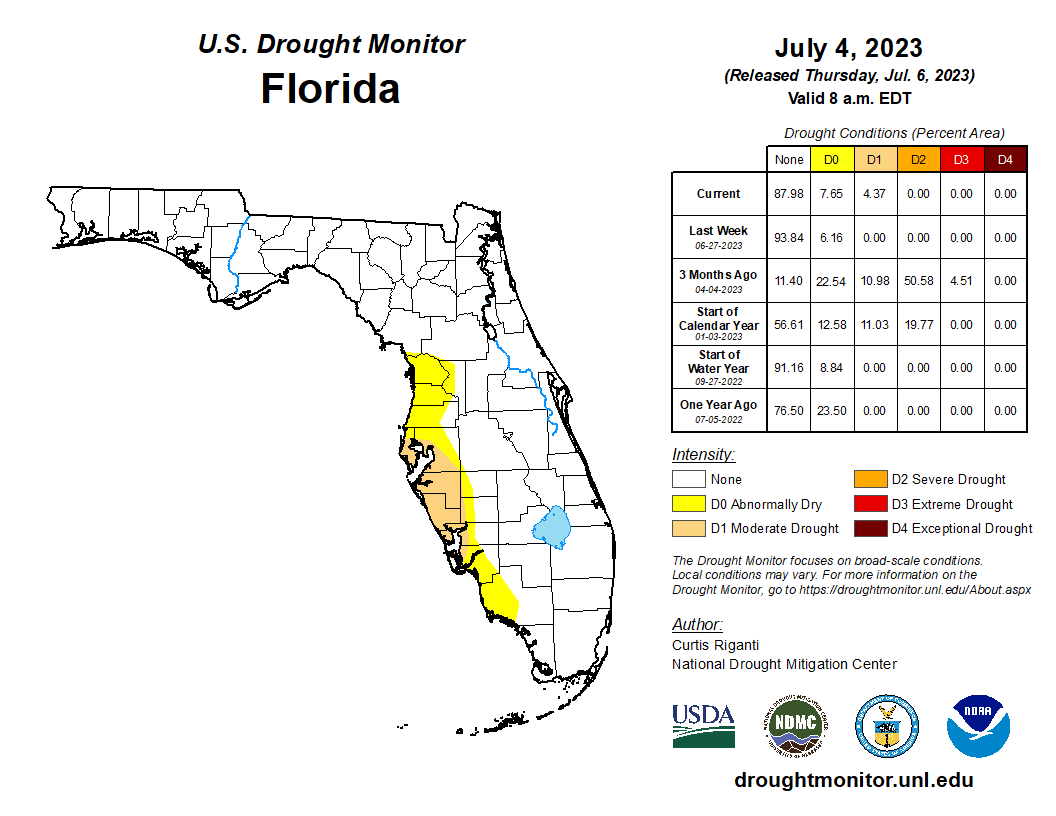
By the middle of June, moderate drought (D1) continued to affect the western central coast of Florida. About 9% of the state was in moderate drought and 8% was abnormally dry, according to the U.S. Drought Monitor. By month’s end, moderate drought (D1) and abnormally dry conditions lingered along the west coast of the Peninsula but with slight improvements. As of July 4th, 4% of the state was in moderate drought (D1), and about 8% of the state was abnormally dry (D0) (Figure 2).
As of June 30, the Lake Okeechobee water level was 14.64 ft. above sea level (Feet-NGVD29), which is above average for this time of year. At the first of the month, the water level was 13.89 ft. above sea level.
Figure 2. A graphical depiction of the latest drought conditions in Florida according to the U.S. Drought Monitor (courtesy of the National Drought Mitigation Center, University of Nebraska-Lincoln).
Agriculture-Related Impacts.
In mid-June, topsoil moisture conditions were adequate in 58% of the state, short in 22%, and very short in 9% of the state, while 11% of the state was experiencing surplus topsoil moisture conditions. By the end of June, topsoil moisture conditions were adequate in 74% of the state, short in 6%, and very short in 1% of the state; 19% of the state was in surplus. For more information, consult the Crop Progress and Conditions Report, which is published by the USDA’s National Agricultural Statistics Service.
Appendix 1
Additional June departures from normal data for select Florida locations (Source: NWS).
| Station | Average Temperature (˚F) | Departure from Normal (˚F) | Total Rainfall (in.) | Departure from Normal (in.) |
| Gainesville | 79.6 | -0.3 | 11.79 | +4.23 |
| Sarasota | 82.9 | +1.1 | 2.38 | -4.67 |
| Melbourne | 81.1 | -0.8 | 6.00 | -1.10 |
| Fort Myers | 83.5 | +1.2 | 6.14 | -3.52 |
| West Palm Beach | 82.3 | +0.6 | 12.39 | +3.91 |
Appendix 2
Select daily record high maximum temperatures (°F) broken or tied during June (compiled from NOAA).
| Location | Date | Record | Broken/Tied | Last |
| Canal Point | 13 | 96 | Tied | 96 in 2006 |
| Canal Point | 15 | 97 | Broken | 96 in 2016 |
| Clermont | 15 | 99 | Broken | 98 in 2022 |
| Fort Pierce | 16 | 97 | Broken | 96 in 1911 |
| Key West | 16 | 94 | Broken | 93 in 1951 |
| Miami | 16 | 95 | Broken | 94 in 2011 |
| Fort Lauderdale Beach | 19 | 95 | Broken | 94 in 2016 |
| Plant City | 19 | 99 | Broken | 98 in 1998 |
| Miami | 19 | 94 | Broken | 93 in 2011 |
| Fort Lauderdale Beach | 20 | 94 | Broken | 93 in 1958 |
| Plant City | 29 | 100 | Broken | 99 in 2020 |
| Key West | 29 | 94 | Broken | 92 in 2015 |
| Miami | 29 | 95 | Broken | 94 in 2020 |
| Clermont | 30 | 99 | Broken | 98 in 2014 |
| Tampa | 30 | 96 | Tied | 96 in 2014 |
| Venice | 30 | 95 | Broken | 94 in 2015 |