
Prepared by Florida Climate Center
The Florida State University
Tallahassee, FL

Key Points:
- Monthly average temperatures in May were generally near or above normal.
- Monthly precipitation totals for May were generally above normal for much of the state.
- With increasing rainfall, drought conditions improved across the state during the month, and 74% of the state was drought free by the end of the month. Drought removal is likely over the coming weeks as the rainy season becomes fully underway.
- A transition to El Niño is likely this summer with fairly high forecast confidence.
- A surface low formed in the Gulf at the end of the month and developed into a tropical depression on June 1, kicking off the 2023 Atlantic hurricane season.
Average monthly temperatures in May were generally near to above normal across the state. Average temperature departures from normal ranged from -1.1 ̊F in Melbourne to +2.0 ̊F in Fort Myers for the month (see Table 1 and Appendix 1 for select cities). While the middle of the month was generally warmer than normal for much of the state, the month began and ended with below normal average temperatures in most places. Thus, monthly departures from normal were not as warm as in previous months for most places. However, these first five months of the year, January-May, have been the warmest start to the year on record for many locations across the state, including Miami, Fort Myers, Key West, Sarasota, Tampa, Melbourne, Orlando, Daytona Beach, Ocala, Tallahassee, and Pensacola. Select daily high maximum temperature records tied or broken during the month are provided in Appendix 2.
Table 1. May average temperatures and departures from normal ( ̊F) for selected cities.
| Station | Mean Temperature | Departure from Normal |
| Pensacola | 76.5 | +0.5 |
| Tallahassee | 75.9 | +0.7 |
| Jacksonville | 74.2 | -0.7 |
| Orlando | 78.2 | +0.9 |
| Tampa | 79.6 | +0.1 |
| Miami | 81.2 | +1.1 |
| Key West | 82.0 | +0.9 |
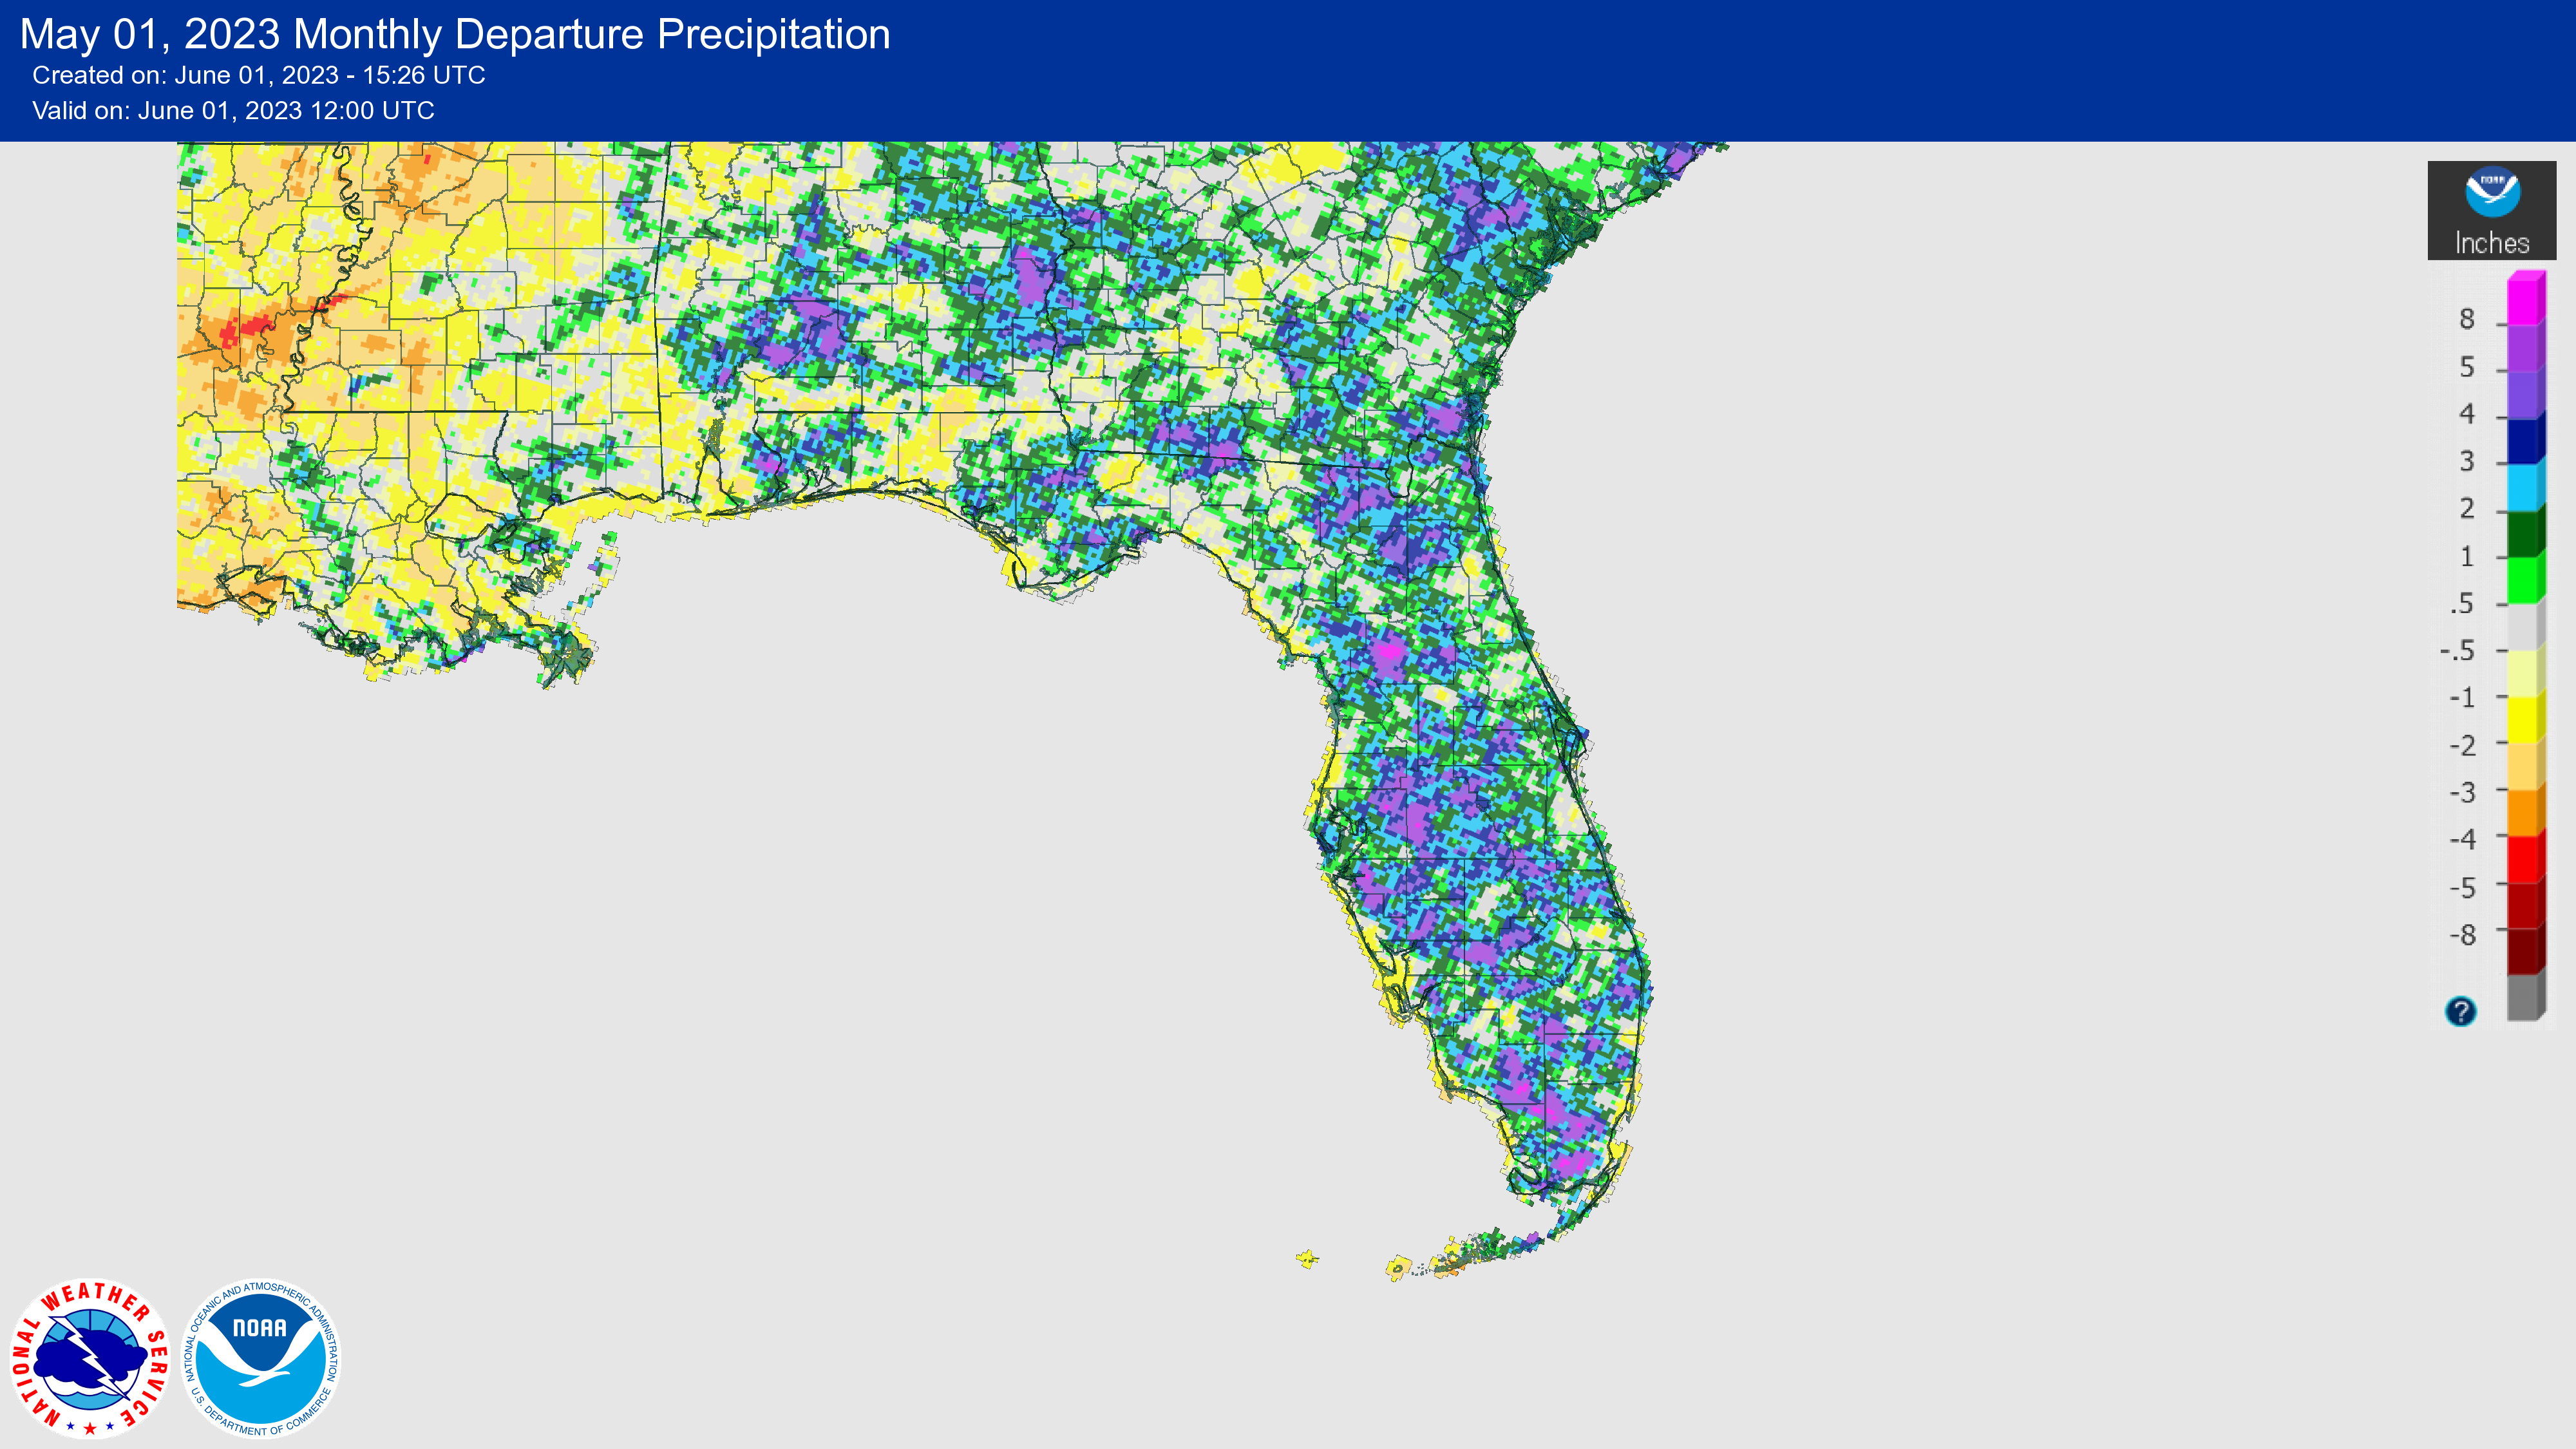
Monthly rainfall totals were generally above normal across the state in May. The monthly precipitation departures from normal ranged from -1.82 inches in Venice to +6.18 inches in Ocala (see Table 2 and Appendix 1 for select locations). Naples had its 4th-driest May on record, and some places are experiencing one of their driest starts to the year on record, January-May, including Naples with 3.08 inches this year (1st-driest), Tarpon Springs with 3.32 inches (2nd driest), and Venice with 5.00 inches this year (4th-driest). On the other hand, several locations experienced one of their wettest Mays on record including Fort Lauderdale (5th-wettest), Lakeland (5th-wettest), Bradenton (6th-wettest), Orlando (8th-wettest), Ocala (9th-wettest), and Jacksonville (9th-wettest). As such, drought conditions improved across the state by the end of the month (see drought information below).
Table 2. May precipitation totals and departures from normal (inches) for selected cities.
| Station | Total Rainfall | Departure from Normal |
| Pensacola | 5.19 | +1.29 |
| Tallahassee | 2.84 | -0.52 |
| Jacksonville | 5.68 | +2.26 |
| Orlando | 6.37 | +2.35 |
| Tampa | 4.11 | +1.51 |
| Miami | 5.92 | -0.40 |
| Key West | 3.97 | +0.85 |
Figure 1. A graphical depiction of the monthly rainfall departure from normal (inches) for May (courtesy of NOAA, NWS).
El Niño Watch.
A transition from ENSO-neutral to El Niño, the warm phase of the El Niño Southern Oscillation, is expected in the next couple of months. There is a greater than 90% chance of El Niño persisting into the Northern Hemisphere winter. Above-average sea surface temperatures (SSTs) expanded westward to the east-central equatorial Pacific Ocean during April and there are now widespread positive temperature anomalies below the surface of the equatorial Pacific Ocean. At the end of the year (November-January), the range of possibilities includes an 80% chance of at least a moderate El Niño (Niño-3.4 ≥ 1.0°C), about a 55% chance of a strong El Niño (Niño-3.4 ≥ 1.5°C), and a 5-10% chance that El Niño fails to materialize, according to the Climate Prediction Center at NOAA.
Hazardous Weather Events in May.
According to the Local Storm Reports issued by the local National Weather Service offices serving Florida, there were 267 individual local reports of hazardous weather events recorded across the state during the month of May (see Table 4 for a breakdown by event type). As the rainy season begins, reports of heavy rainfall and thunderstorm activity have begun to ramp up. One lightning fatality occurred when a man was struck while on a roof on the 22nd in Volusia County. An injury was reported on the 25th when a short-lived EF0 tornado knocked a semi-tractor on its side, injuring the driver. Several reports of pea to golf ball sized hail were made throughout the month.
Table 3. Breakdown of storm reports submitted in Florida during the month of May (compiled from Iowa State University/Iowa Environmental Mesonet).
| Report Type | Number of Reports |
| Heavy Rain | 36 |
| Flood | 8 |
| Flash Flood | 2 |
| Coastal Flood | 1 |
| Hail | 61 |
| Lightning | 2 |
| Marine Thunderstorm Wind | 16 |
| Non-Thunderstorm Wind Gust | 29 |
| Non-Thunderstorm Wind Damage | 0 |
| Tornado/Waterspout/Funnel Cloud | 1/22/5 |
| Thunderstorm Wind Damage | 36 |
| Thunderstorm Wind Gust | 40 |
| Rip Currents | 1 |
| Wildfire | 7 |
Daily Record Events in May.
Table 4. Summary of daily records broken or set in Florida in May (source: NCEI Daily Weather Records).
| Category | Number of Records |
| Highest daily max. temp. | 15 |
| Highest daily min. temp. | 8 |
| Lowest daily max. temp. | 5 |
| Lowest daily min. temp. | 9 |
| Highest daily precipitation | 20 |
| Total | 57 |
Drought-Related Impacts.
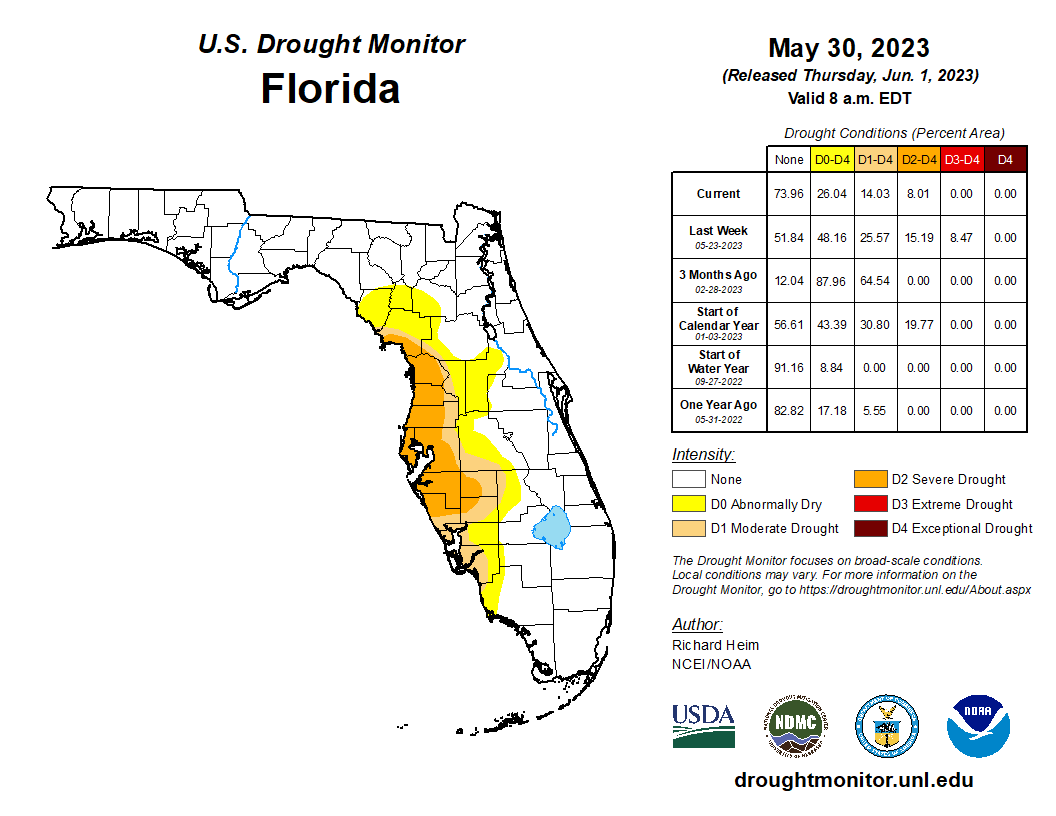
By the middle of May, extreme drought (D3) had expanded across the west-central Florida Peninsula and severe drought (D2) affected much of the Peninsula. About 9% of the state was in extreme drought (D3), 5% was in severe drought (D2), 30% was in moderate drought (D1), and 14% was abnormally dry (D0), according to the U.S. Drought Monitor. By the end of the month, improvement occurred across the state with ample rainfall and extreme drought (D3) was removed along the west coast. As of May 30, 8% of the state was in severe drought (D2), 6% was in moderate drought (D1), and 12% of the state was abnormally dry (D0) (Figure 2).
As of May 31, the Lake Okeechobee water level was 13.85 ft. above sea level (Feet-NGVD29), which is above average for this time of year. At the first of the month, the water level was 14.30 ft. above sea level.
Figure 2. A graphical depiction of the latest drought conditions in Florida according to the U.S. Drought Monitor (courtesy of the National Drought Mitigation Center, University of Nebraska-Lincoln).
Agriculture-Related Impacts.
Much of the Peninsula was in drought during the month, which resulted in increased irrigation throughout the month. Soil moisture remained mixed due to the scattered nature of thunderstorms. In mid-May, topsoil moisture conditions were adequate in 50% of the state, short in 44%, and very short in 5% of the state, while only 1% of the state was experiencing surplus topsoil moisture conditions. By the end of May, topsoil moisture conditions had begun to improve with levels adequate in 69% of the state, short in 20%, and very short in 3% of the state; 8% of the state was in surplus. For more information, consult the Crop Progress and Conditions Report, which is published by the USDA’s National Agricultural Statistics Service.
Appendix 1
Additional May departures from normal data for select Florida locations (Source: NWS).
| Station | Average Temperature (˚F) | Departure from Normal (˚F) | Total Rainfall (in.) | Departure from Normal (in.) |
| Gainesville | 74.6 | -0.4 | 4.11 | +1.03 |
| Sarasota | 78.3 | +0.5 | 2.27 | -0.31 |
| Melbourne | 77.0 | -1.1 | 4.80 | +1.27 |
| Fort Myers | 81.3 | +2.0 | 5.36 | +1.90 |
| West Palm Beach | 79.5 | +0.8 | 5.63 | +0.72 |
Appendix 2
Select daily record high maximum temperatures (°F) broken or tied during May (compiled from NOAA).
| Location | Date | Record | Broken/Tied | Last |
| Miami | 3 | 91 | Broken | 90 in 2016 |
| Bradenton | 6 | 91 | Tied | 91 in 2021 |
| Cross City | 10 | 93 | Tied | 93 in 2017 |
| Lakeland | 10 | 95 | Tied | 95 in 2017 |
| Tallahassee | 10 | 96 | Broken | 95 in 2015 |
| Tampa | 11 | 95 | Broken | 93 in 2018 |
| Fort Myers | 11 | 95 | Tied | 95 in 2012 |
| Tampa | 11 | 94 | Tied | 94 in 2002 |
| Bradenton | 12 | 93 | Broken | 92 in 2015 |
| Pensacola | 14 | 92 | Broken | 91 in 2018 |
| Naples | 15 | 92 | Tied | 92 in 2003 |
| Fort Myers | 15 | 96 | Tied | 96 in 1990 |
| Pensacola | 15 | 94 | Tied | 94 in 1998 |
| Vero Beach | 17 | 95 | Tied | 95 in 1945 |
| Fort Lauderdale | 18 | 90 | Broken | 89 in 2016 |
| Vero Beach | 18 | 93 | Broken | 92 in 2008 |
| Miles City | 19 | 98 | Broken | 97 in 2003 |
| Ochopee | 19 | 94 | Broken | 93 in 2022 |
| Key West | 19 | 91 | Broken | 89 in 2008 |
| Key West | 21 | 91 | Broken | 90 in 1995 |
| Key West | 22 | 92 | Broken | 90 in 1990 |
| Key West | 23 | 90 | Broken | 89 in 2008 |