
Prepared by Florida Climate Center
The Florida State University
Tallahassee, FL

Key Points:
- Hurricane Ian made landfall on the southwest Florida coast at Cayo Costa, a barrier island just west of Fort Myers, as a strong Category 4 hurricane on September 28. Ian caused widespread and devastating impacts to the southwest coast, central, and eastern coastal areas of Florida. (View the special report on Hurricane Ian HERE.)
- Rainfall was variable during the month, with northern areas receiving below normal rainfall and central to southern regions receiving above normal rainfall, with surplus and flooding rainfall observed in areas impacted by Hurricane Ian.
- Monthly mean temperatures were near to above normal across that state in September.
- Dry conditions have set in for the western Panhandle region, where drought is likely to develop during the month of October.
Average temperatures in September were near normal to above normal across the state. Average temperature departures from normal ranged from -0.8 ̊F in Jacksonville to +1.5 ̊F in Orlando for the month (see Table 1 and Appendix 1 for select cities). Southeast Florida was the warmest part of the state in September. Based on monthly average maximum temperatures, Miami had its warmest September on record, and Jacksonville Beach had its 2nd-warmest September on record. Based on monthly mean temperatures, Miami had its 3rd-warmest September on record, and Homestead had its 5th-warmest September on record. Several daily high maximum and high minimum temperature records were set during the month.
Table 1. September average temperatures and departures from normal ( ̊F) for selected cities.
| Station | Mean Temperature | Departure from Normal |
| Pensacola | 80.5 | +0.5 |
| Tallahassee | 79.1 | 0.0 |
| Jacksonville | 78.0 | -0.8 |
| Orlando | 82.5 | +1.5 |
| Tampa | 83.2 | +0.5 |
| Miami | 84.3 | +1.3 |
| Key West | 83.4 | -0.7 |
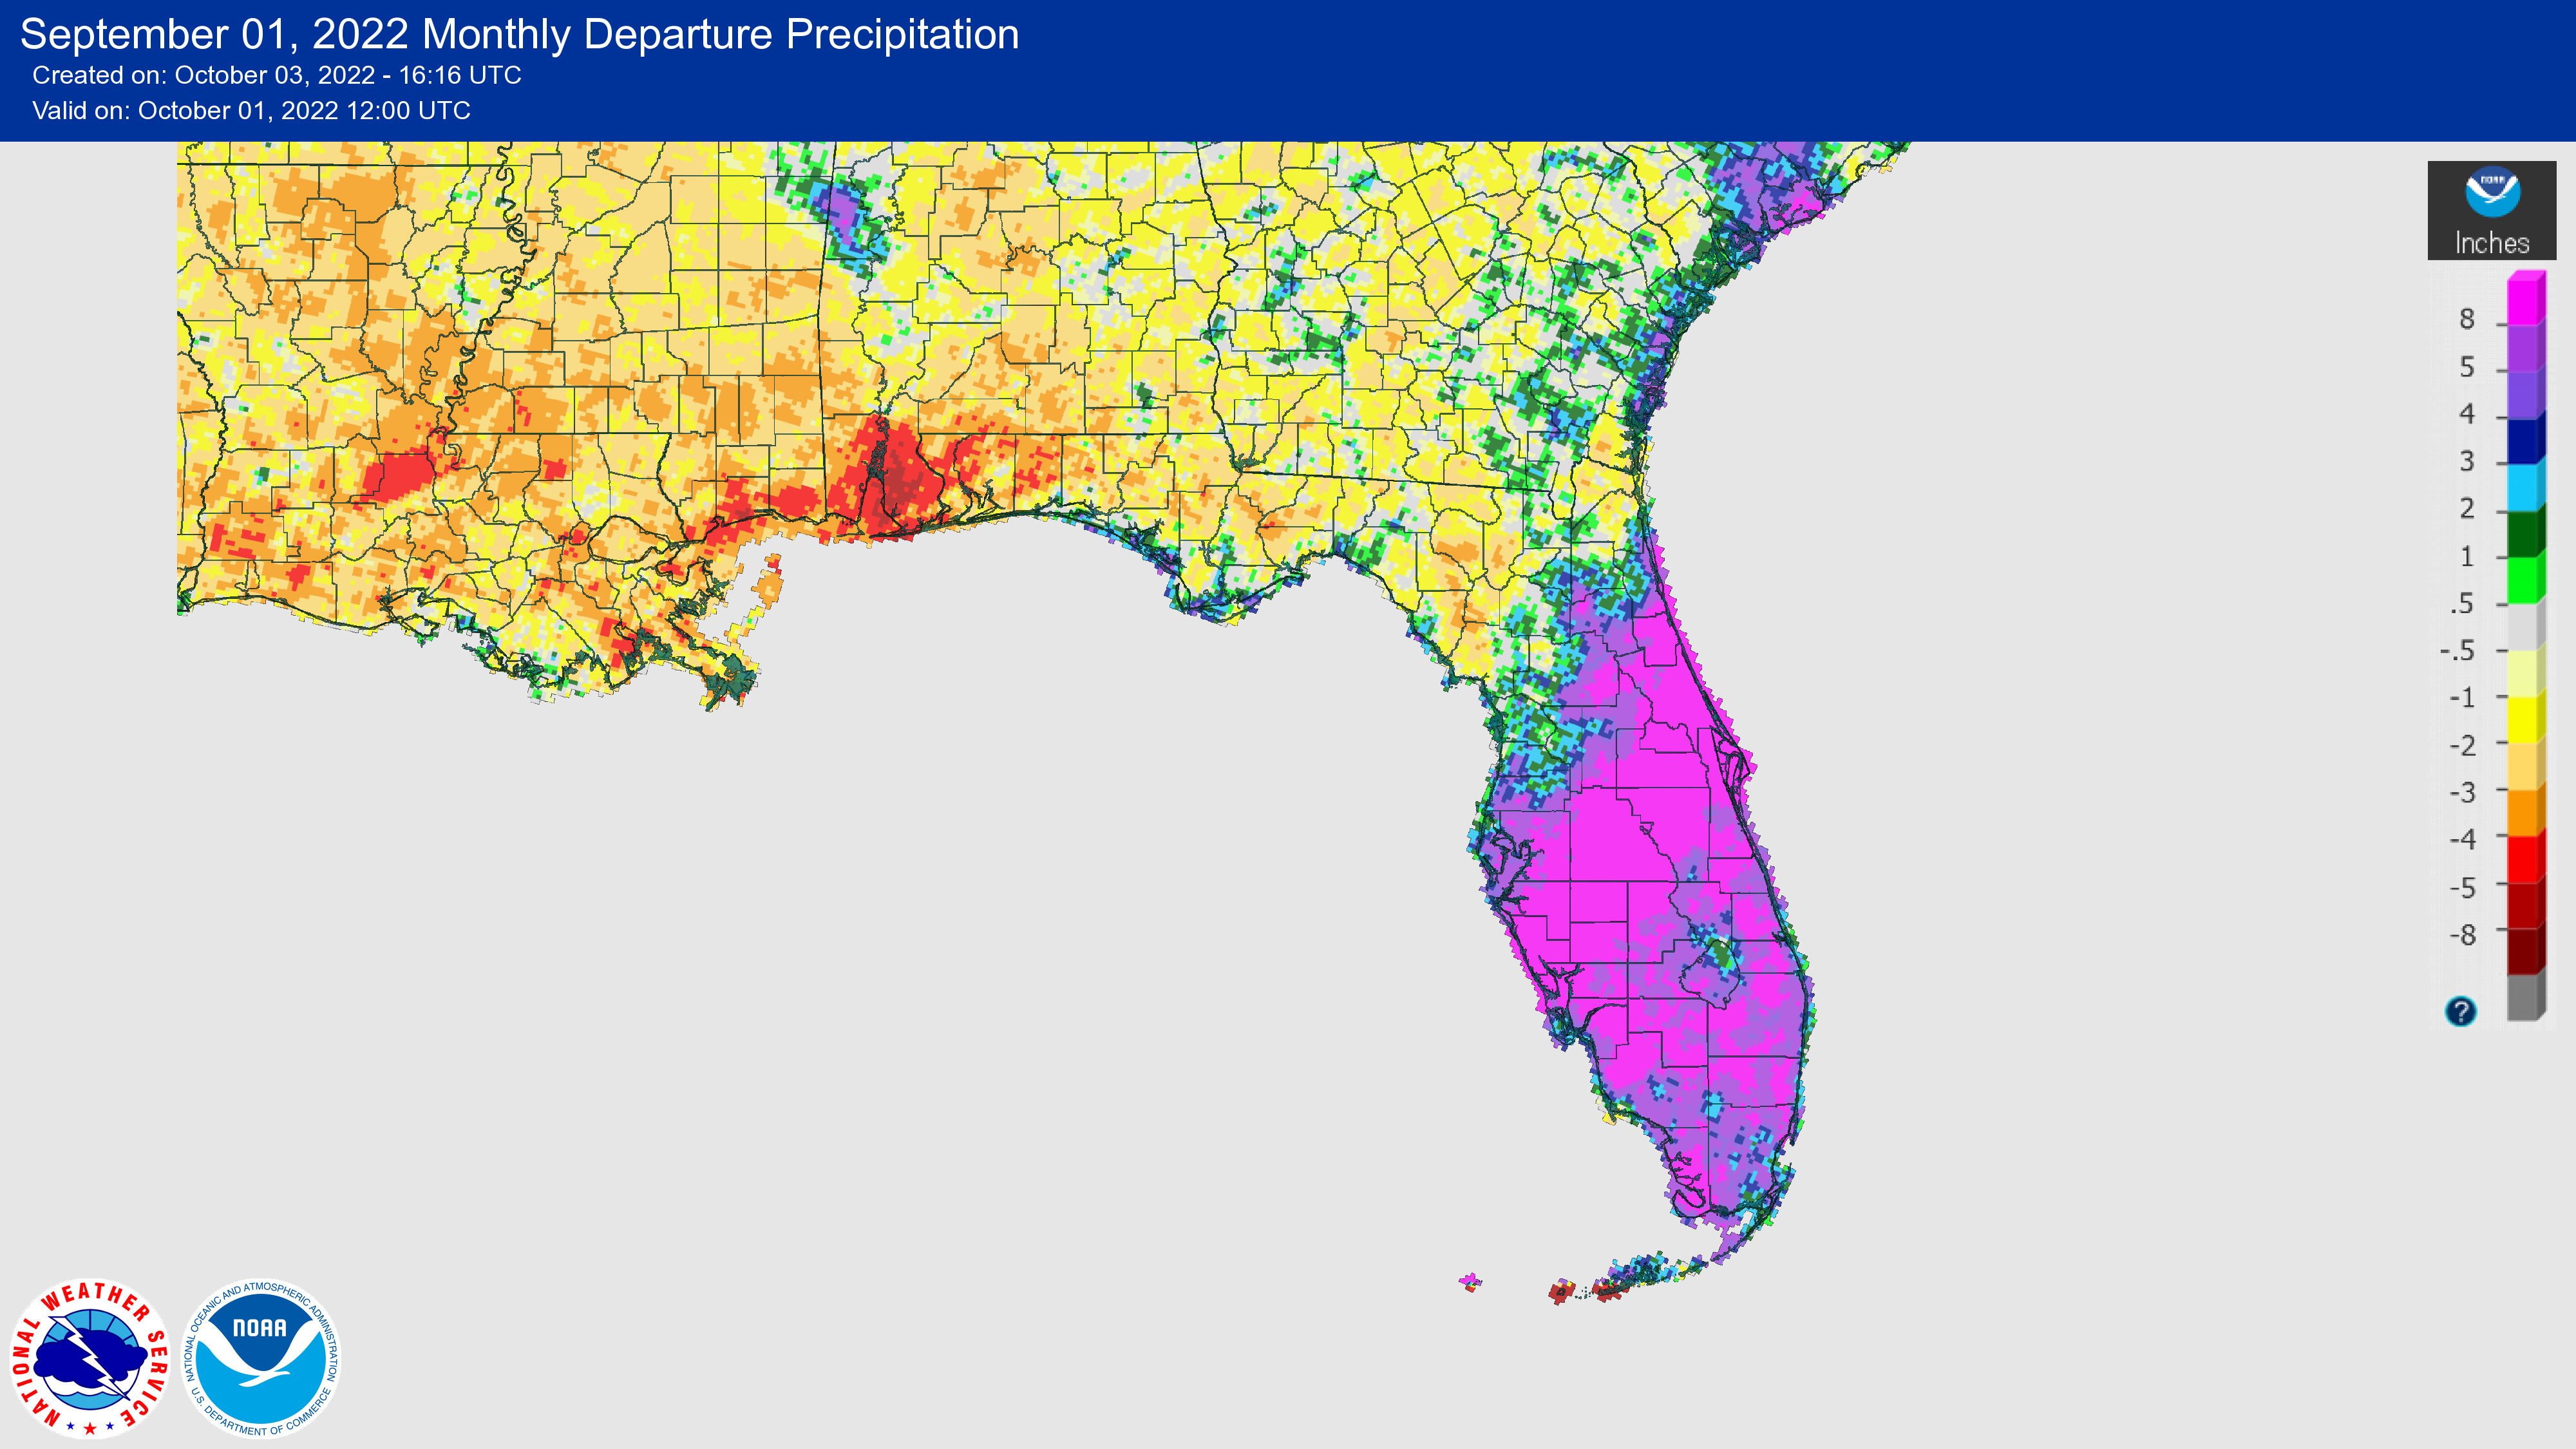
Rainfall totals in September were below normal across north Florida and well above normal in central and south Florida. The monthly precipitation departures from normal ranged from -4.41 inches in Pensacola to +16.05 inches in Orlando (see Table 2 and Appendix 1 for more locations). During the early to middle part of the month, areas of south-central and central Florida had received above normal rainfall for the month, while north Florida and much of southeast Florida had received below normal rainfall for the month. In late September, Hurricane Ian’s extensive rainfall across much of southwest, central, and eastern Florida made a large impact on monthly rainfall. The storm even reversed year-to-date rainfall deficits previously seen in Orlando and Miami, which went from a deficit of 5.2 inches each to a surplus of 10.8 inches and 2.7 inches, respectively. The storm resulted in it being the wettest September on record for Orlando, Sanford, Daytona Beach, and the 2nd wettest September on record at Kissimmee. Key West had its 5th-wettest September on record. Storm rainfall totals are shown in Appendix 2. Many daily rainfall records were also broken during the month (Appendix 3).
Table 2. September precipitation totals and departures from normal (inches) for selected cities.
| Station | Total Rainfall | Departure from Normal |
| Pensacola | 2.20 | -4.41 |
| Tallahassee | 2.25 | -2.66 |
| Jacksonville | 5.53 | -2.03 |
| Orlando | 22.42 | +16.05 |
| Tampa | 11.90 | +5.81 |
| Miami | 12.15 | +1.93 |
| Key West | 12.06 | +4.82 |
Figure 1. A graphical depiction of the monthly rainfall departure from normal (inches) for September (courtesy of NOAA, NWS).
La Niña Advisory.
La Niña is expected to continue through the winter, with a 91% chance in September-November, decreasing to a 54% chance in January-March 2023. Below average sea surface temperatures remained in the eastern Pacific Ocean throughout the month, and overall the coupled ocean-atmosphere system continued to reflect La Niña. Looking ahead, the dynamical versus statistical model forecasts are split, with the latter suggesting La Niña will last longer through the January-March 2023 timeframe, but large uncertainty exists over how long it will last and when it will transition to ENSO-neutral (56% chance during February-April 2023).
Hazardous Weather Events in September.
According to the Local Storm Reports issued by the local National Weather Service offices serving Florida, there were 685 individual local reports of hazardous weather events recorded across the state during the month of September (see Table 4 for a breakdown by event type). From early to mid-month, several areas saw thunderstorms with heavy rainfall and wind gusts reaching over 40 mph. On September 1, a wind gust of 62 mph was reported at the Orlando Executive Airport, which caused two small private aircraft to overturn leading to one fatality and one injury. Parts of Lake and Seminole Counties saw heavy rainfall on the 9th of between 4.15 and 4.53 inches that day. Between 7.0 and 8.8 inches of rain was reported in Bay and Walton Counties on the 11th with some reports of flooding. Another round of heavy rain was reported in Volusia and Brevard Counties on the 15th, with between 3.46 and 8.47 inches of rain causing some flooding on roadways. On the same day, flooding and water rescues from partially submerged vehicles were reported in Manatee County.
Hurricane Ian made landfall in Southwest Florida at the end of the month on September 28 near Cayo Costa, a barrier island just west of Fort Myers, as a strong Category 4 hurricane. Ian’s outer rain bands began to affect the Florida Keys and south Florida as early as September 26 with strong wind and heavy rain as it approached Florida from the south and southwest. Ian’s expansive rain bands also produced multiple tornadoes reported in Monroe, Broward, Miami-Dade, Palm Beach, and Brevard Counties. Reports of storm surge and flooding began in Monroe and Collier Counties on the 28th. Storm surge and winds over 100 mph began around 2:45 pm on the 28th, around the time of landfall. Multiple storm surge reports of 3-4 feet and as high as first story roofs or first level parking garages were made in and around Naples to Fort Myers Beach on the 28th. A report from North Naples stated that they went from “dry to 5 feet of surge in 20 minutes.” Official high-water marks and peak surge levels from Ian have yet to be released. Flooding from heavy rainfall and storm surge also impacted central and eastern Florida on the 29th, with some of the hardest impacted areas located in Osceola, Orange, and Seminole Counties and also from Volusia up through Nassau Counties along the eastern coastline. In addition, several critical facilities were impacted by storm surge and flooding, including fire stations and healthcare facilities.
Table 4. Breakdown of storm reports submitted in Florida during the month of September (compiled from Iowa State University/Iowa Environmental Mesonet).
| Report Type | Number of Reports |
| Flash Flood | 34 |
| Heavy Rain | 69 |
| Flood | 27 |
| Coastal Flood | 7 |
| Lightning | 5 |
| Hail | 2 |
| Marine Thunderstorm Wind | 36 |
| Non-Thunderstorm Wind Gust | 17 |
| Non-Thunderstorm Wind Damage | 1 |
| Tornado/Waterspout/Funnel Cloud | 13/19/10 |
| Thunderstorm Wind Damage | 23 |
| Thunderstorm Wind Gust | 68 |
| Wildfire | 2 |
| High Surf | 2 |
| Storm Surge | 38 |
| Tropical Storm | 269 |
| Hurricane | 43 |
Daily Record Events in September.
Table 5.Summary of daily records broken or set in Florida in September (source: NCEI Daily Weather Records).
| Category | Number of Records |
| Highest daily max. temp. | 45 |
| Highest daily min. temp. | 19 |
| Lowest daily max. temp. | 25 |
| Lowest daily min. temp. | 8 |
| Highest daily precipitation | 44 |
| Total | 141 |
Weather/Climate Highlight of the Month: Hurricane Ian
Hurricane Ian was a large category 4 storm that brought wide-ranging impacts to much of the state, including the south, central, and eastern regions of Florida, with high winds, powerful storm surge, and heavy rain. Ian underwent rapid intensification, developing from a category 1 into a category 4 storm with maximum sustained winds of 155 mph in less than a day as it approached Florida, making it just shy of a category 5 hurricane (157+ mph). At landfall, its maximum sustained winds were 150 mph. Based on wind speed, Ian ranks in a 3-way tie for 4th strongest storm to ever make landfall in Florida, tied with Hurricane Charley in 2004 and the Florida Keys hurricane of 1919. The top 3 strongest storms that have made landfall in Florida were the 1935 Labor Day Hurricane at 185 mph, Hurricane Andrew in 1992 at 165 mph, and Hurricane Michael in 2018 at 160 mph. These three storms are also the only category 5 hurricanes on record to strike Florida.
Drought-Related Impacts.
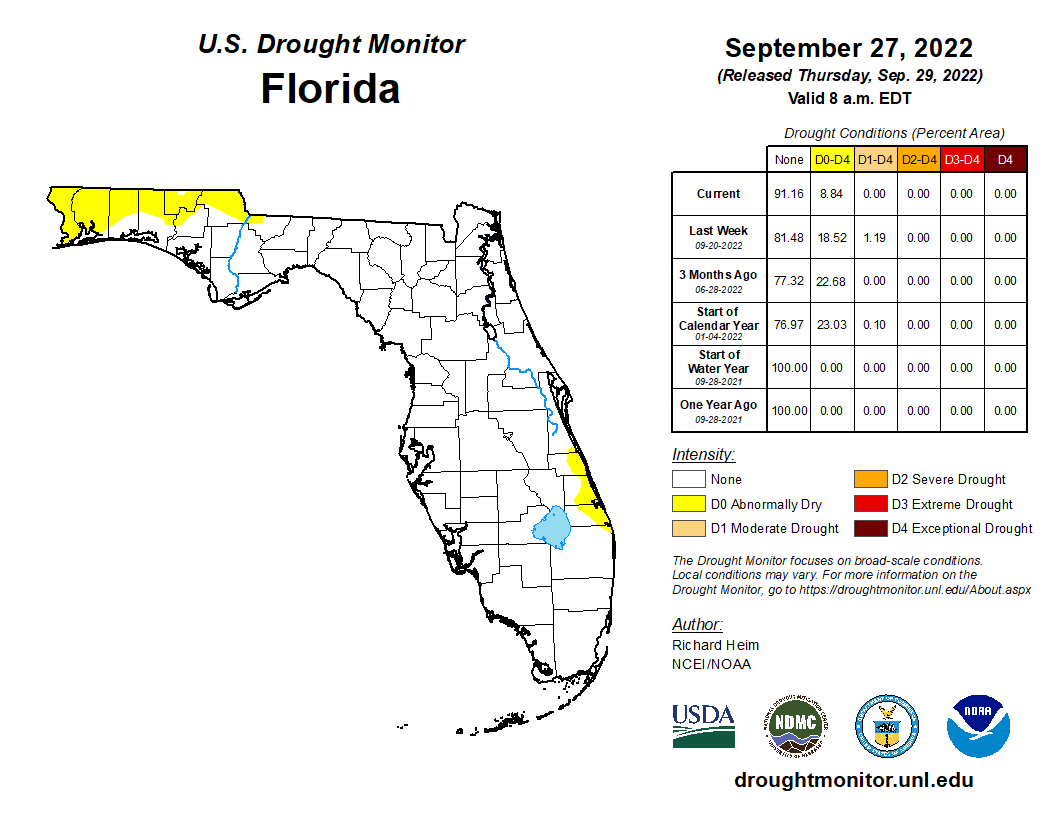
At the beginning of September, much of Southeast Florida was experiencing abnormally dry conditions (D0) and eastern coastal areas were in moderate drought (D1). As of September 6, about 2.55% of the state was in moderate drought (D1) and 17.95% was abnormally dry, according to the U.S. Drought Monitor. As of September 27, drought had disappeared and abnormally dry conditions emerged in the western Panhandle, with about 9% of the state being abnormally dry (Figure 2 below).
As of September 30, the Lake Okeechobee water level was 13.76 ft. above sea level (Feet-NGVD29), which is above average for this time of the year. The water level rose above water shortage management levels mid to late in the month. At the first of the month, the water level was 12.56 ft. above sea level.
Figure 2. A graphical depiction of the current drought conditions in Florida according to the U.S. Drought Monitor (courtesy of the National Drought Mitigation Center, University of Nebraska-Lincoln).
Agriculture-Related Impacts.
In mid-September, topsoil moisture conditions were adequate in 81% of the state, short in 8%, and very short in 0% of the state, while 11% of the state was in surplus. Near the end of September, topsoil moisture levels were adequate in 69% of the state, short in 17%, and very short in 2% of the state; 12% of the state was in surplus. Rainfall during the month and from Hurricane Ian will likely have impacts to citrus, vegetables, and other crops, but official assessments have yet to be made. For more information, consult the Crop Progress and Conditions report, which is published by the USDA's National Agricultural Statistics Service.
Appendix 1
Additional September departures from normal data for select Florida locations (Source: NWS).
| Station | Average Temperature (˚F) | Departure from Normal (˚F) | Total Rainfall (in.) | Departure from Normal (in.) |
| Gainesville | 78.4 | 0.0 | 3.76 | -1.29 |
| Sarasota | 80.4 | -1.8 | 14.54 | +8.54 |
| Melbourne | 80.8 | -1.3 | 15.51 | +7.88 |
| Fort Myers | 83.6 | +1.4 | 13.92 | +4.92 |
| West Palm Beach | 82.7 | +0.8 | 11.86 | +3.90 |
Appendix 2
Hurricane Ian daily rainfall totals, in inches, from September 27 - 30 for select locations; an “M” denotes missing data. Rainfall is generally reported for the proceeding 24 hours ending at 7:00 am each day (sources: NWS Coop, CoCoRaHS).
| Station | Rainfall reported on 9/27 | Rainfall reported on 9/28 | Rainfall reported on 9/29 | Rainfall reported on 9/30 | Total Rainfall from 9/27-9/30 |
| Marco Island | 0.59 | 2.04 | 1.35 | 0.00 | 3.98 |
| Port Charlotte | 1.53 | 3.15 | 14.72 | 0.00 | 19.40 |
| Nokomis | 0.12 | 2.95 | 14.20 | 0.00 | 17.27 |
| Lake Suzy | 0.16 | 3.63 | 11.71 | 0.00 | 15.50 |
| Venice | 0.66 | 3.35 | 0.00 | 0.00 | 4.01 |
| Bradenton | 0.46 | 7.09 | 1.20 | M | 8.75 |
| Frostproof | 2.84 | 1.61 | 12.00 | 0.05 | 16.50 |
| Desoto City | M | 2.72 | 4.48 | M | 7.20 |
| Orlando | 0.09 | 7.72 | 5.39 | 0.00 | 13.20 |
| Sanford | 0.00 | 0.35 | 11.20 | 2.12 | 13.67 |
| Daytona Beach | 0.00 | 1.97 | 4.80 | 14.72 | 21.49 |
| Kissimmee | 0.60 | 0.55 | 13.60 | 0.27 | 15.02 |
| Titusville | 0.17 | 7.81 | 4.30 | M | 12.28 |
| Oviedo | 0.00 | 1.30 | 13.66 | 0.84 | 15.80 |
| New Smyrna Beach | 0.00 | 0.55 | 15.12 | 5.42 | 21.09 |
| Edgewater | 0.00 | 0.26 | 16.27 | 2.49 | 19.02 |
| Flagler Beach | 0.00 | 0.17 | 3.26 | 1.00 | 4.79 |
| St. Augustine | 0.00 | 1.78 | 4.62 | 0.0001 | 6.40 |
| Hastings | 0.00 | 0.14 | 5.06 | 2.68 | 7.88 |
Appendix 3
Select daily record high precipitation values broken during September (compiled from NOAA).
| Location | Date | Record (in.) | Broken/Tied | Last |
| Cross City | 1 | 2.82 | Broken | 2.65 in 1985 |
| Tampa | 1 | 2.74 | Broken | 2.22 in 2021 |
| Bartow | 2 | 5.12 | Broken | 2.72 in 1893 |
| Fort Myers | 7 | 3.12 | Broken | 3.03 in 1955 |
| Key West | 7 | 2.16 | Broken | 1.75 in 2007 |
| Naples | 9 | 2.00 | Broken | 1.70 in 1989 |
| Panama City | 12 | 2.70 | Broken | 2.30 in 2015 |
| Miami | 14 | 2.61 | Broken | 1.79 in 1993 |
| Melbourne | 18 | 3.48 | Broken | 2.30 in 1956 |
| Kissimmee | 21 | 2.12 | Broken | 1.67 in 1948 |
| Key West | 26 | 3.08 | Broken | 1.99 in 1968 |
| Key West | 27 | 4.18 | Broken | 3.70 in 1987 |
| Miami | 27 | 3.54 | Broken | 3.07 in 2005 |
| Fort Lauderdale | 28 | 4.10 | Broken | 3.33 in 1943 |
| Naples | 28 | 2.70 | Broken | 1.73 in 2001 |
| Stuart | 28 | 3.51 | Broken | 3.00 in 1992 |
| Vero Beach | 28 | 3.95 | Broken | 2.78 in 1992 |
| Orlando | 28 | 7.72 | Broken | 2.66 in 2010 |
| Daytona Beach AP | 28 | 5.22 | Broken | 3.79 in 1995 |
| Fort Myers | 28 | 2.46 | Broken | 2.12 in 1929 |
| Daytona Beach | 29 | 4.80 | Broken | 2.48 in 1938 |
| Hastings | 29 | 5.06 | Broken | 1.03 in 1979 |
| Plant City | 29 | 4.76 | Broken | 3.69 in 1949 |
| Sanford | 29 | 11.20 | Broken | 2.05 in 2012 |
| Orlando | 29 | 5.39 | Broken | 1.84 in 2014 |
| Daytona Beach AP | 29 | 7.91 | Broken | 2.17 in 1979 |