
Prepared by Florida Climate Center
The Florida State University
Tallahassee, FL

Key Points:
- A warm and wet pattern emerged for much of the state in March, with above normal rainfall for the northern half of the state, alleviating drought in some locations, but the south continued to have below normal rainfall.
- An active storm pattern returned across the south and southeast U.S., which included a wildfire outbreak early in the month in the Florida Panhandle and a severe weather outbreak late in the month.
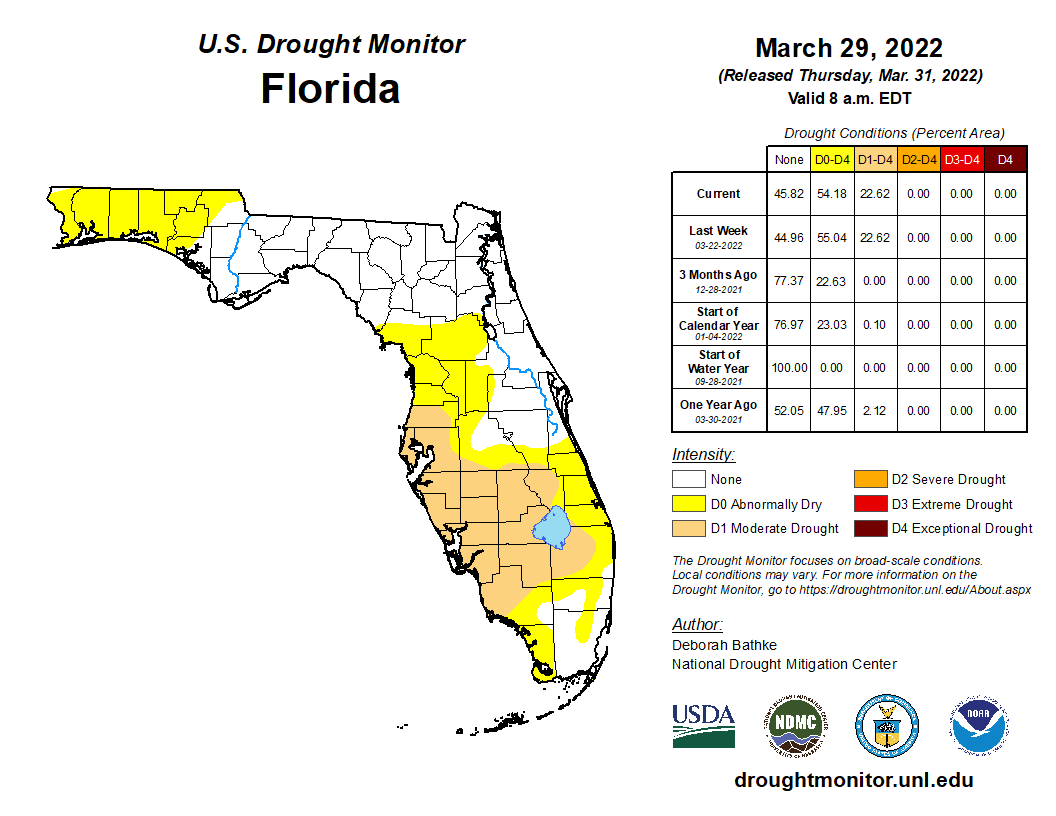
- During the first week of March, moderate drought (D1) impacted much of Florida, including the Panhandle and western Peninsula, with severe drought (D2) emerging in Dixie and Levy counties. By the end of March, drought had improved across the Panhandle and Big Bend regions as rainfall returned, but much of south Florida continues to experience moderate drought or abnormally dry conditions.
- A La Niña advisory is expected the continue through summer, but its influence may begin to wane, as the precipitation outlook through the summer calls for equal chances below, above, or near normal in Florida
Average temperatures in March were above normal across the state. Average temperature departures from normal ranged from +1.9 ̊F in Tallahassee to +5.5 ̊F in Fort Myers for the month (see Table 1 and Appendix 1 for select cities). Several stations recorded one of their top five warmest months of March on record. Fort Myers recorded its warmest March on record, while Orlando, Tampa, and Jacksonville Beach had their 3rd-warmest March on record. Several daily high maximum and high minimum temperature records were tied or broken throughout the month (see appendix 2 for daily high maximum temperature records).
Table 1. March average temperatures and departures from normal ( ̊F) for selected cities.
| Station | Mean Temperature | Departure from Normal |
| Pensacola | 65.1 | +2.8 |
| Tallahassee | 63.3 | +1.9 |
| Jacksonville | 64.5 | +2.1 |
| Orlando | 72.5 | +5.2 |
| Tampa | 73.9 | +5.3 |
| Miami | 76.2 | +3.1 |
| Key West | 76.5 | +2.1 |
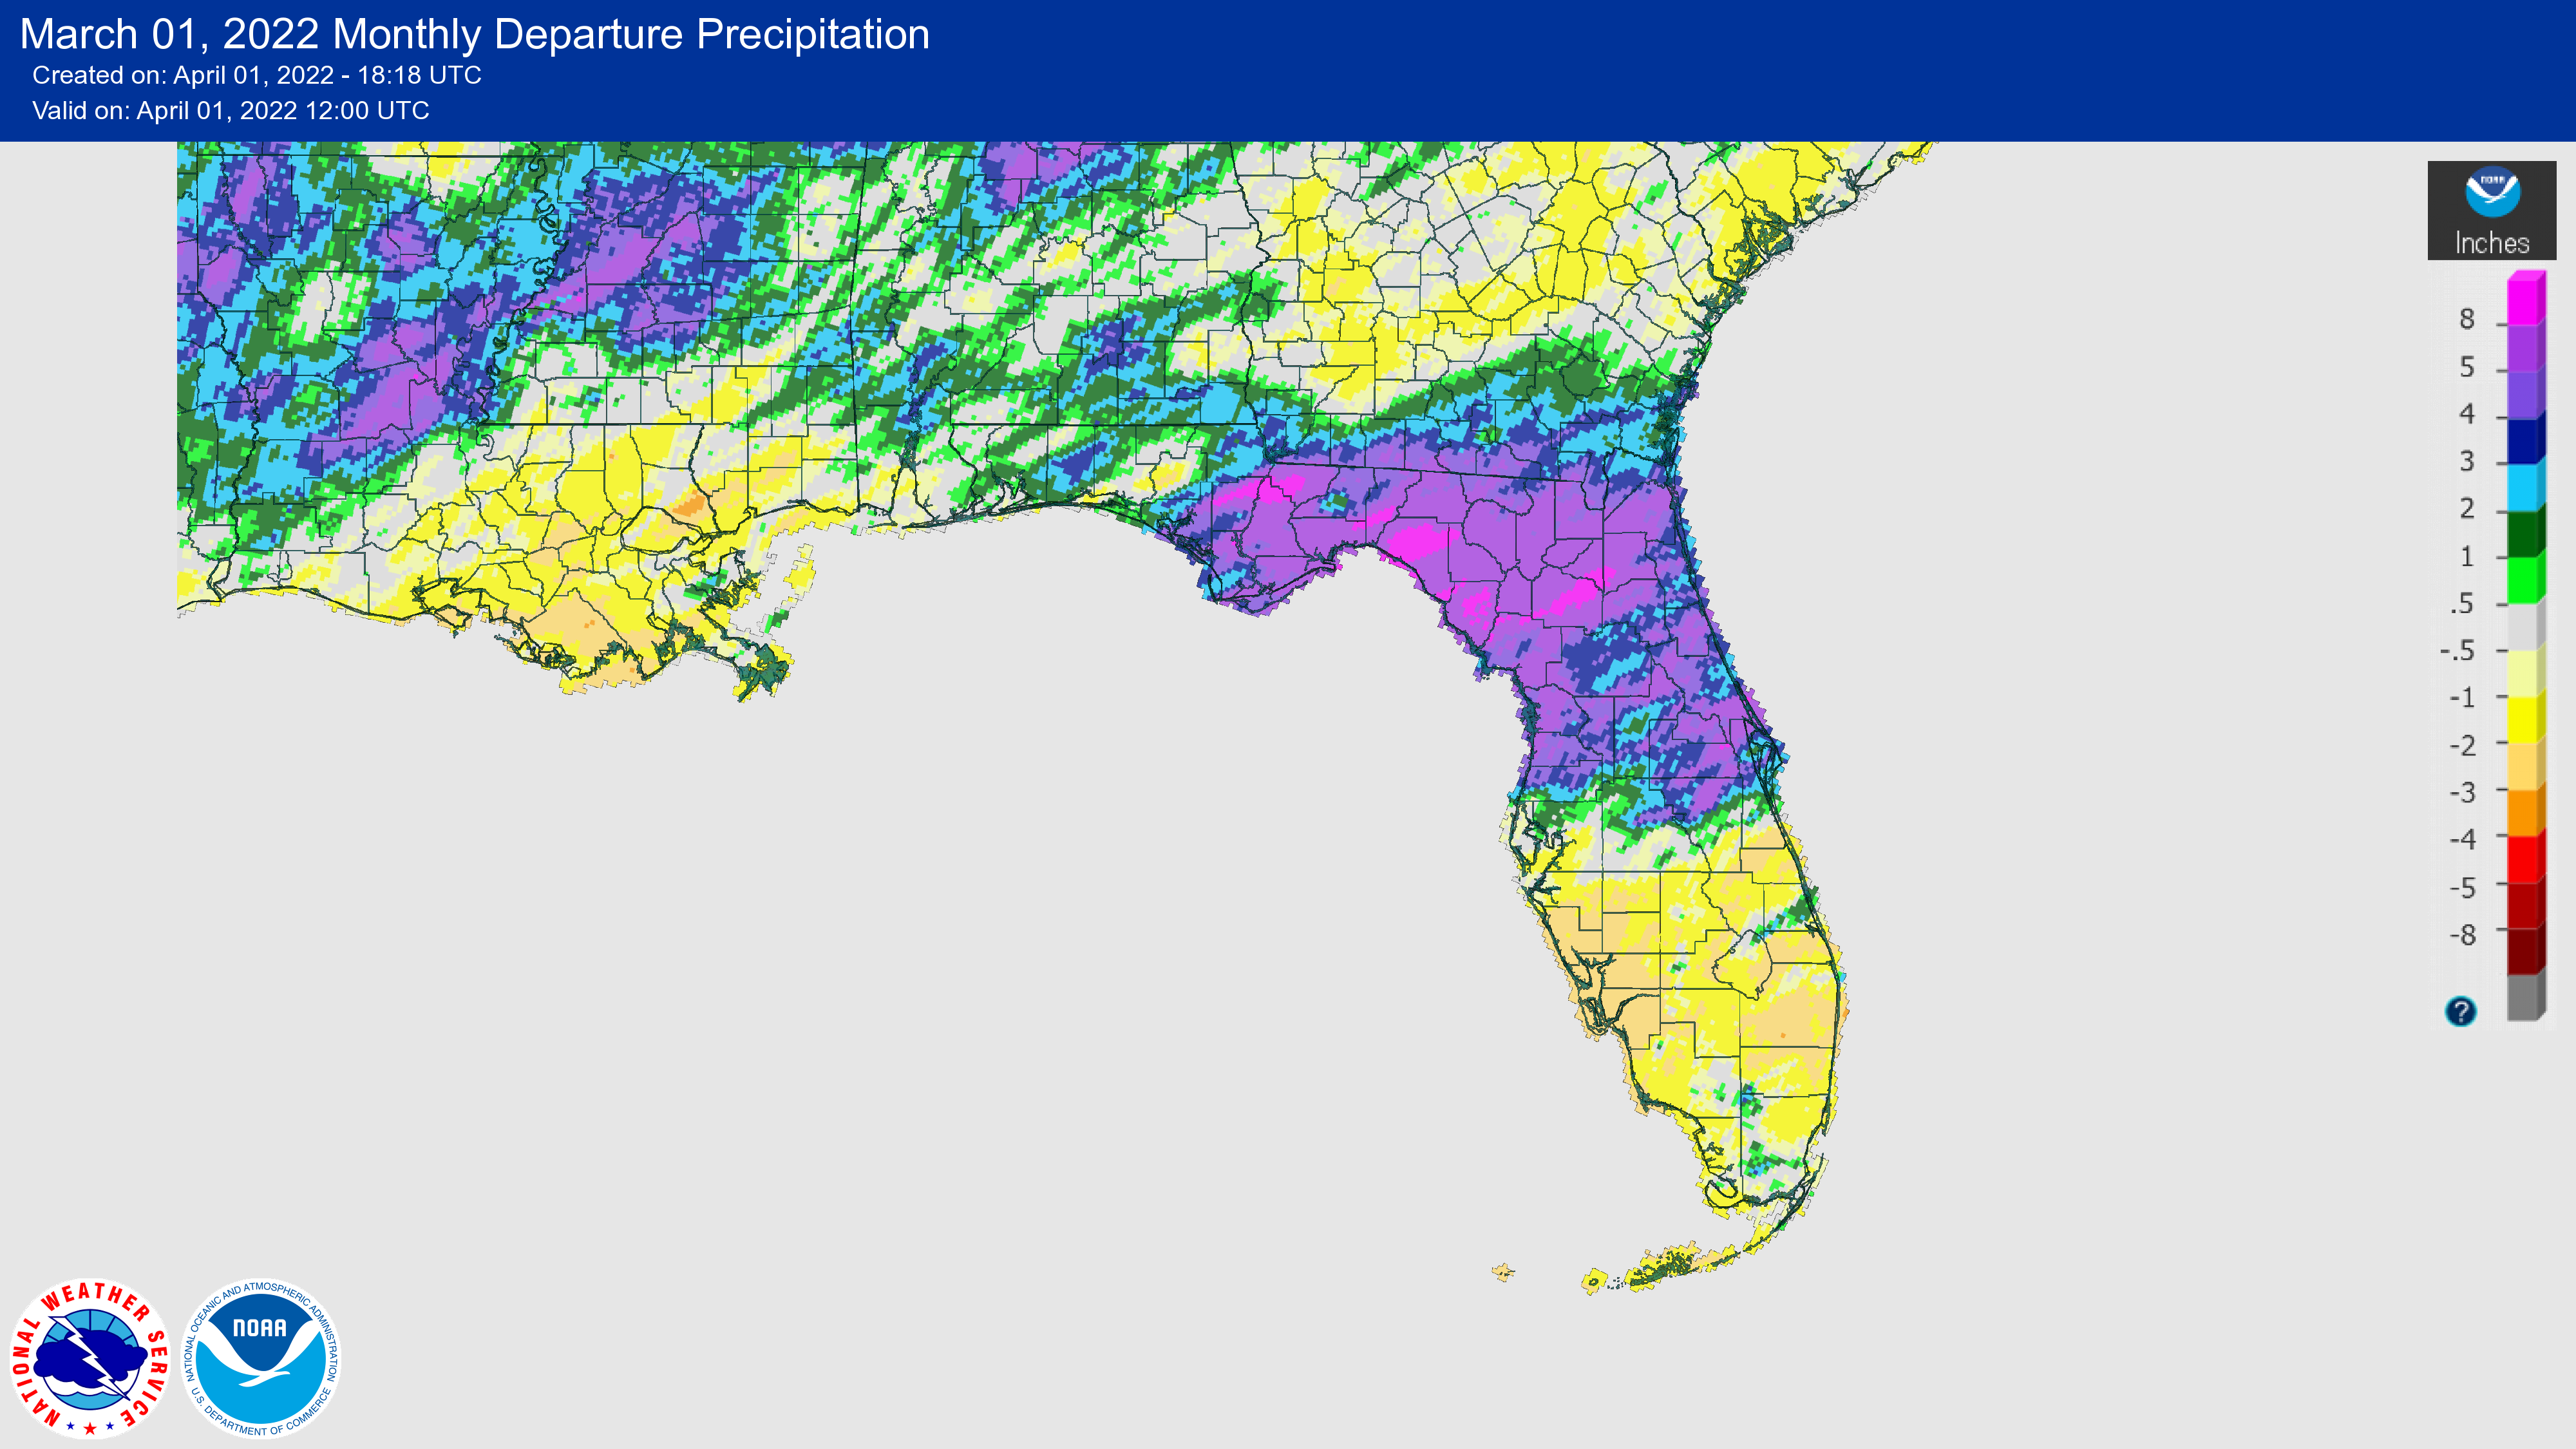
Rainfall totals in March were above normal for most places in the northern half of the state and below normal in the south. The monthly precipitation departures from normal ranged from -0.97 inches in Key West to +9.1 inches in Gainesville (Table 2 and Appendix 1). Most southerly locations in the state recorded a precipitation deficit for the month, but some places especially in north-central Florida saw a surplus of rainfall (Figure 1). Gainesville and Cross City recorded their wettest March on record, while Fort Lauderdale had its 7th-driest March on record. As a result of continued dryness, moderate drought and abnormally dry conditions continue to impact much of the southern Peninsula (see below).
Table 2. March precipitation totals and departures from normal (inches) for selected cities.
| Station | Total Rainfall | Departure from Normal |
| Pensacola | 6.09 | +0.84 |
| Tallahassee | 9.05 | +3.81 |
| Jacksonville | 9.95 | +6.66 |
| Orlando | 5.76 | +2.73 |
| Tampa | 2.91 | +0.39 |
| Miami | 2.03 | -0.43 |
| Key West | 0.56 | -0.97 |
Figure 1. A graphical depiction of the monthly rainfall departure from normal (inches) for March (courtesy of NOAA, NWS).
La Niña Advisory Continues.
La Niña, the cool phase of the ENSO climate pattern, is favored to continue into the Northern Hemisphere summer (53% chance during June-August), with a 40-50% chance of La Niña or ENSO-neutral thereafter. After weakening in January, below-average sea surface temperatures strengthened during February 2022 across the central and east-central tropical Pacific as the weekly Niño-3.4 index decreased from -0.6 ̊ C in early February to -1.1 ̊ C in the last week of February.
Hazardous Weather Events in March.
According to the Local Storm Reports issued by the local National Weather Service offices serving Florida, there were 483 individual local reports of hazardous weather events recorded across the state during the month of March 2022 (see Table 4 for a breakdown by event type). Early in the month, wildfires broke out across the Panhandle as below-normal rainfall and warm weather led to the development of abnormally dry and moderate drought conditions. Another factor contributing to this wildfire outbreak was the unusual amount of fuel on the ground as a result of Hurricane Michael nearly four years ago, which decimated forests on private land in this area. Wildfires threatened several communities and led to the evacuation of a community and nursing home in Bay County. On the 31st, a tornado in Washington County, Florida resulted in two fatalities and two injuries, part of a severe weather outbreak across 7 states that generated at least 30 tornadoes in total.
Table 4. Breakdown of storm reports submitted in Florida during the month of March (compiled from Iowa State University/Iowa Environmental Mesonet).
| Report Type | Number of Reports |
| Flash Flood | 18 |
| Heavy Rain | 29 |
| Flood | 8 |
| Hail | 38 |
| Lightning | 1 |
| Marine Thunderstorm Wind | 51 |
| Non-Thunderstorm Wind Gust | 131 |
| Non-Thunderstorm Wind Damage | 11 |
| Tornado/Waterspout/Funnel Cloud | 20/5/2 |
| Thunderstorm Wind Damage | 71 |
| Thunderstorm Wind Gust | 91 |
| Wildfire | 7 |
Drought-Related Impacts.
During the first week of March, much of Florida was experiencing drought. About 2% of the state was in severe drought (D2), 50% of the state was in moderate drought (D1), and 36% was experiencing abnormally dry conditions, according to the U.S. Drought Monitor. Conditions improved in northern Florida throughout the month as a wet pattern emerged. By the end of the month, no areas were in severe drought (D2), 23% of the state (southwestern Florida) was in moderate drought (D1), and 32% was abnormally dry.
As of March 31, the Lake Okeechobee water level was 13.78 ft. above sea level (Feet-NGVD29), which is below average for this time of the year. The water level fell below average early in the month and continued to decline. At the first of the month, the water level was around 14.52 ft. above sea level.
Agriculture-Related Impacts.
While temperatures were above normal for the month of March, a mid-month frost led to some damage to crops including to berries, watermelon, and planted corn in the northern part of the state. Pasture conditions were poor to good throughout the state due to late cool weather and frost. Cattle remained in mostly good condition due to supplemental hay feeding. Sugarcane harvest was close to completion in the southern part of the Peninsula. Strawberry harvest continued and should conclude soon. Several vegetable crops were marketed including tomatoes, peppers, eggplant, sweet corn, green beans, yellow squash, zucchini, herbs, and avocadoes. Citrus fruit harvested included white and red grapefruit, oranges, tangerines, and tangelos. For more information, consult the Crop Progress - State Stories reports, which is produced monthly December through March.
Appendix 1
Additional March departures from normal data for select Florida locations (Source: NWS).
| Station | Average Temperature (˚F) | Departure from Normal (˚F) | Total Rainfall (in.) | Departure from Normal (in.) |
| Gainesville | 66.1 | +3.4 | 12.59 | +9.10 |
| Sarasota | 71.7 | +3.6 | 2.51 | -0.34 |
| Melbourne | 71.8 | +3.2 | 5.09 | +2.40 |
| Fort Myers | 75.8 | +5.5 | 0.43 | -1.64 |
| West Palm Beach | 75.2 | +4.1 | 2.69 | -0.62 |
Appendix 2
Select daily record high maximum temperatures broken or tied during March (compiled from NOAA).
| Location | Date | Record (˚F) | Broken/Tied | Last |
| Key West | 3 | 93 | Broken | 85 in 2019 |
| Tampa | 4 | 89 | Broken | 88 in 1961 |
| Crestview | 4 | 86 | Broken | 83 in 1951 |
| Tarpon Springs | 5 | 88 | Broken | 87 in 1997 |
| Fort Myers | 5 | 90 | Tied | 90 in 1961 |
| Jacksonville Beach | 6 | 89 | Broken | 88 in 1945 |
| Live Oak | 6 | 88 | Broken | 86 in 2003 |
| Panama City | 6 | 81 | Broken | 80 in 2004 |
| Venice | 6 | 89 | Broken | 86 in 2003 |
| Tampa | 6 | 89 | Broken | 86 in 1983 |
| Key West | 6 | 87 | Broken | 84 in 2015 |
| Bradenton | 7 | 87 | Broken | 86 in 1985 |
| Cross City | 7 | 86 | Broken | 85 in 1961 |
| Usher Tower | 7 | 88 | Tied | 88 in 1974 |
| Gainesville | 7 | 87 | Broken | 86 in 1961 |
| Tampa | 7 | 88 | Broken | 86 in 1995 |
| Key West | 7 | 88 | Broken | 85 in 2008 |
| Clermont | 8 | 90 | Broken | 87 in 2003 |
| Hastings | 8 | 87 | Broken | 84 in 1996 |
| Kissimmee | 8 | 88 | Broken | 87 in 2003 |
| Orlando | 8 | 89 | Broken | 87 in 1991 |
| Key West | 8 | 89 | Broken | 88 in 1967 |
| Fort Lauderdale Beach | 9 | 85 | Broken | 84 in 2003 |
| Jacksonville Beach | 9 | 86 | Broken | 84 in 1951 |
| Gainesville | 9 | 85 | Tied | 85 in 2019 |
| Key West | 9 | 88 | Broken | 85 in 2003 |
| Daytona Beach | 10 | 85 | Broken | 83 in 1964 |
| Hastings | 10 | 85 | Broken | 83 in 2000 |
| Jacksonville Beach | 10 | 86 | Broken | 83 in 1993 |
| Perrine | 11 | 89 | Broken | 87 in 2017 |
| Plant City | 11 | 91 | Broken | 90 in 2019 |
| Key West | 11 | 89 | Broken | 86 in 2019 |
| Miami | 12 | 90 | Broken | 87 in 2014 |
| Key West | 12 | 90 | Broken | 87 in 1968 |
| Perrine | 13 | 89 | Broken | 87 in 2019 |
| Key West | 17 | 89 | Broken | 87 in 1975 |
| Bradenton | 18 | 89 | Broken | 87 in 2020 |
| Plant City | 18 | 94 | Broken | 92 in 1945 |
| Orlando | 18 | 91 | Broken | 90 in 1982 |
| Key West | 18 | 89 | Broken | 86 in 2003 |
| Lakeland | 18 | 91 | Broken | 89 in 1963 |
| Clermont | 19 | 94 | Broken | 91 in 2020 |
| Key West | 19 | 89 | Broken | 86 in 2020 |
| Ochopee | 20 | 91 | Broken | 89 in 2003 |
| Key West | 21 | 89 | Broken | 85 in 2020 |
| Venice | 22 | 88 | Broken | 87 in 2012 |
| Tampa | 22 | 88 | Broken | 86 in 2020 |
| Key West | 22 | 93 | Broken | 87 in 1977 |
| Key West | 23 | 92 | Broken | 85 in 2020 |
| Naples | 25 | 88 | Tied | 88 in 1975 |
| Fort Myers | 29 | 91 | Tied | 91 in 2020 |
| Key West | 30 | 90 | Broken | 87 in 1991 |