
Prepared by Florida Climate Center
The Florida State University
Tallahassee, FL

October Key Points:
- Average temperatures during October were above normal for much of the state.
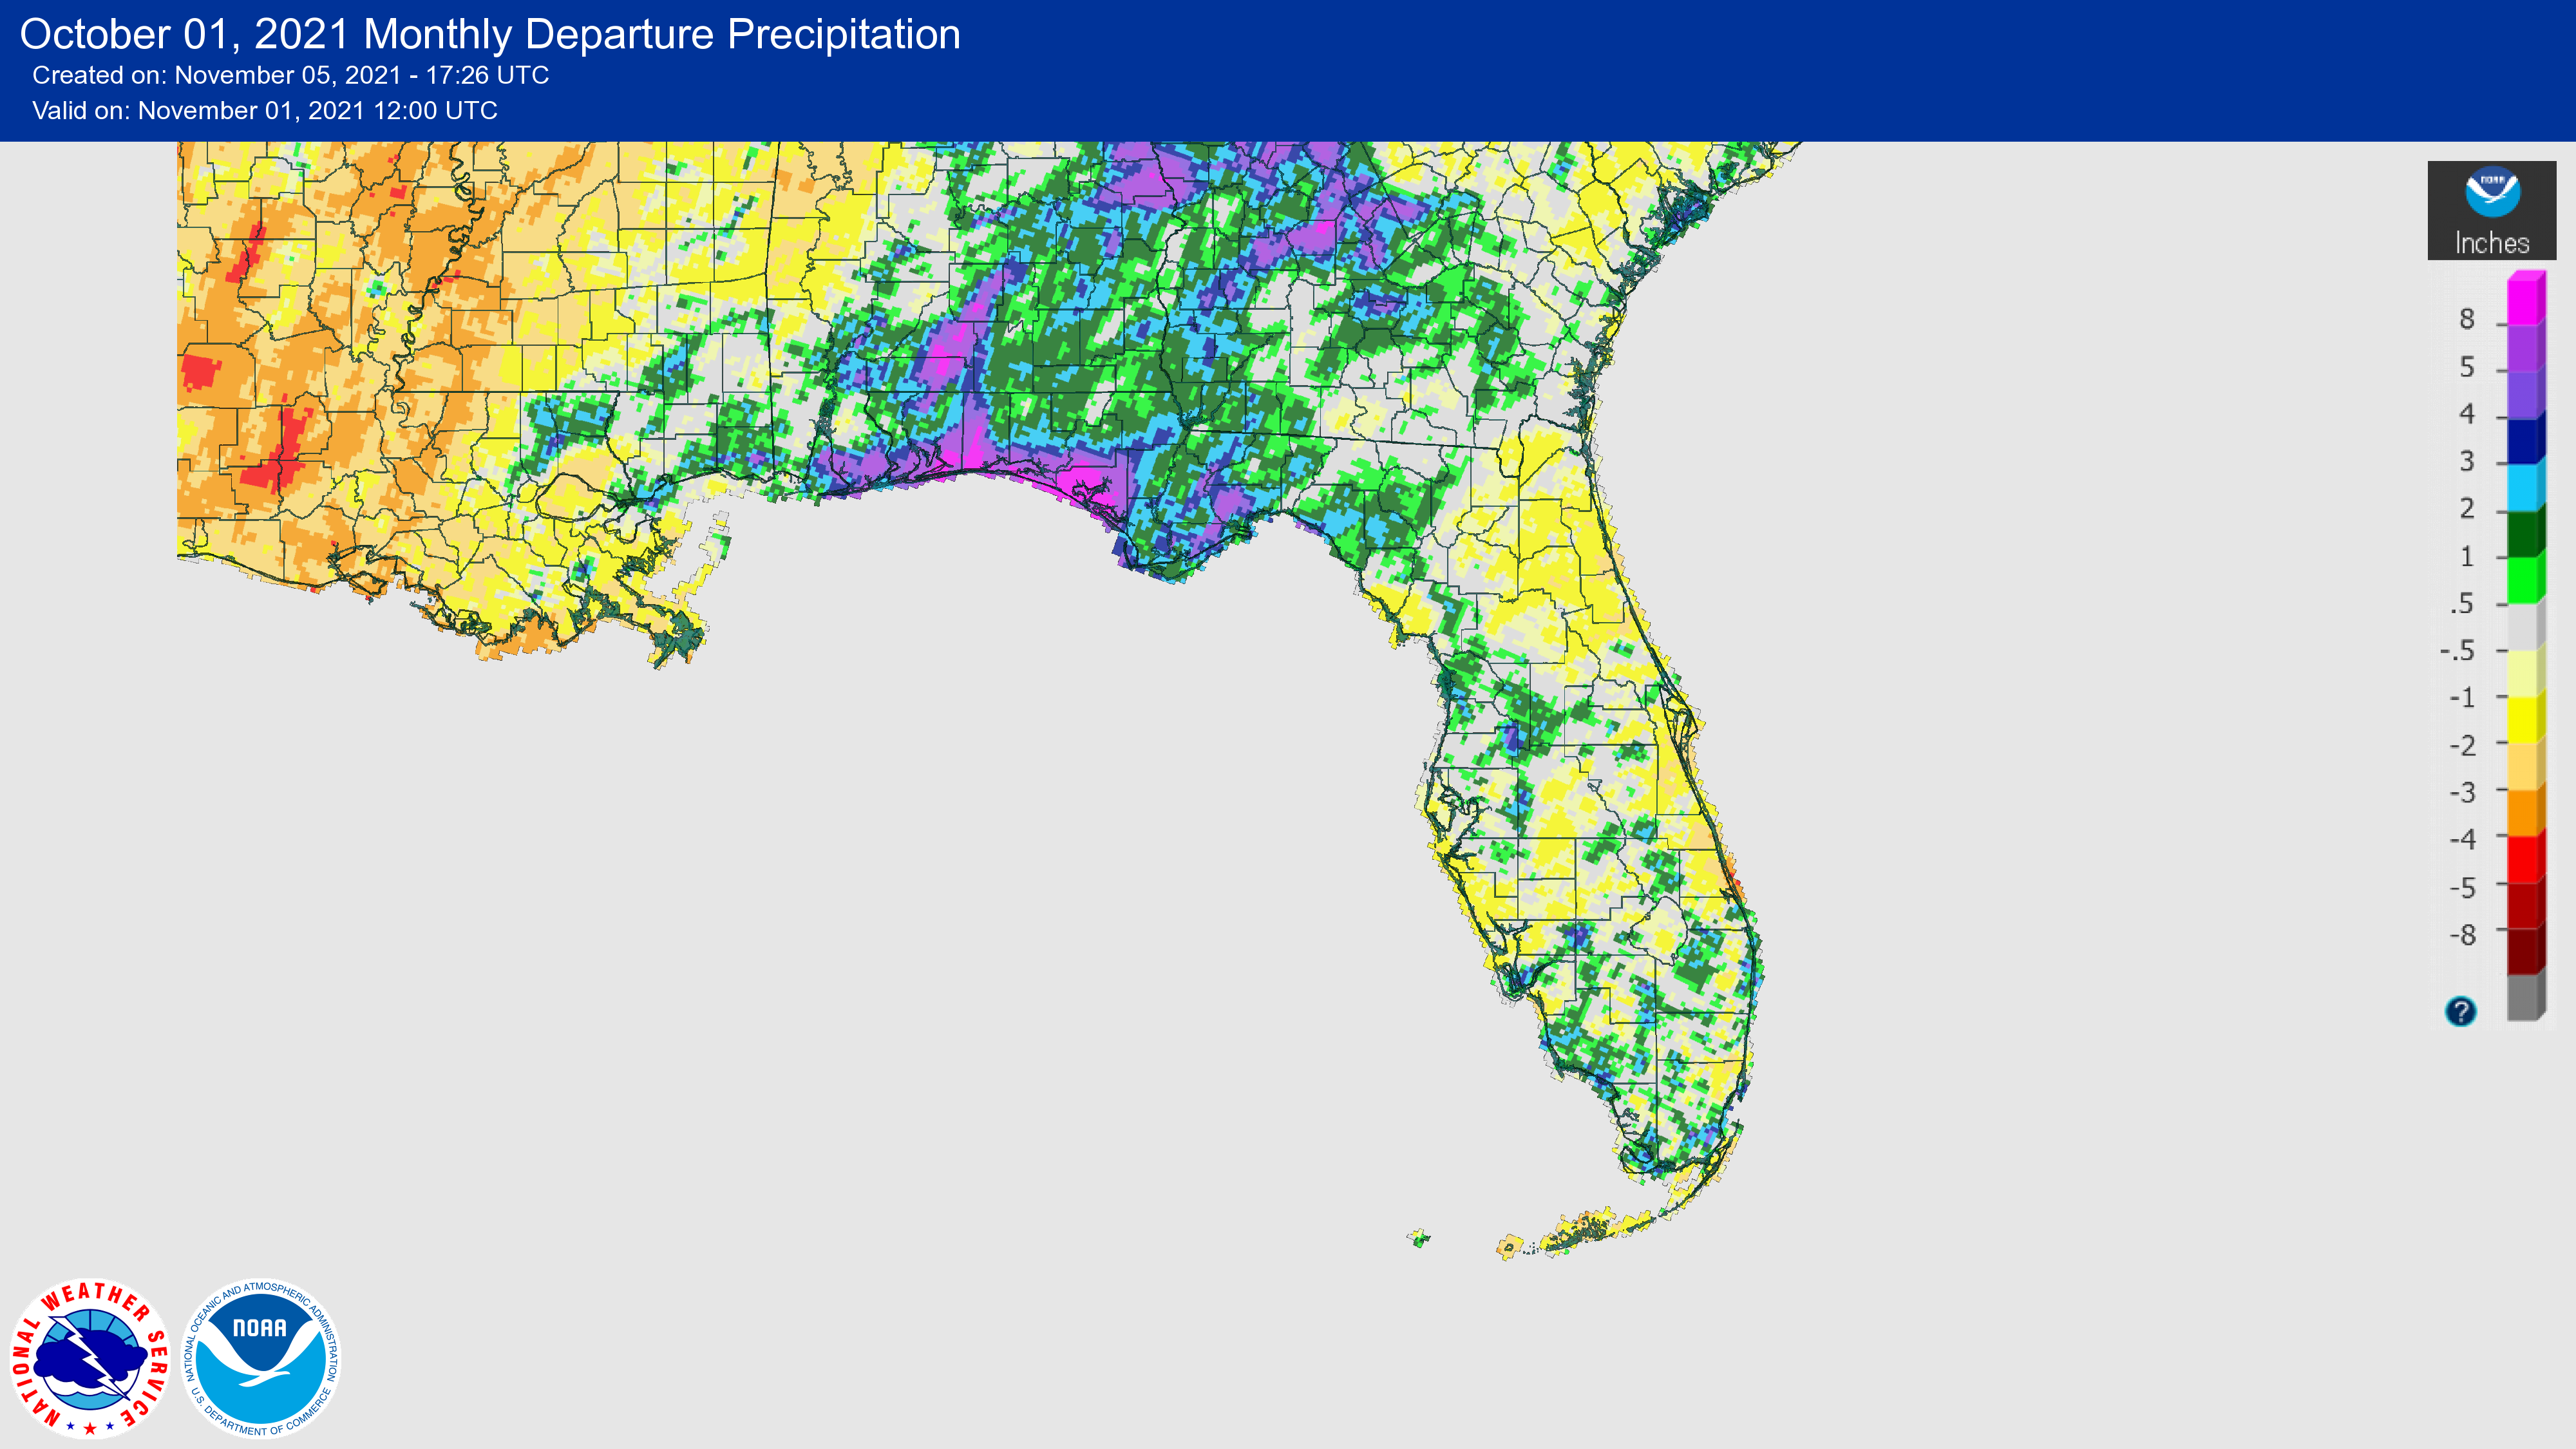
- The Florida Panhandle experienced above normal rainfall totals, while the rest of the state experienced below normal rainfall for the month.
- La Niña conditions have returned with an 87% chance of continuing through February.
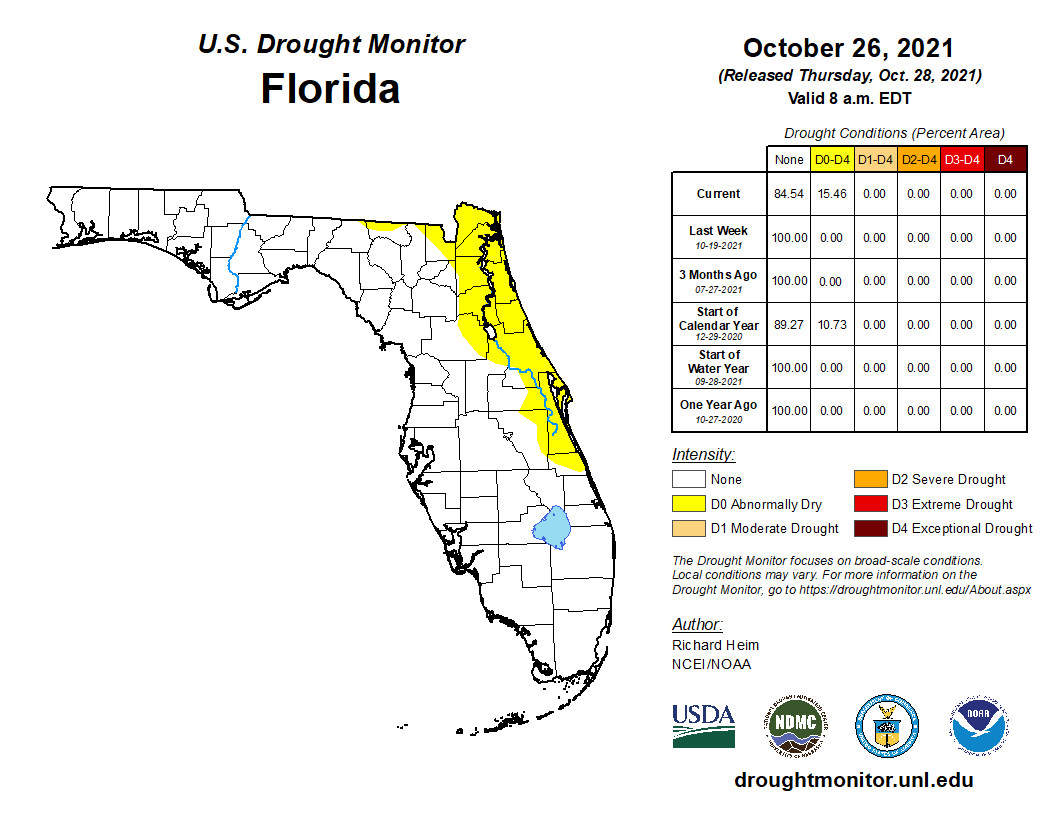
- Abnormally dry conditions emerged over eastern-northeastern parts of Florida late in the month.
- Red tide (Karenia Brevis) affected the estuaries of the Apalachicola River and the Florida Panhandle.
Average temperatures in October were above normal across the state. Average temperature departures ranged from +0.6 ̊F in Key West and Jacksonville to +3.3 ̊F in Orlando for the month (see Table 1 and Appendix 1 for select cities). Tampa, Fort Myers, and Jacksonville Beach had their third warmest Octobers on record, while Orlando had its fourth warmest October on record. Several daily high maximum temperature records were set, and many daily high minimum temperature records were set during the month (see Appendix 2).
Table 1. October average temperatures and departures from normal ( ̊F) for selected cities.
| Station | Mean Temperature | Departure from Normal |
| Pensacola | 73.4 | +2.1 |
| Tallahassee | 71.5 | +1.2 |
| Jacksonville | 71.8 | +0.6 |
| Orlando | 78.8 | +3.3 |
| Tampa | 80.4 | +3.0 |
| Miami | 81.2 | +1.1 |
| Key West | 81.9 | +0.6 |
Rainfall totals in October were above normal in the Panhandle and northern regions but below normal for much of the rest of the state (Figure 1). Monthly departures from normal ranged from +4.66 inches in Pensacola to -4.71 inches in Key West (Table 2 and Appendix 1). Monthly departures from normal ranged from +8.58 inches in Pensacola to -2.74 inches in Miami (Table 2 and Appendix 1). The western Panhandle region continues to be wetter than normal, with a surplus in annual rainfall at Pensacola of just over 28 inches above normal for the year to date. Pensacola had its fifth wettest October on record (seventh for the area overall), and Lakeland also had its fifth wettest October on record.
Table 2. October precipitation totals and departures from normal (inches) for selected cities.
| Station | Total Rainfall | Departure from Normal |
| Pensacola | 13.28 | +8.58 |
| Tallahassee | 5.29 | +2.05 |
| Jacksonville | 4.15 | +0.12 |
| Orlando | 3.21 | -0.25 |
| Tampa | 1.35 | -0.99 |
| Miami | 4.91 | -2.74 |
| Key West | 3.27 | -2.40 |
Figure 1. A graphical depiction of the monthly rainfall departure from normal (inches) for October (courtesy of NOAA, NWS).
La Niña Advisory.
La Niña conditions, the cool phase of the ENSO climate pattern, returned to the tropical Pacific Ocean in October. Below-average subsurface temperatures (averaged from 180-100°W) strengthened significantly over the past month, as negative anomalies were observed at depth across most of the central and eastern Pacific Ocean. There is an 87% chance of La Niña conditions continuing in the Northern Hemisphere winter from December 2021 – February 2022. At its peak, a moderate-strength La Niña is favored. ENSO-neutral conditions are predicted to return during March-May 2022.
Hazardous Weather Events in October.
According to the Local Storm Reports issued by the local National Weather Service offices serving Florida, there were 201 individual local reports of hazardous weather events recorded across the state during the month of October (see Table 4 for a breakdown by event type). Early in the month, on October 7th, coastal areas of Bay County received daily rainfall amounts of between 3.55 and 8.67 inches of rainfall with reports of heavy rain and flash flooding. Despite reports of flooding, strong wind gusts, and two tornadoes throughout the month, no injuries or fatalities were reported.
Table 4. Breakdown of storm reports submitted in Florida during the month of October (compiled from Iowa State University/Iowa Environmental Mesonet).
| Report Type | Number of Reports |
| Flood | 7 |
| Flash Flood | 37 |
| Hail | 0 |
| Heavy Rain | 18 |
| Marine Thunderstorm Wind | 44 |
| Non-Thunderstorm Wind Gust | 36 |
| Non-Thunderstorm Wind Damage | 1 |
| Tornado/Waterspout/Funnel Cloud | 2/14/4 |
| Thunderstorm Wind Damage | 6 |
| Thunderstorm Wind Gust | 29 |
| Lightning | 1 |
| High Sustained Winds | 2 |
Drought-Related Impacts.
Much of the month of October remained drought free across the state; however, abnormally dry conditions emerged toward the end of the month across eastern and northern parts of the state. As of October 26, 15.5% of the state was experiencing abnormally dry conditions (D0), according to the U.S. Drought Monitor.
As of October 31, the Lake Okeechobee water level was at 15.87 ft. above sea level (Feet-NGVD29), which is above the average for this time of the year. The water level remained above average throughout the month. At the first of the month, the water level was 15.57 ft. above sea level.
Agriculture-Related Impacts.
During mid-October, topsoil moisture levels were adequate for 65% of the state, short in 11%, and very shot in 1% of the state; 23% of the state was in surplus. By the end of October, topsoil moisture levels were adequate in 65% of the state, short in 18%, and very short in 1%; 16% of the state was in surplus. Much of the state had either fair (27%), good (47%) or excellent (23%) pasture and range conditions by the end of the month. For more information, consult the weekly Crop Progress and Conditions report published by the USDA's National Agricultural Statistics Service.
Appendix 1
Additional October departures from normal data for select Florida locations (Source: NWS).
| Station | Average Temperature (˚F) | Departure from Normal (˚F) | Total Rainfall (in.) | Departure from Normal (in.) |
| Gainesville | 72.6 | +1.2 | 1.84 | -0.84 |
| Sarasota | 79.0 | +1.7 | 1.03 | -1.73 |
| Melbourne | 77.6 | +0.1 | 2.72 | -2.14 |
| Fort Myers | 81.2 | +3.2 | 3.19 | +0.11 |
| West Palm Beach | 80.3 | +1.6 | 9.02 | +3.12 |
Appendix 2
Select daily record high minimum temperatures tied or broken during October (compiled from NOAA).
| Location | Date | Record (˚F) | Broken/Tied | Last |
| Vero Beach | 1 | 80 | Broken | 79 in 2019 |
| Fort Lauderdale Beach | 3 | 80 | Tied | 80 in 2019 |
| Key West | 3 | 82 | Tied | 82 in 1991 |
| Jacksonville Beach | 6 | 80 | Broken | 78 in 2019 |
| Tampa | 6 | 79 | Tied | 79 in 2009 |
| Key West | 6 | 83 | Broken | 82 in 2019 |
| Key West | 7 | 85 | Broken | 83 in 2009 |
| Bradenton | 8 | 77 | Tied | 77 in 2005 |
| Key West | 8 | 84 | Broken | 82 in 2017 |
| Fort Myers | 15 | 75 | Tied | 75 in 2018 |
| Jacksonville Beach | 16 | 84 | Broken | 78 in 2019 |
| Vero Beach | 21 | 77 | Tied | 77 in 2017 |
| Bradenton | 24 | 74 | Broken | 72 in 2020 |
| Jacksonville Beach | 24 | 76 | Broken | 74 in 1984 |
| Orlando | 24 | 73 | Broken | 72 in 2019 |
| Fort Myers | 24 | 76 | Broken | 75 in 2019 |
| Orlando | 24 | 72 | Broken | 71 in 2020 |
| Bradenton | 25 | 75 | Tied | 75 in 2019 |
| Punta Gorda | 25 | 75 | Tied | 75 in 2001 |
| Miles City | 25 | 75 | Broken | 74 in 2020 |
| Gainesville | 25 | 72 | Broken | 69 in 2019 |
| Fort Myers | 25 | 77 | Broken | 76 in 2019 |
| Orlando | 25 | 75 | Broken | 74 in 2020 |
| Jacksonville | 25 | 73 | Broken | 72 in 2020 |
| Punta Gorda | 26 | 75 | Broken | 74 in 2020 |
| Venice | 26 | 77 | Broken | 74 in 2019 |
| Ochopee | 26 | 77 | Broken | 75 in 2019 |
| Key West | 26 | 80 | Broken | 79 in 2020 |
| Ochopee | 29 | 76 | Broken | 75 in 2019 |
| Fort Myers | 29 | 76 | Broken | 75 in 2019 |