
Prepared by Florida Climate Center
The Florida State University
Tallahassee, FL

July Key Points:
- Average temperatures were mixed but near normal for the month.
- Rainfall totals in July were mixed, but most places received above-normal rainfall.
- Drought is not currently impacting the state.
- Abnormally dry conditions (D0) persist in some places in South Florida, but moderate drought has dissipated with the onset of the wet season.
- Hurricane Elsa impacted Florida July 5-7; it was the first hurricane of the 2021 season and became the earliest forming fifth named storm on record in the Atlantic Basin
Average temperature departures in July were mixed but temperatures were near normal across the state. Average temperature departures ranged from -1.4 ̊F in Key West to +0.8 ̊F in Fort Myers for the month (see Table 1 and Appendix 1 for select cities). There were some daily high maximum temperature records set during July, but many more daily high minimum temperature records were set during the month (see Appendix 2).
Table 1. July average temperatures and departures from normal ( ̊F) for selected cities.
| Station | Mean Temperature | Departure from Normal |
| Pensacola | 83.3 | -0.2 |
| Tallahassee | 82.1 | -0.4 |
| Jacksonville | 81.1 | -1.4 |
| Orlando | 83.3 | +0.7 |
| Tampa | 85.0 | +1.2 |
| Miami | 83.7 | -0.4 |
| Key West | 84.0 | -1.4 |
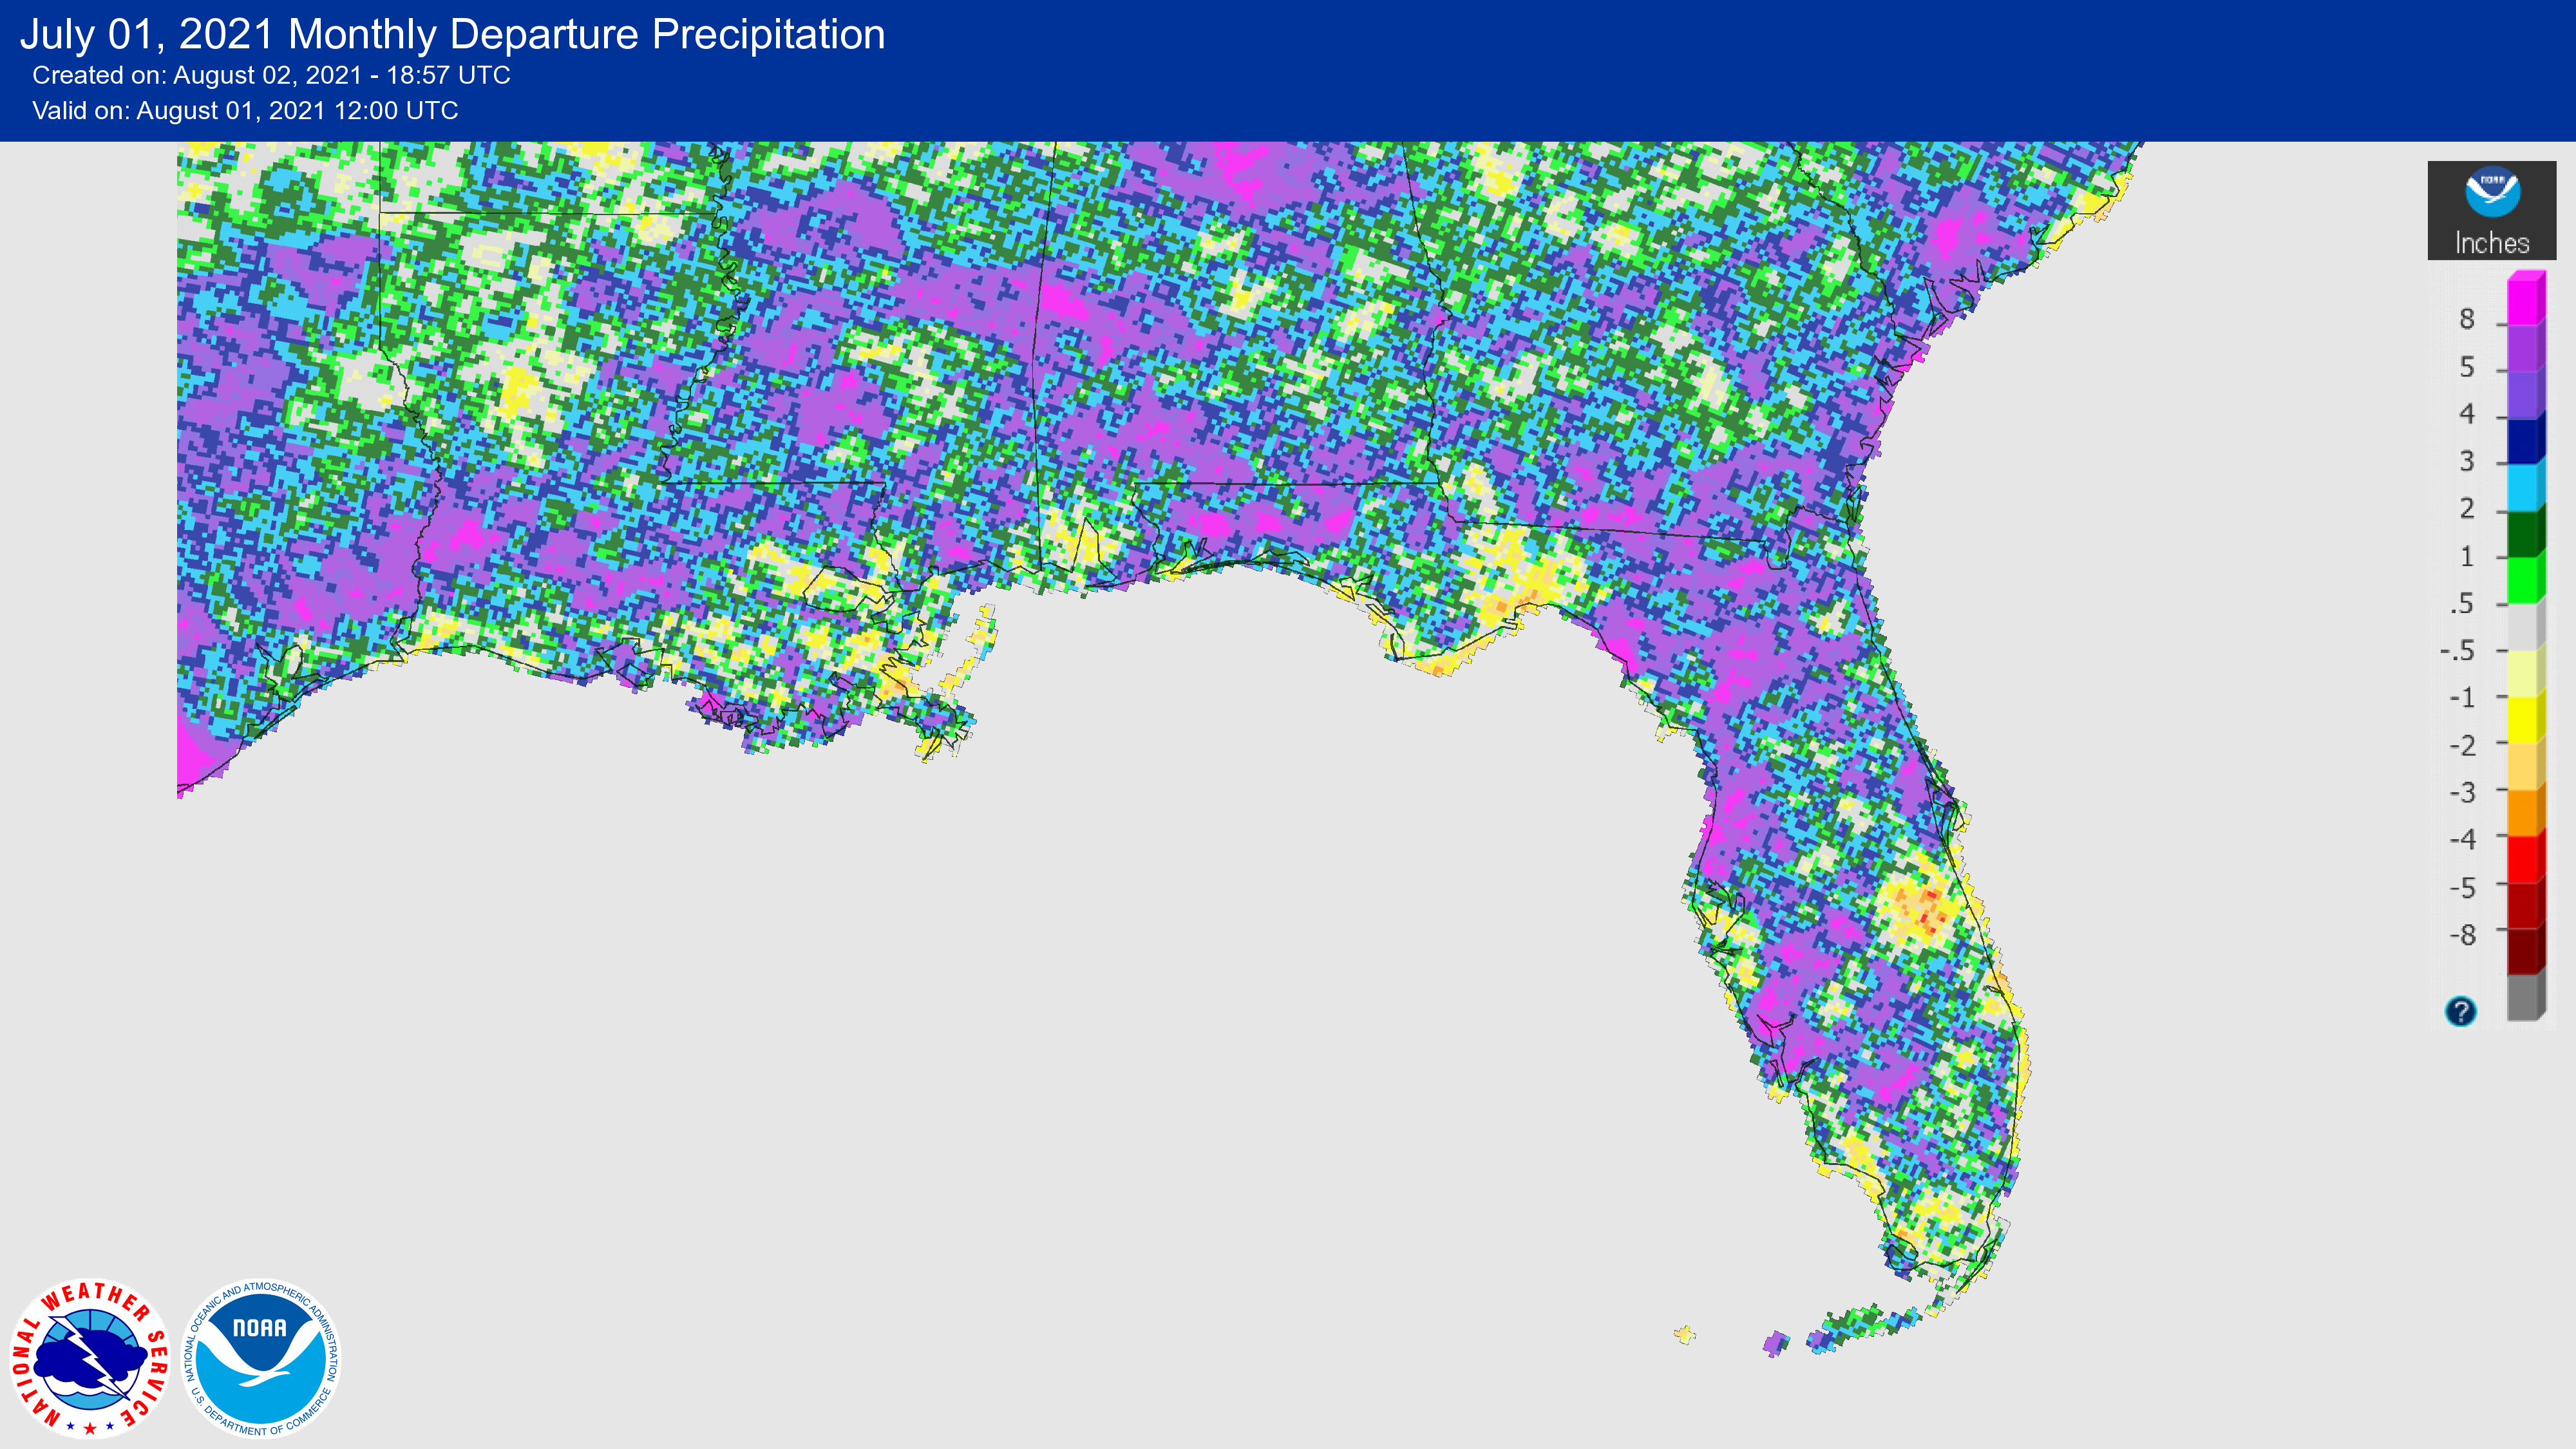
Rainfall totals in July varied, with many areas receiving well above normal rainfall but some areas were below normal. Much of Florida received above normal rainfall, including the western Panhandle, northern and central Florida, and south-central parts of the state (Figure 1). Hurricane Elsa impacted many parts of the state from July 5-7, which brought heavy rain particularly across north central Florida as it made landfall in Taylor County. Monthly departures from normal ranged from +4.02 inches in Key West to -2.61 inches in Tallahassee (Table 2 and Figure 1). Several daily rainfall records were set during the month of June; the highest recorded daily rainfall during the month occurred on the 6th with 9.01 inches of rain at Mountain Lake.
Table 2. July precipitation totals and departures from normal (inches) for selected cities.
| Station | Total Rainfall | Departure from Normal |
| Pensacola | 8.78 | +0.89 |
| Tallahassee | 4.53 | -2.61 |
| Jacksonville | 8.87 | +2.10 |
| Orlando | 6.44 | -1.02 |
| Tampa | 7.30 | -0.45 |
| Miami | 8.18 | +0.82 |
| Key West | 7.65 | +4.02 |
Figure 1. A graphical depiction of the monthly rainfall departure from normal (inches) for July (courtesy of NOAA, NWS).
ENSO-Neutral Conditions.
ENSO-neutral conditions currently exist and are likely to remain through the summer and early fall (51% chance August-October). There is a higher chance that La Niña conditions will redevelop during the fall (September-November) and last through the winter season (~70% chance during November-January).
Hazardous Weather Events in July.
According to the Local Storm Reports issued by the local National Weather Service offices serving Florida, there were 433 individual local reports of hazardous weather events recorded across the state during the month of July (see Table 4 for a breakdown by event type). Hurricane Elsa impacted parts of south, central and northern areas of the state from July 5-7 with heavy rainfall, localized flooding, riverine flooding in north and central Florida, and storm surge. There was one fatality reported in Jacksonville due to a fallen tree. Elsa made landfall in Cuba as a tropical storm and then briefly regained hurricane status over the Gulf of Mexico before making another landfall as a tropical storm in the eastern Florida Panhandle in Taylor County.
Table 4. Breakdown of storm reports submitted in Florida during the month of July (compiled from Iowa State University/Iowa Environmental Mesonet).
| Report Type | Number of Reports |
| Flood | 21 |
| Flash Flood | 4 |
| Hail | 9 |
| Heavy Rain | 36 |
| Marine Thunderstorm Wind | 68 |
| Non-Thunderstorm Wind Gust | 0 |
| Tornado/Waterspout/Funnel Cloud | 3/16/1 |
| Thunderstorm Wind Damage | 24 |
| Thunderstorm Wind Gust | 105 |
| Lightning | 6 |
| Rip Currents | 1 |
| Storm Surge | 2 |
| Tropical Storm | 137 |
Drought-Related Impacts.
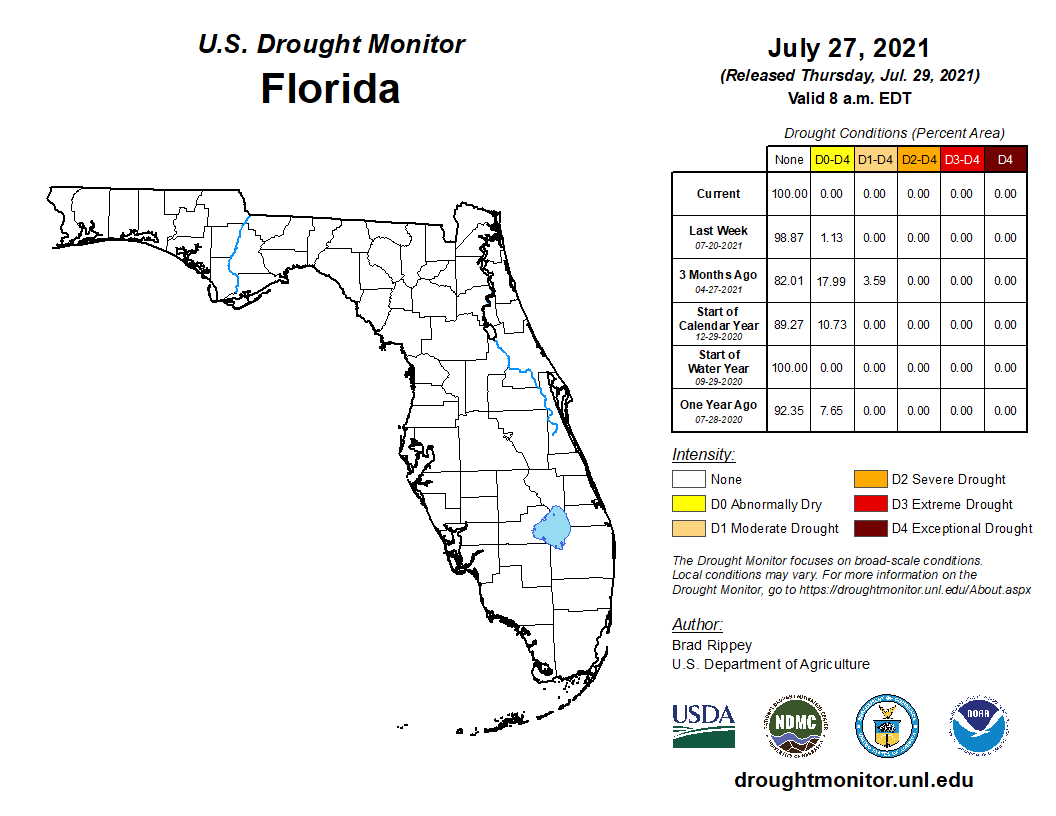
As of the end of July, drought was not impacting any part of the state. From early to mid-July, a small pocket of abnormally dry conditions persisted in the southern tip of the Peninsula, but by end of July this had dissipated. According to the U.S. Drought Monitor, just 1.13% of the southern part of the state was experiencing abnormally dry conditions (D0) but with continued rainfall during the wet season this has been alleviated.
As of July 31, the Lake Okeechobee water level was at 13.70 ft. above sea level (Feet-NGVD29), which is right around the average for this time of the year. At the first of the month, the water level was 12.82 ft. above sea level.
Agriculture-Related Impacts.
In mid-July, topsoil moisture levels were adequate for 67% of the state, short in 4%, and 29% of the state was in surplus. By the end of July, topsoil moisture levels were adequate in 80% of the state, short in 7%, and 13% of the state was in surplus. Much of the state had either good (51%) or excellent (35%) pasture and range conditions by the end of the month. For more information, consult the weekly Crop Progress and Conditions report published by the USDA's National Agricultural Statistics Service.
Appendix 1
Additional July departures from normal data for select Florida locations (Source: NWS).
| Station | Average Temperature (˚F) | Departure from Normal (˚F) | Total Rainfall (in.) | Departure from Normal (in.) |
| Gainesville | 81.0 | -0.4 | 13.99 | +7.31 |
| Sarasota | 82.9 | -0.2 | 10.38 | +2.99 |
| Melbourne | 82.9 | -0.2 | 5.13 | -1.37 |
| Fort Myers | 84.0 | +0.8 | 8.86 | -0.52 |
| West Palm Beach | 83.3 | +0.2 | 5.66 | +0.03 |
Appendix 2
Select daily record high minimum temperatures tied or broken during July (compiled from NOAA).
| Location | Date | Record (˚F) | Broken/Tied | Last |
| Melbourne | 7 | 79 | Broken | 78 in 2010 |
| Perrine | 7 | 78 | Broken | 76 in 2017 |
| Stuart | 7 | 80 | Tied | 80 in 1973 |
| Vero Beach | 7 | 80 | Broken | 77 in 2016 |
| Plant City | 8 | 78 | Broken | 77 in 2000 |
| Tampa | 8 | 81 | Tied | 81 in 2020 |
| Lakeland | 8 | 77 | Broken | 76 in 1963 |
| Key West | 9 | 84 | Tied | 84 in 1965 |
| Daytona Beach | 15 | 80 | Tied | 80 in 2012 |
| Key West | 18 | 84 | Tied | 84 in 2019 |
| Jacksonville Beach | 22 | 80 | Broken | 79 in 2020 |
| Punta Gorda | 22 | 79 | Broken | 78 in 2015 |
| Orlando | 22 | 79 | Broken | 78 in 2015 |
| Key West | 22 | 84 | Broken | 83 in 2011 |
| Lakeland | 22 | 78 | Broken | 76 in 1995 |
| Perry | 23 | 77 | Broken | 76 in 1932 |
| Plant City | 23 | 79 | Broken | 77 in 2015 |
| Punta Gorda | 23 | 81 | Broken | 80 in 2005 |
| Fort Myers | 23 | 81 | Broken | 80 in 2005 |
| Lakeland | 23 | 79 | Broken | 76 in 1995 |
| Jacksonville Beach | 24 | 83 | Broken | 82 in 1987 |
| Wewahitchka | 27 | 76 | Broken | 75 in 1998 |
| Lakeland | 27 | 78 | Broken | 77 in 1962 |
| Plant City | 28 | 79 | Broken | 78 in 1916 |
| Lakeland | 28 | 77 | Broken | 76 in 1968 |
| Key West | 30 | 85 | Tied | 85 in 2009 |
| Panama City | 31 | 81 | Tied | 81 in 2020 |
| Usher Tower | 31 | 77 | Broken | 76 in 2010 |
| Ochopee | 31 | 80 | Broken | 79 in 1999 |
| Key West | 31 | 85 | Tied | 85 in 2019 |
| Lakeland | 31 | 77 | Broken | 76 in 1986 |
| Tallahassee | 31 | 77 | Tied | 77 in 2015 |