
Prepared by Florida Climate Center
The Florida State University
Tallahassee, FL

Average temperatures in February were on average 3 ̊F warmer than historical averages across the state. Average temperatures were at or near normal across northern Florida and the Panhandle and much above normal across the Florida Peninsula. Average temperatures for the month ranged from +5.8 ̊F in West Palm Beach to +0.2 ̊F in Pensacola (see Table 1 and Appendix 1 for select cities). West Palm Beach experienced its third warmest February on record, and Fort Lauderdale had its fourth warmest February on record. Many daily high maximum and high minimum temperature records were set during the month (see Appendices 2 and 3).
Table 1. February average temperatures and departures from normal ( ̊F) for selected cities.
| Station | Mean Temperature | Departure from Normal |
| Pensacola | 54.9 | +0.2 |
| Tallahassee | 56.6 | +1.9 |
| Jacksonville | 57.9 | +1.5 |
| Orlando | 67.1 | +4.1 |
| Tampa | 67.3 | +3.9 |
| Miami | 74.5 | +4.3 |
| Key West | 74.8 | +3.8 |
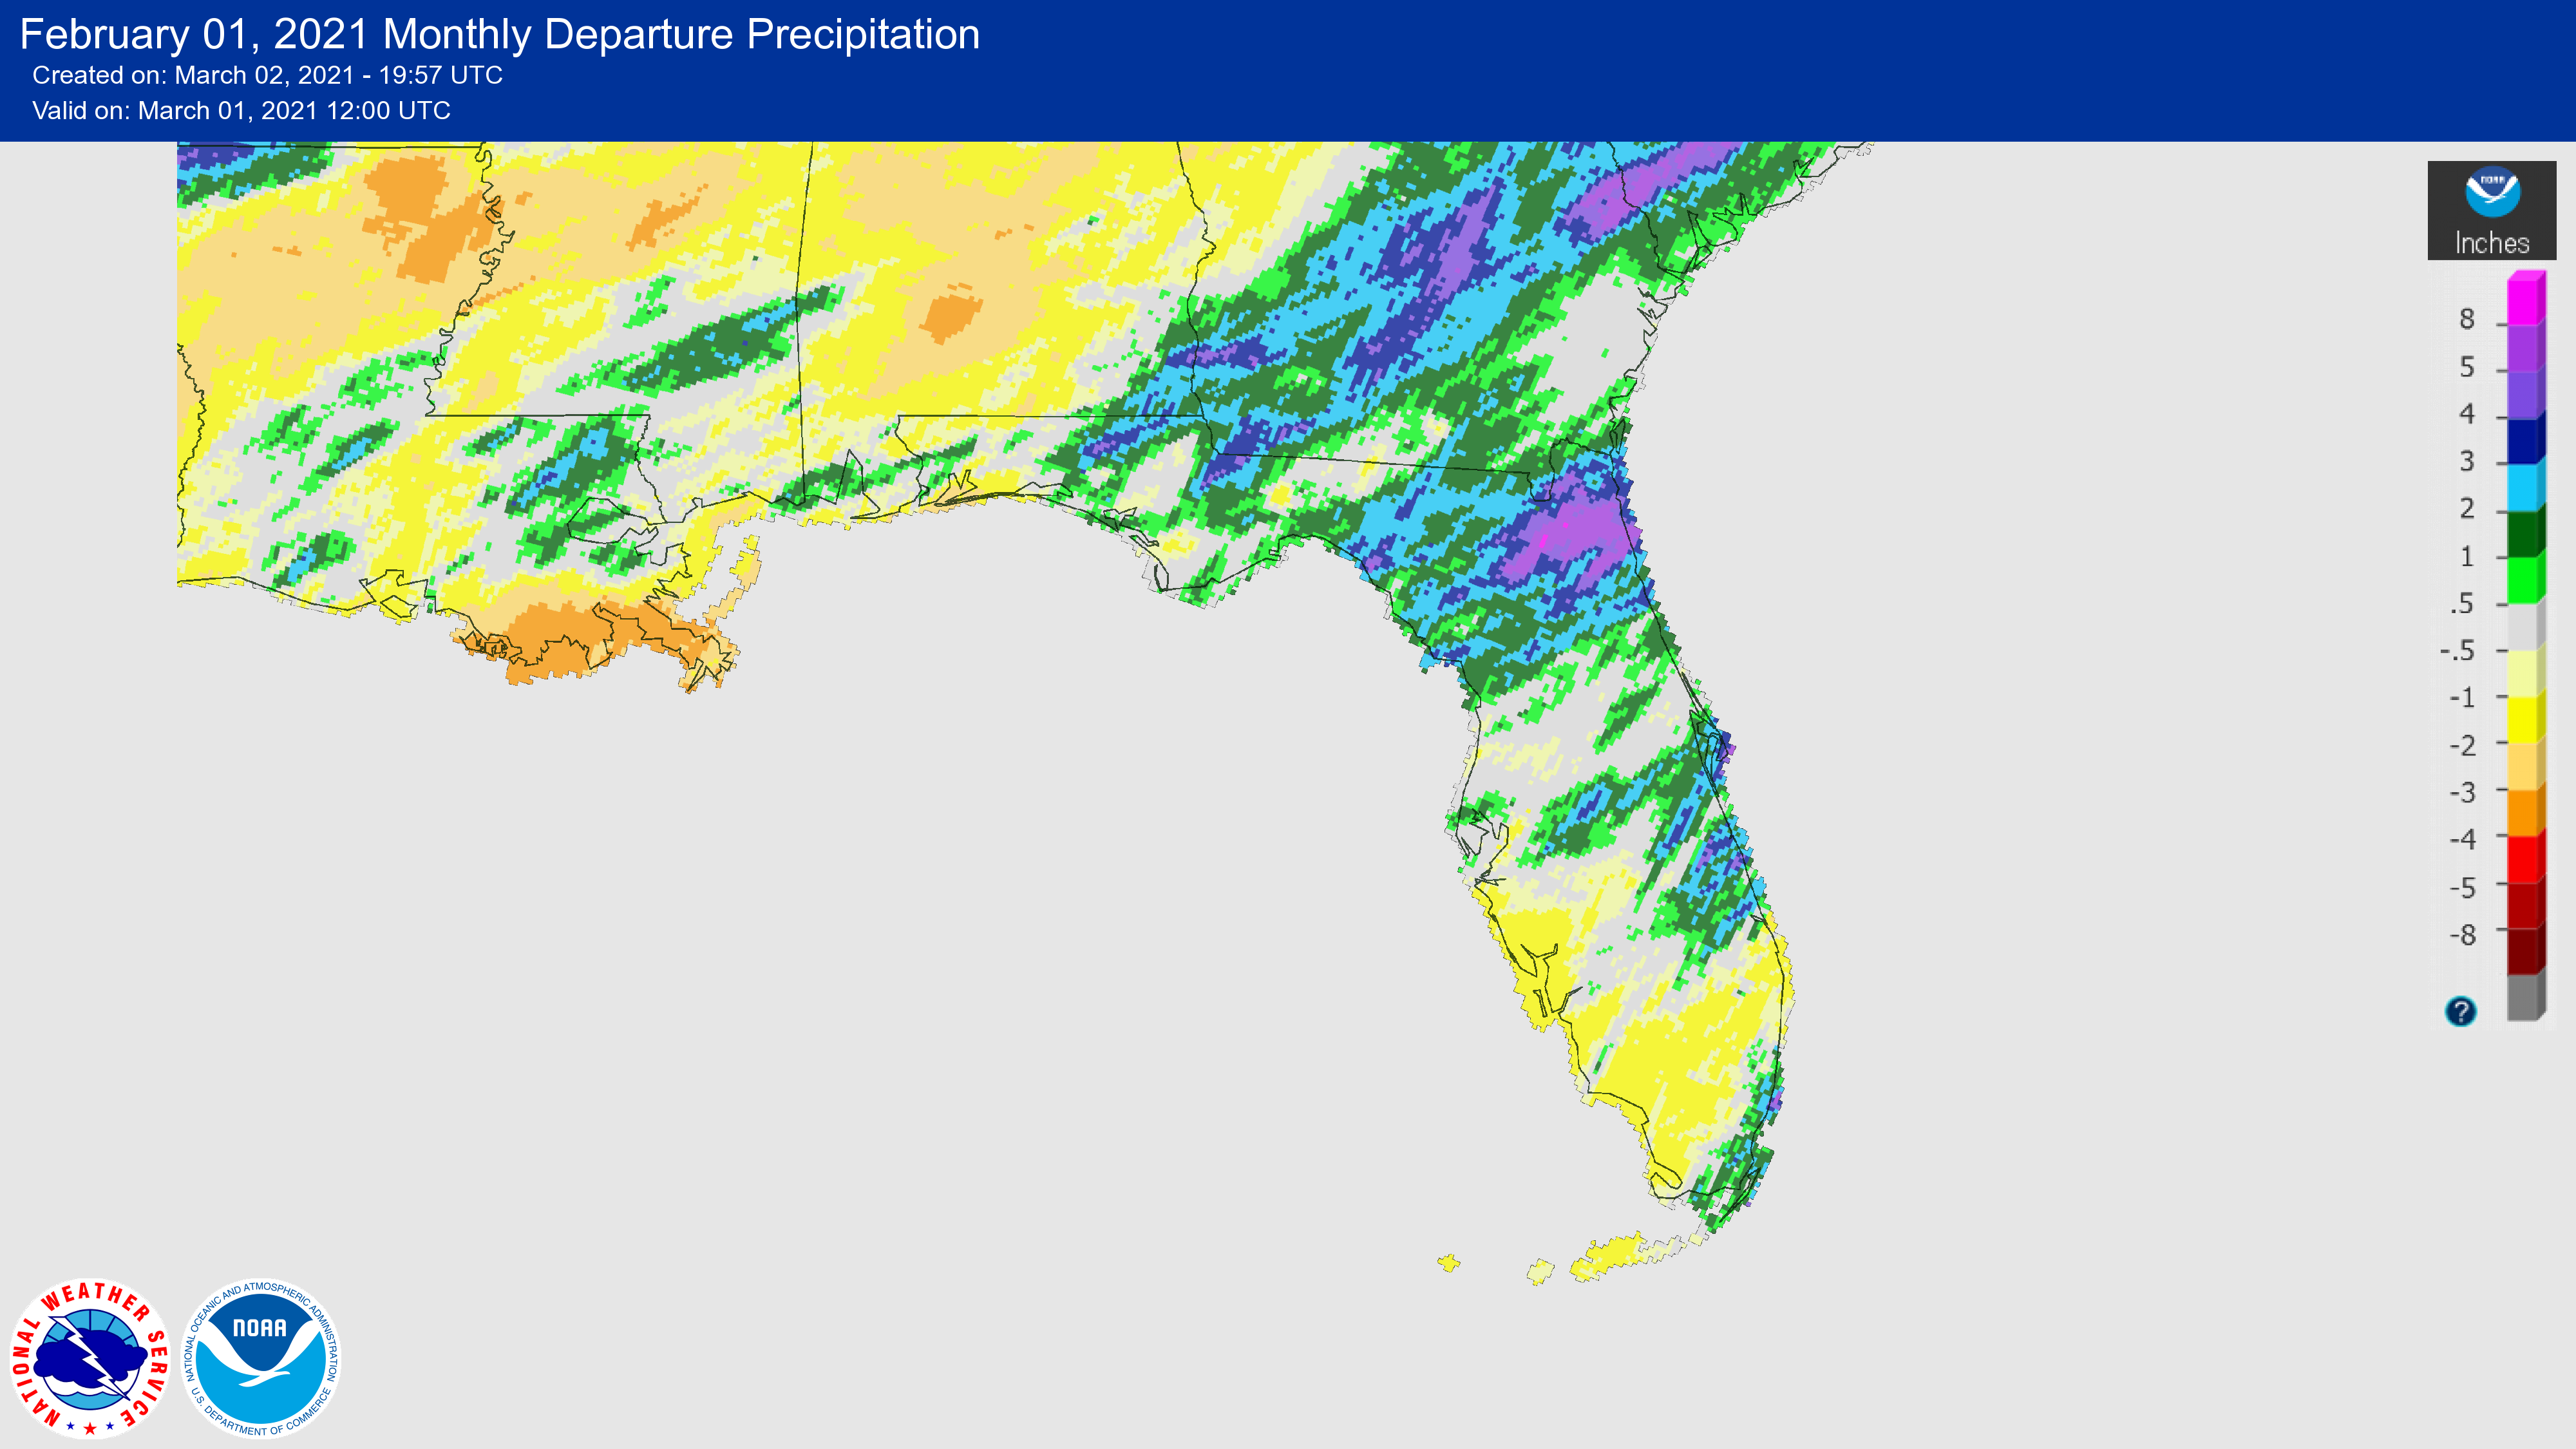
Rainfall totals in February were variable across the state with some locations receiving above normal rainfall and other locations with near or below normal rainfall. Monthly departures from normal ranged from -1.3 inches in Tallahassee to +3.4 inches in Jacksonville (Table 2 and Appendix 1). Much of the northern Peninsula and parts of the Panhandle had above normal rainfall while southwestern Florida experienced below normal rainfall throughout the month (Figure 1). No monthly rainfall records were set during the month. Vero Beach had its third wettest February on record and Jacksonville had its fourth wettest February on record.
Table 2. February precipitation totals and departures from normal (inches) for selected cities.
| Station | Total Rainfall | Departure from Normal |
| Pensacola | 3.85 | -1.21 |
| Tallahassee | 3.58 | -1.27 |
| Jacksonville | 6.63 | +3.44 |
| Orlando | 2.38 | 0.0 |
| Tampa | 3.74 | +0.93 |
| Miami | 2.90 | +0.65 |
| Key West | 0.69 | -0.8 |
Figure 1. A graphical depiction of the monthly rainfall departure from normal (inches) for February (courtesy of NOAA, NWS).
La Niña Conditions in the Pacific Persisted.
La Niña conditions continued during February, but forecasters estimate a shift to ENSO-neutral conditions this spring (~60% chance for April-June). ENSO-neutral conditions are then expected to continue at least through the Northern Hemisphere summer. Recent stratospheric warming and disruptions in the polar vortex, along with a negative phase in the Arctic Oscillation, have influenced weather patterns in the eastern U.S. this winter and overwhelmed typical weather patterns generally seen during La Niña. However, more typical La Niña conditions have returned with above-average temperatures and drier than average conditions across much of the southern tier of the U.S.
Hazardous Weather Events in February.
According to the Local Storm Reports issued by the local National Weather Service offices serving Florida, there were 249 individual local reports of hazardous weather events recorded across the state during the month of February (see Table 4 for a breakdown by event type).
Table 4. Breakdown of storm reports submitted in Florida during the month of February (compiled from Iowa State University/Iowa Environmental Mesonet).
| Report Type | Number of Reports |
| Marine Thunderstorm Wind | 24 |
| Non-Thunderstorm Wind Damage | 1 |
| Non-Thunderstorm Wind Gust | 55 |
| Tornado/Waterspout/Funnel Cloud | 6/1/5 |
| Thunderstorm Wind Damage | 41 |
| Thunderstorm Wind Gust | 54 |
| Lightning | 3 |
| Hail | 31 |
| Flood/FLash Flood | 9/1 |
| Heavy Rain | 17 |
| Rip Currents | 1 |
Drought-Related Impacts.
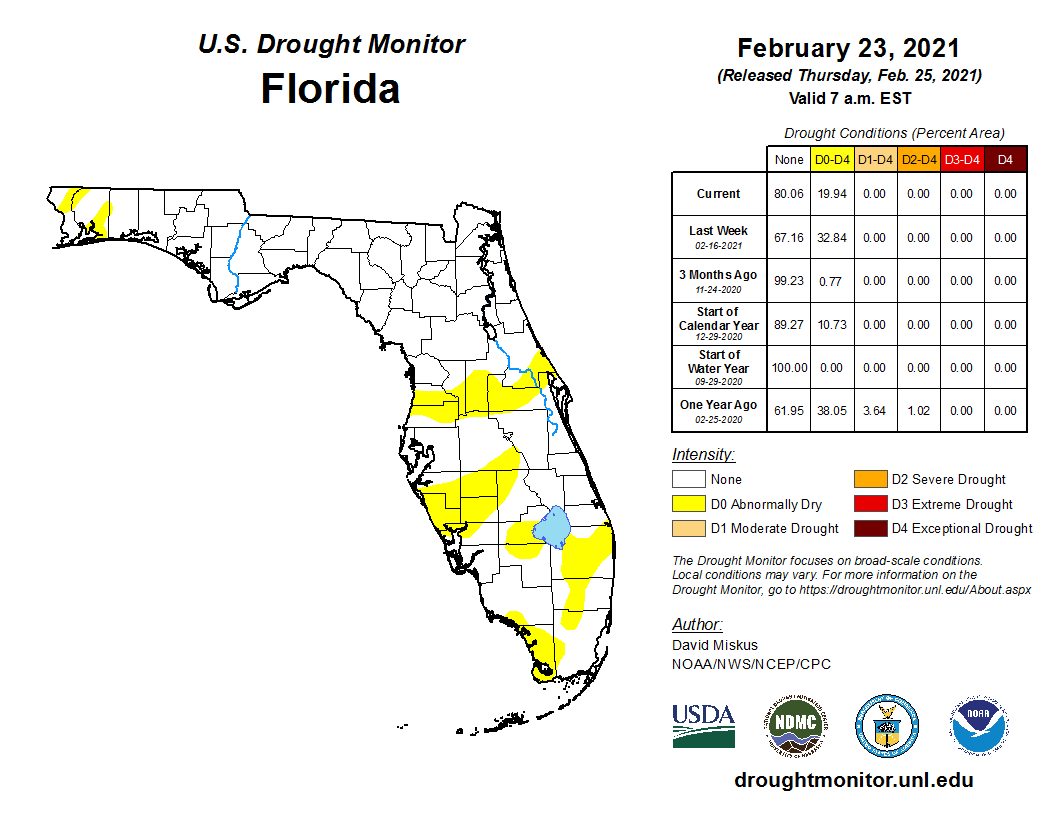
Near the end of February 2021, abnormally dry conditions were found in parts of the Florida Peninsula and the extreme western panhandle region. According to the U.S. Drought Monitor, 33 percent of the state was in abnormally dry conditions (D0) at the end of the month. In early February, abnormally dry conditions emerged across much of the Florida Peninsula but by mid-February these conditions dissipated in some areas. Dry conditions are expected to continue, and the seasonal drought outlook indicates that drought development is likely through the spring across the Peninsula.
As of February 28, the Lake Okeechobee water level was at 15.33 ft. above sea level (Feet-NGVD29), which is above average for this time of the year. At the first of the month, the water level was 15.51 ft. above sea level.
Agriculture-Related Impacts.
For the month of February, the Crop Progress - State Stories, produced monthly December through March, for Florida indicates that pasture conditions declined at the beginning of February due to colder temperatures but improved throughout the month as temperatures rose. Cattle conditions remained mostly good during the month, while sugarcane had minimal damage from frost that was reported mid-month. Toward the end of the month, powdery mildew and worm pressure were reported in some crops. Many citrus fruits were harvested, and several vegetable crops came to market.
Appendix 1
Additional February departures from normal data for select Florida locations (Source: NWS).
| Station | Average Temperature (˚F) | Departure from Normal (˚F) | Total Rainfall (in.) | Departure from Normal (in.) |
| Gainesville | 60.5 | +3.0 | 6.01 | +2.81 |
| Sarasota | 67.6 | +4.2 | 2.19 | -0.51 |
| Melbourne | 68.1 | +5.4 | 2.61 | +0.08 |
| Fort Myers | 70.8 | +4.2 | 2.98 | +0.83 |
| West Palm Beach | 73.6 | +5.8 | 2.62 | -0.20 |
Appendix 2
Select daily record high maximum temperatures tied or broken during February (compiled from NOAA).
| Location | Date | Record (˚F) | Broken/Tied | Last |
| Fort Lauderdale | 8 | 84 | Tied | 84 in 2020 |
| Punta Gorda | 9 | 89 | Broken | 87 in 2017 |
| Orlando | 9 | 86 | Broken | 84 in 1994 |
| West Palm Beach | 9 | 85 | Tied | 85 in 2017 |
| Clermont | 10 | 87 | Broken | 85 in 2001 |
| Tampa | 10 | 86 | Broken | 85 in 2020 |
| Orlando | 10 | 86 | Broken | 85 in 2018 |
| Clermont | 11 | 88 | Broken | 87 in 2018 |
| Miles City | 12 | 90 | Tied | 90 in 2020 |
| Vero Beach | 13 | 88 | Broken | 87 in 2020 |
| Lakeland | 13 | 84 | Tied | 84 in 1959 |
| Vero Beach | 14 | 88 | Broken | 87 in 2009 |
| Perrine | 15 | 87 | Broken | 86 in 2020 |
| Plant City | 15 | 89 | Broken | 88 in 1959 |
| Punta Gorda | 15 | 88 | Broken | 87 in 2003 |
| Tampa | 15 | 86 | Broken | 85 in 1990 |
| Ochopee | 15 | 87 | Tied | 87 in 2003 |
| Daytona Beach | 15 | 86 | Broken | 85 in 1959 |
| Miami | 15 | 86 | Broken | 84 in 2017 |
| Melbourne | 16 | 88 | Broken | 87 in 1982 |
| Sanford | 16 | 87 | Broken | 85 in 2001 |
| Punta Gorda | 17 | 87 | Tied | 87 in 2020 |
| Tarpon Springs | 18 | 85 | Tied | 85 in 2020 |
| Mayport | 18 | 87 | Broken | 85 in 2019 |
| Daytona Beach | 18 | 88 | Broken | 87 in 1944 |
| Lisbon | 19 | 85 | Broken | 84 in 2019 |
| Sanford | 20 | 88 | Broken | 85 in 2019 |
| Vero Beach | 20 | 88 | Broken | 87 in 1975 |
| Tampa | 26 | 87 | Broken | 85 in 1997 |
| Plant City | 27 | 90 | Broken | 89 in 1962 |
| Pensacola | 28 | 79 | Broken | 78 in 2018 |
Appendix 3
Select daily record high minimum temperatures tied or broken during February (compiled from NOAA).
| Location | Date | Record (˚F) | Broken/Tied | Last |
| Clermont | 7 | 69 | Broken | 67 in 1955 |
| Perrine | 7 | 70 | Broken | 68 in 2018 |
| Punta Gorda | 7 | 71 | Broken | 65 in 1971 |
| Lakeland | 7 | 68 | Broken | 66 in 1955 |
| Mountain Lake | 8 | 70 | Broken | 68 in 2018 |
| Vero Beach | 8 | 67 | Broken | 65 in 2008 |
| Fort Pierce | 9 | 69 | Tied | 69 in 1939 |
| Orlando | 9 | 67 | Broken | 64 in 1965 |
| Bradenton | 10 | 66 | Tied | 66 in 1982 |
| Miles City | 10 | 67 | Broken | 66 in 1982 |
| Orlando | 10 | 67 | Broken | 65 in 2019 |
| Bradenton | 13 | 69 | Tied | 69 in 2018 |
| Perrine | 14 | 71 | Broken | 69 in 1997 |
| Miami | 14 | 76 | Broken | 74 in 1997 |
| Fort Lauderdale Beach | 15 | 75 | Broken | 72 in 2018 |
| Tampa | 15 | 66 | Broken | 64 in 2018 |
| Stuart | 16 | 75 | Broken | 73 in 2020 |
| Fort Lauderdale | 18 | 73 | Broken | 71 in 1995 |
| Perrine | 18 | 71 | Broken | 68 in 2008 |
| Daytona Beach | 19 | 70 | Broken | 66 in 2020 |
| Hastings | 19 | 67 | Broken | 64 in 1994 |
| Titusville | 19 | 70 | Broken | 68 in 2020 |
| Mountain Lake | 22 | 78 | Broken | 70 in 2014 |
| Tampa | 27 | 70 | Broken | 69 in 1997 |