
Prepared by Florida Climate Center
The Florida State University
Tallahassee, FL

Average temperatures continued to be well above average across the state in November. Most places in Florida were warm throughout the month with average temperatures above normal, much like the contiguous U.S. which had its 4th warmest November on record. Departures from normal across the state ranged from +1.4 ̊F in Key West to over +6 ̊F in the Panhandle (Table 1 and Appendix 1). West Palm Beach observed its second warmest November on record (1888-2020). Both maximum and minimum temperatures were well above average during the month across the state as well. Many high daily minimum temperature records were set during the month; Tampa observed its highest daily minimum temperature on record at 78 ̊F on the 10th (1890-2020). Additionally, many record daily high maximum temperatures were set, particularly during the middle of the month (Appendix 2).
Table 1. November average temperatures and departures from normal ( ̊F) for selected cities.
| Station | Mean Temperature | Departure from Normal |
| Pensacola | 67.2 | +6.5 |
| Tallahassee | 66.6 | +5.8 |
| Jacksonville | 67.3 | +4.7 |
| Orlando | 73.5 | +5.0 |
| Tampa | 74.6 | +5.2 |
| Miami | 77.4 | +2.2 |
| Key West | 77.8 | +1.4 |
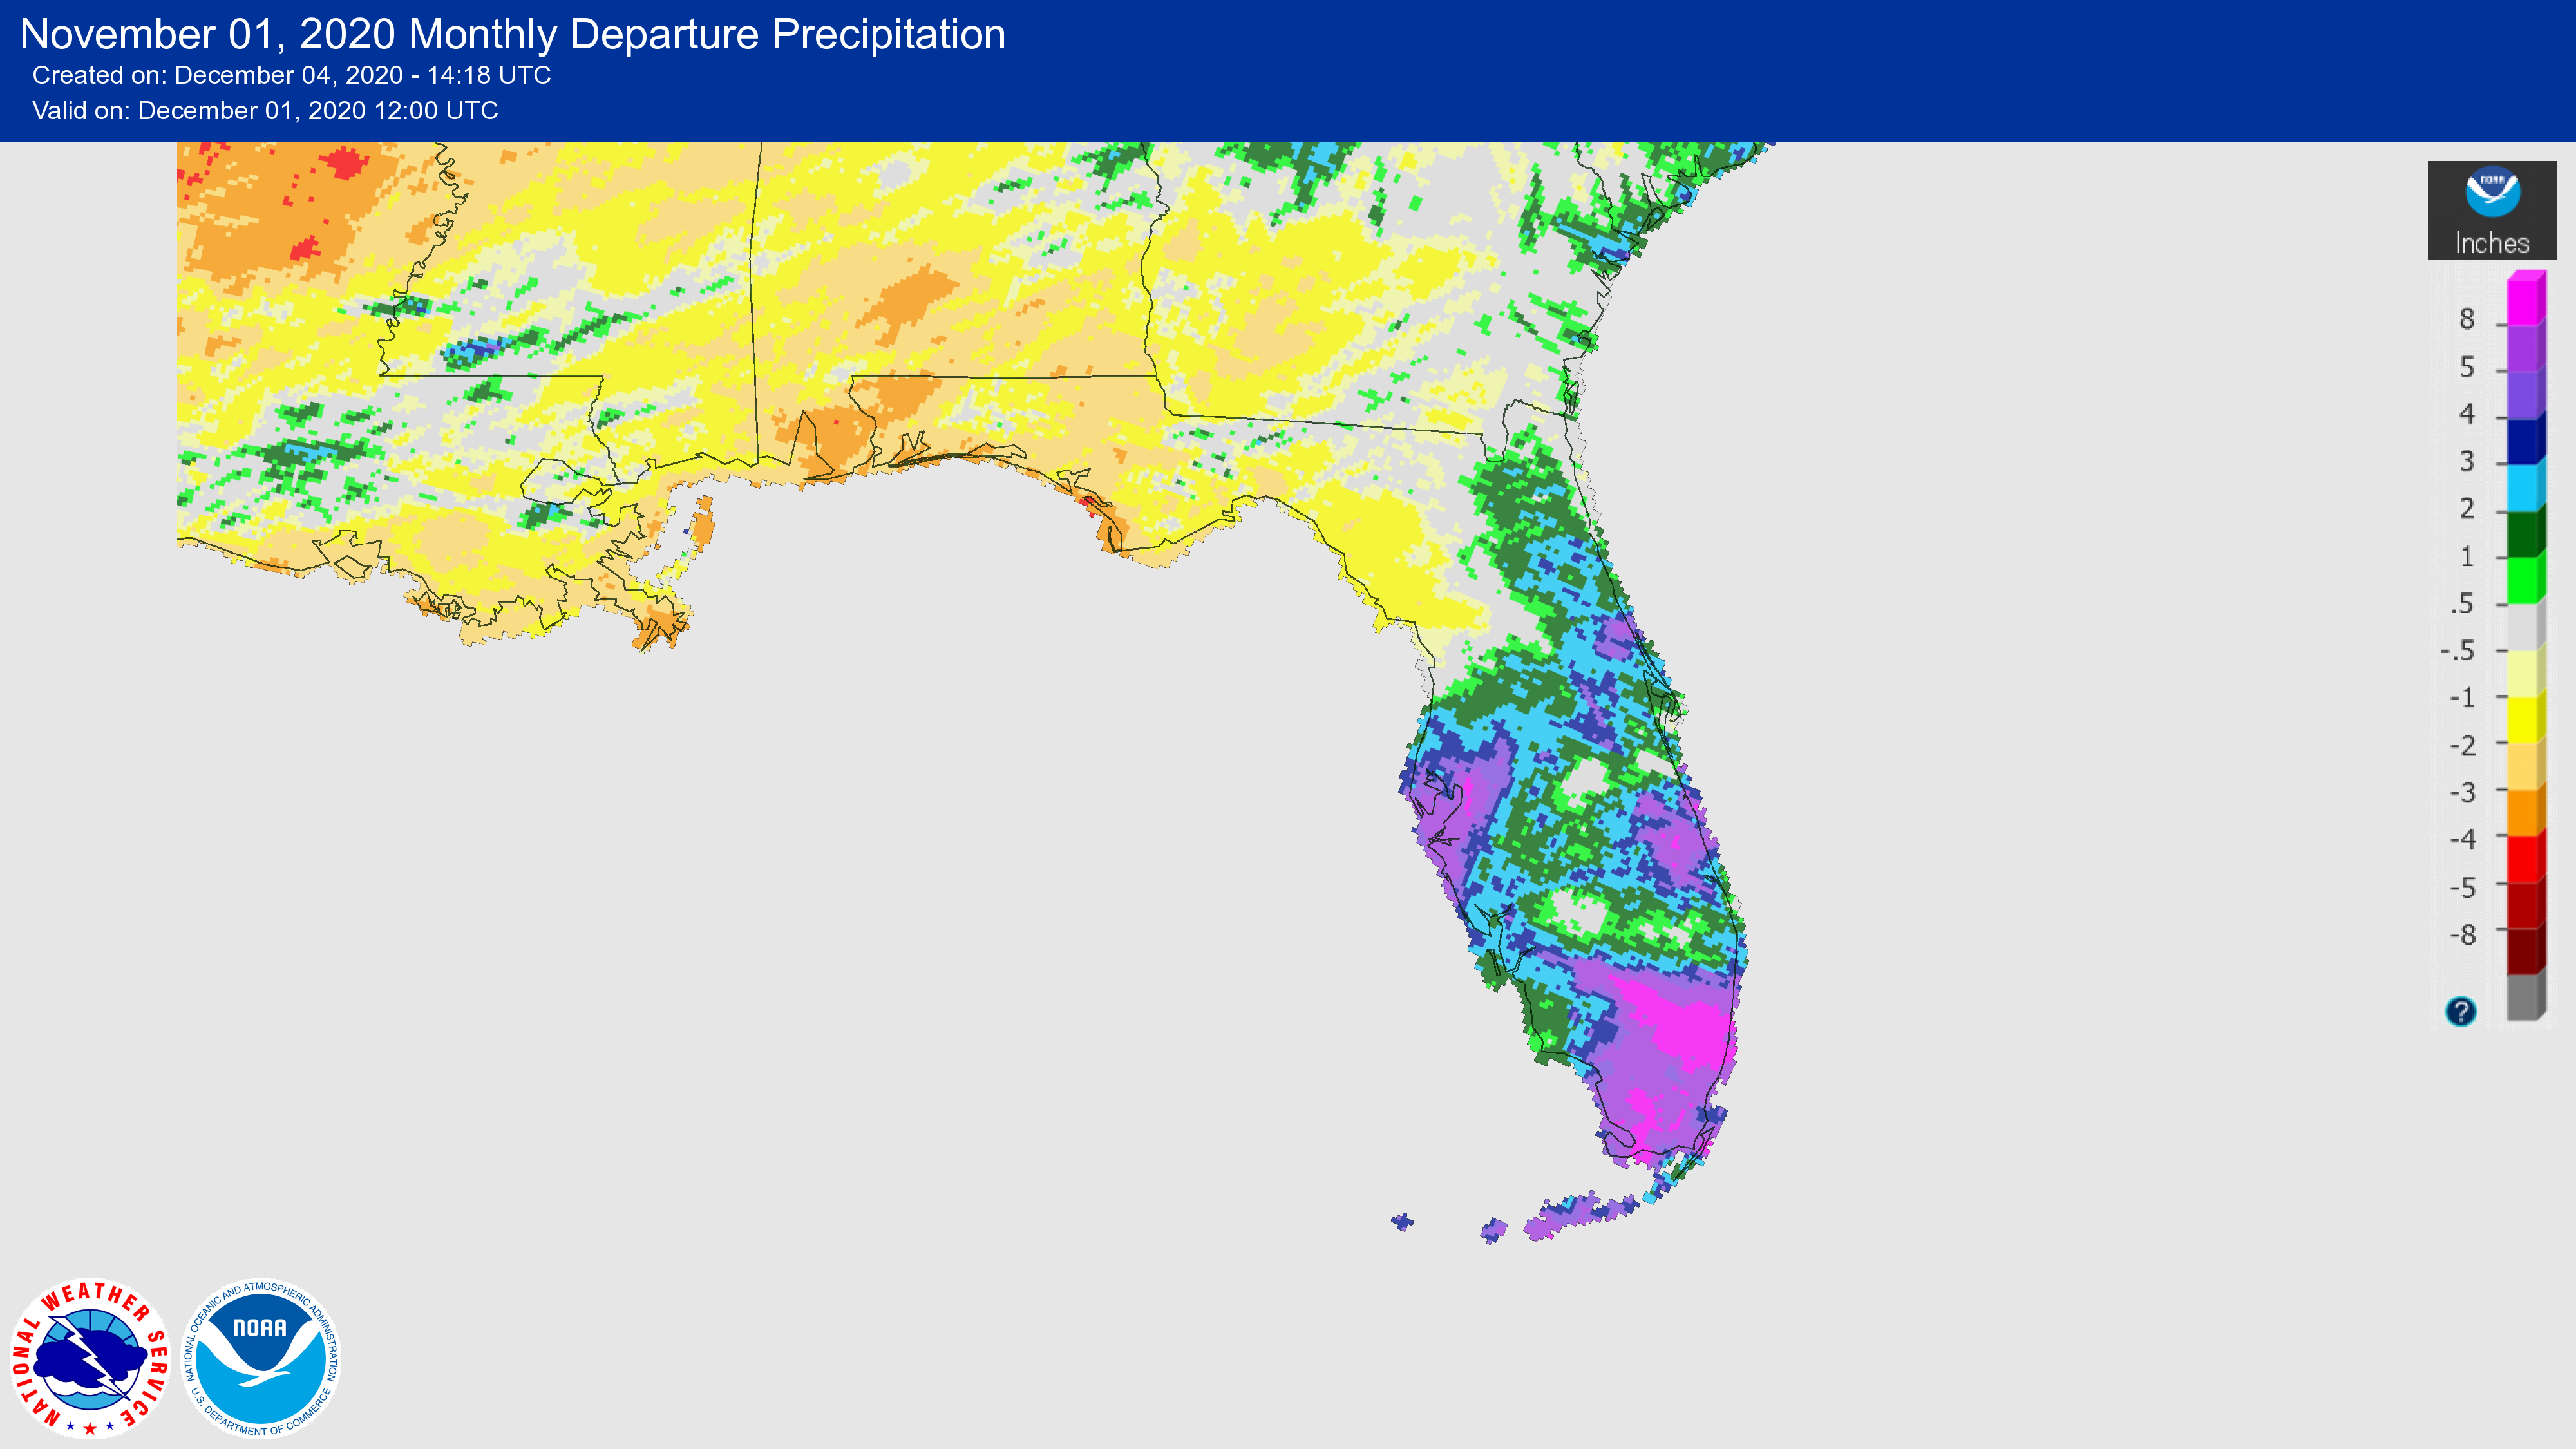
Rainfall totals in November were mixed, with wetter than normal conditions in the southern half of the state and drier than normal conditions in the northwestern and Panhandle regions. The Panhandle observed monthly precipitation departures from normal ranging from -3.5 inches in Crestview to -1.3 inches in Perry. Conversely, the Peninsula experienced wetter conditions during the month, with departures from normal ranging from +1.6 inches in Orlando to over +11 inches in Fort Lauderdale (Table 2 and Figure 1). From November 8-12th, Tropical Storm Eta impacted portions of west-central and southern Florida, contributing between 5 and 10 inches of rainfall in these areas. On the 11th, Sarasota-Bradenton observed its wettest November day on record (since 1911) with 6.41 inches of rainfall. Additionally, Fort Lauderdale, Miami, Homestead, and Sarasota all experienced their wettest Novembers on record.
Table 2. November precipitation totals and departures from normal (inches) for selected cities.
| Station | Total Rainfall | Departure from Normal |
| Pensacola | 2.20 | -2.53 |
| Tallahassee | 3.63 | +0.13 |
| Jacksonville | 1.81 | -0.31 |
| Orlando | 5.24 | +3.06 |
| Tampa | 5.40 | +3.86 |
| Miami | 9.61 | +6.34 |
| Key West | 7.52 | +5.22 |
Figure 1. A graphical depiction of the monthly rainfall departure from normal (inches) for November 2020 (courtesy of NOAA, NWS).
Strong La Niña Conditions in the Pacific.
La Niña strengthened in the tropical Pacific in October, as indicated by sea surface temperature indices in the two westernmost Niño regions. La Niña will continue through the winter (100% chance) with conditions expected to remain strong. La Niña conditions are expected to continue into spring (~65% chance during March-May). La Niña winters tend to favor above-average temperatures and dry conditions across the southern tier of the U.S.
Hazardous Weather Events in November.
There were 676 individual local reports of hazardous weather events recorded in Florida during the month of November (see Table 4 for a breakdown by event type). Tropical Storm Eta made initial landfall on Lower Matecumbe Key, FL on the 8th with maximum sustained winds of 65 mph and several reports of wind gusts exceeding 50 mph. The storm made a second landfall on the 12th near Cedar Key, FL. The storm impacted central and southern parts of the Florida Peninsula, with numerous reports of flooded roadways and homes as the storm moved north and east across the state. With the close of November, the 2020 record-breaking hurricane season has officially ended. Tropical Storm Eta was the 12th named storm to make landfall in the U.S. during this season, which broke the previous annual record of 9 landfalls set in 1916.
Table 4. Breakdown of storm reports submitted in Florida during the month of November (compiled from Iowa State University/Iowa Environmental Mesonet).
| Report Type | Number of Reports |
| Coastal Flood | 3 |
| Flash Flood | 12 |
| Flood | 36 |
| Heavy Rain | 20 |
| Marine Thunderstorm Wind | 251 |
| Non-Thunderstorm Wind Damage | 1 |
| Non-Thunderstorm Wind Gust | 121 |
| Tornado/Waterspout/Funnel Cloud | 4/1/1 |
| Thunderstorm Wind Damage | 14 |
| Thunderstorm Wind Gust | 54 |
| Hail | 2 |
| Rip Current | 1 |
| Storm Surge | 16 | Tropical Storm | 139 |
Drought-Related Impacts.
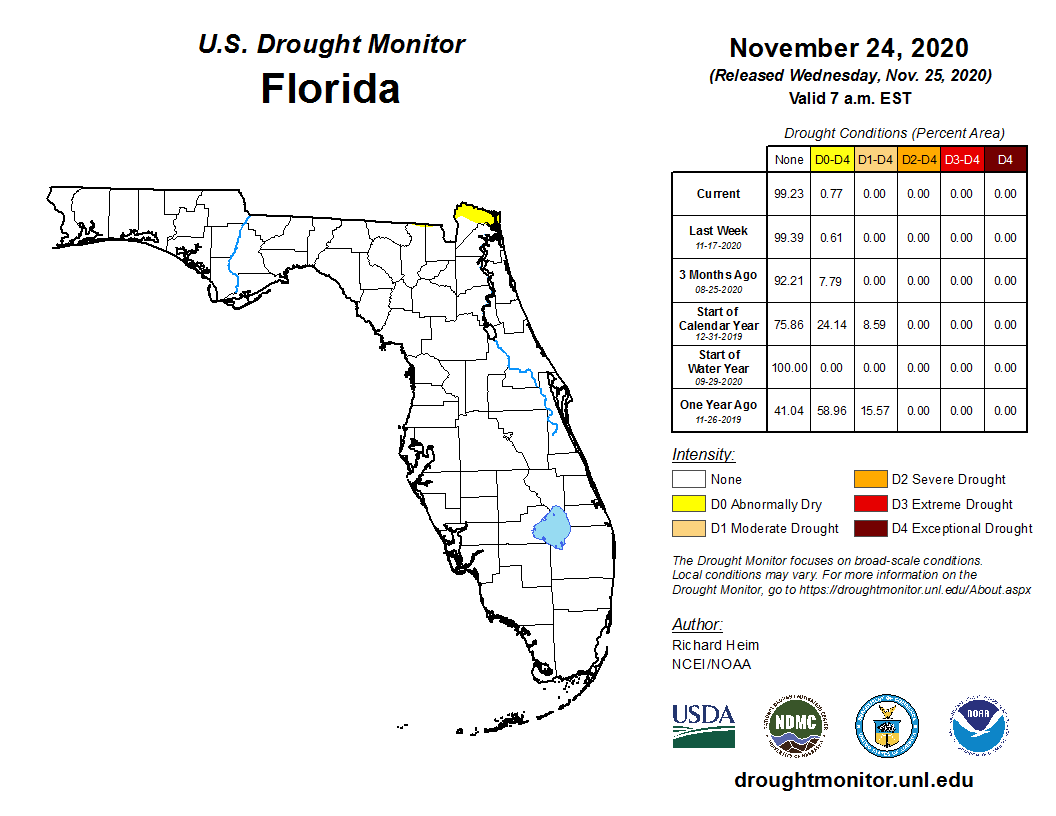
During the month of November, drought did not impact any part of the state, according to the U.S. Drought Monitor. Abnormally dry conditions (D0) affected a small area in the extreme northeastern most section of the state expanding into parts of Georgia. Continuing La Niña conditions are expected to result in a dry winter pattern across the Southeast U.S. region.
As of November 30, the Lake Okeechobee water level was at 16.12 ft. above sea level (Feet-NGVD29), which is above average for this time of the year. At the beginning of November, the water level was at 16.26 ft. above sea level.
Agriculture-Related Impacts.
In mid-November, topsoil moisture levels were adequate in 53% of the state, short in 9% of the state, and 38% of the state had a surplus. By the end of November, topsoil moisture levels were adequate in 66% of the state, short in 10%, and 24% of the state was in surplus. For more information, consult the weekly Crop Progress and Condition reports published by the USDA’s National Agricultural Statistics Service.
Appendix 1
Additional November departures from normal data for select Florida locations (Source: NWS).
| Station | Average Temperature (˚F) | Departure from Normal (˚F) | Total Rainfall (in.) | Departure from Normal (in.) |
| Gainesville | 67.5 | +4.7 | 2.41 | +0.35 |
| Sarasota | 74.7 | +5.5 | 7.62 | +5.69 |
| Melbourne | 73.2 | +4.2 | 4.41 | +1.53 |
| Fort Myers | 75.8 | +4.2 | 4.21 | +2.29 |
Appendix 2
Select daily maximum temperature records tied or broken during November (compiled from NOAA).
| Location | Date | Record (˚F) | Broken/Tied | Last |
| Miles City | 1 | 94 | Broken | 93 in 2015 |
| Key West | 1 | 96 | Broken | 89 in 2019 |
| Fort Lauderdale | 2 | 89 | Broken | 88 in 2019 |
| Key West | 5 | 90 | Broken | 88 in 2019 |
| Pensacola | 8 | 85 | Broken | 82 in 2017 |
| Key West | 9 | 90 | Broken | 88 in 1993 |
| Pensacola | 9 | 85 | Broken | 83 in 1986 |
| Bradenton | 10 | 87 | Tied | 87 in 2018 |
| Tarpon Springs | 10 | 90 | Broken | 89 in 1946 |
| Gainesville | 10 | 84 | Tied | 84 in 1998 |
| Tampa | 10 | 89 | Broken | 87 in 1986 |
| Key West | 10 | 89 | Broken | 88 in 2018 |
| Crestview | 10 | 85 | Broken | 83 in 2002 |
| Pensacola | 10 | 84 | Broken | 82 in 2002 |
| Tallahassee | 10 | 87 | Tied | 87 in 1986 |
| Niceville | 11 | 83 | Broken | 81 in 2018 |
| Marianna | 11 | 86 | Broken | 82 in 2010 |
| Crestview | 11 | 86 | Broken | 82 in 2010 |
| Pensacola | 11 | 87 | Broken | 82 in 2006 |
| Key West | 12 | 94 | Broken | 88 in 2018 |
| Miami | 14 | 86 | Tied | 86 in 2018 |
| Key West | 14 | 93 | Broken | 88 in 2018 |
| Punta Gorda | 15 | 89 | Broken | 88 in 2011 |
| Key West | 15 | 94 | Broken | 90 in 2007 |
| Pensacola | 15 | 85 | Broken | 84 in 1951 |
| Hastings | 16 | 85 | Tied | 85 in 1993 |
| Niceville | 16 | 85 | Broken | 81 in 1980 |
| Key West | 16 | 95 | Broken | 86 in 1993 |
| Perrine | 17 | 86 | Broken | 85 in 2010 |
| Key West | 17 | 90 | Broken | 87 in 1988 |
| Key West | 19 | 87 | Broken | 86 in 2018 |
| Key West | 20 | 92 | Broken | 86 in 1976 |
| Key West | 21 | 90 | Broken | 86 in 1994 |
| Key West | 22 | 91 | Broken | 85 in 1998 |
| Key West | 23 | 87 | Broken | 85 in 1986 |
| Tallahassee | 26 | 83 | Broken | 82 in 1967 |
| Gainesville | 27 | 82 | Tied | 82 in 1988 |
| Key West | 27 | 93 | Broken | 86 in 2019 |
| Key West | 28 | 94 | Broken | 86 in 1994 |
| Key West | 29 | 94 | Broken | 86 in 1994 |
| Key West | 30 | 89 | Broken | 86 in 1994 |