
Prepared by Florida Climate Center
The Florida State University
Tallahassee, FL

Summary:
- Average monthly temperatures in February were much above average in Florida.
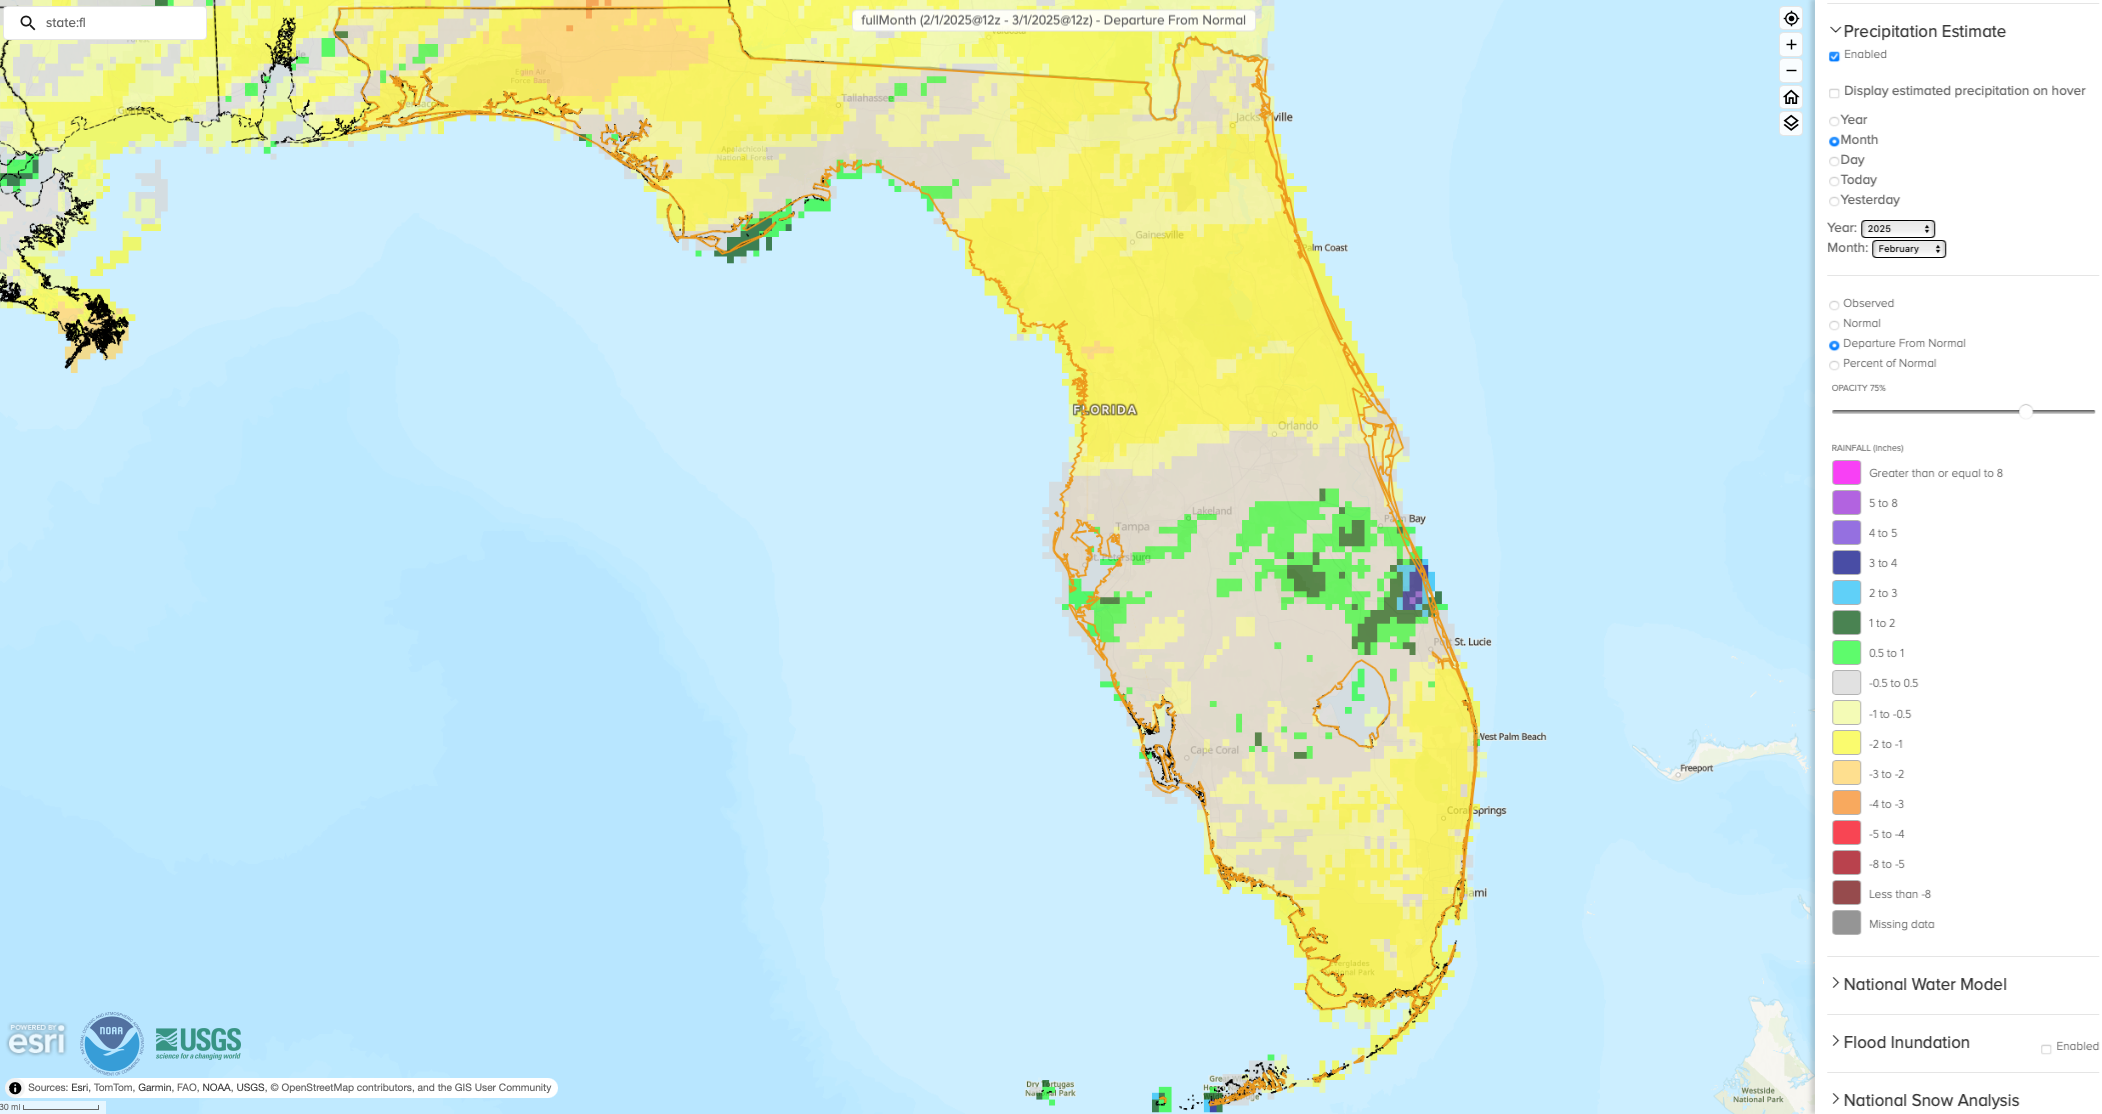
- Monthly precipitation totals in February were generally below normal, except for parts of coastal east-central Florida and the Keys.
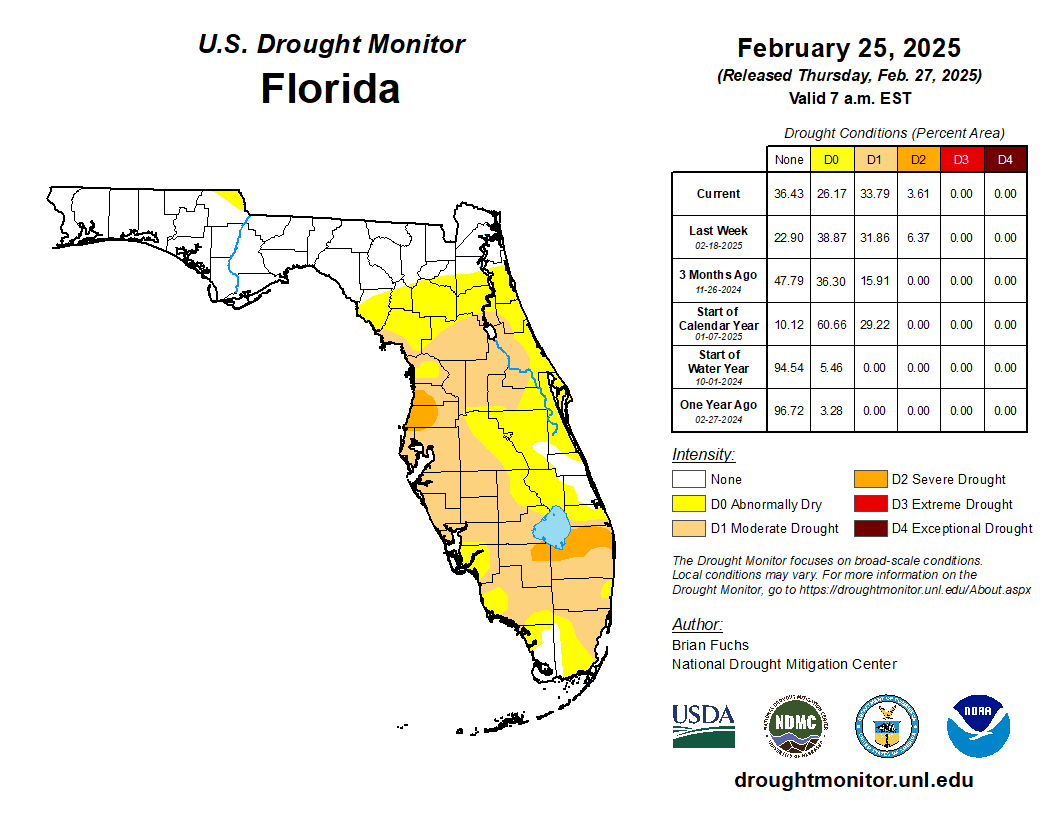
- By the end of February, approximately 4% of the state was in severe drought (D2) and 34% was in moderate drought (D1), while 26% was abnormally dry (D0), according to the U.S. Drought Monitor.
- La Niña conditions persisted in the tropical equatorial Pacific Ocean over the past month; a transition to ENSO-neutral is expected during March-May 2025 (66% chance).
Average monthly temperatures in February were above average in Florida. Average monthly temperature departures from normal ranged from +2.7 ̊F in Key West to +5.5 ̊F in Tallahassee for the month (see Table 1 and Appendix 1 for select cities). The month started off especially warm, with average temperatures from February 1-14 record warm in Tallahassee, Gainesville, Orlando, Melbourne, Sarasota, Fort Myers, and Miami. Cooler weather affected the state during the second part of the month, with mean temperatures averaging out to 3 ̊F -5 ̊F above average for the month as a whole. Several stations recorded one of their top 10 warmest months of February on record. Select daily high maximum temperature records tied or broken during the month are provided in Appendix 2.
Table 1. February average temperatures and departures from normal ( ̊F) for selected cities.
| Station | Mean Temperature | Departure from Normal |
| Pensacola | 59.8 | +3.0 |
| Tallahassee | 61.1 | +5.5 |
| Jacksonville | 61.4 | +3.9 |
| Orlando | 68.7 | +5.1 |
| Tampa | 68.6 | +3.9 |
| Miami | 74.6 | +3.9 |
| Key West | 75.0 | +2.7 |
Monthly precipitation totals were generally below normal in February, with the exception of east-central coastal areas (St. Lucie and Indian River Counties) and the Keys. The monthly precipitation departures from normal ranged from -1.69 inches in Pensacola to +2.05 inches in Key West (see Table 2 and Appendix 1 for select locations). Warmer than average temperatures combined with below average rainfall during the winter led to drought expansion and the introduction of severe drought in parts of the Peninsula during February.
Table 2. February precipitation totals and departures from normal (inches) for selected cities.
| Station | Total Rainfall | Departure from Normal |
| Pensacola | 3.08 | -1.69 |
| Tallahassee | 3.02 | -1.26 |
| Jacksonville | 2.15 | -0.71 |
| Orlando | 1.29 | -0.91 |
| Tampa | 2.85 | -0.75 |
| Miami | 0.72 | -1.43 |
| Key West | 3.59 | +2.05 |
Figure 1. A graphical depiction of the monthly rainfall departure from normal (inches) for February (courtesy of NOAA, NWS).
La Niña Advisory.
La Niña conditions continued in the tropical equatorial Pacific Ocean. Sea surface temperatures (SSTs) across the central and east-central equatorial Pacific Ocean continued to be below average over the past month. La Niña conditions are expected to persist in the near-term and transition to ENSO-neutral during March-May 2025 (66% chance). A weak La Niña is favored through February-April. However, there is also a 41% chance of ENSO-neutral emerging in this season.
Hazardous Weather Events in February.
According to the Local Storm Reports issued by the local National Weather Service offices serving Florida, there were 111 individual local reports of hazardous weather events recorded across the state during the month of February (see Table 3 for a breakdown by event type). Strong wind gusts associated with thunderstorms affected areas across the northern half of the state mid-month, while a 650-acre wildfire broke out at the end of the month in northwestern Brevard County, which was fully contained per the Florida Forest Service.
Table 3. Breakdown of storm reports submitted in Florida during the month of February (compiled from Iowa State University/Iowa Environmental Mesonet).
| Report Type | Number of Reports |
| Heavy Rain | 1 |
| Flash Flood | 0 |
| Dense Fog | 1 |
| Marine Thunderstorm Wind | 15 |
| Non-Thunderstorm Wind Gust | 12 |
| Tornado/Waterspout/Funnel Cloud | 0 / 1 / 0 |
| Thunderstorm Wind Damage | 15 |
| Thunderstorm Wind Gust | 65 |
| Wildfire | 1 |
Daily Record Events in February.
Table 4. Summary of daily records broken or set in Florida in February (source: NCEI Daily Weather Records).
| Category | Number of Records |
| Highest daily max. temp. | 51 |
| Highest daily min. temp. | 47 |
| Lowest daily max. temp. | 11 |
| Lowest daily min. temp. | 1 |
| Highest daily precipitation | 14 |
| Total | 124 |
Drought-Related Impacts.
Drought expanded in the Peninsula during the month. In mid-February, about 6% of the state was in severe drought (D2), roughly 32% of the state was in moderate drought (D1), and 39% was abnormally dry (D0), according to the U.S. Drought Monitor. By the end of the month, approximately 4% of the state was in severe drought (D2), about 34% was in moderate drought (D1), and 26% of the state was abnormally dry (D0) (Figure 2 below).
As of February 28, the Lake Okeechobee water level was 13.77 ft. above sea level (Feet-NGVD29), which is below average for this time of year. At the first of the month, the water level was 14.38 ft. above sea level.
Figure 3. A graphical depiction of the latest drought conditions in Florida according to the U.S. Drought Monitor (courtesy of the National Drought Mitigation Center, University of Nebraska-Lincoln).
Agriculture-Related Impacts.
February brought a return to above normal temperatures and overall dry conditions. Chill hour accumulations are running above last year, but still below the historical average given the warmer weather that occurred in February. Drier weather allowed time for field preparations for spring planting. A dip in temperatures toward the end of the month resulted in losses to fruits and vegetables like strawberries in Okaloosa County. Producers prepared fields for rice planting and sugarcane harvest continued as planned throughout the month. Beekeepers prepared for the citrus bloom season. Pasture conditions were mostly fair and had improved near month’s end. Cattle conditions remained in mostly good condition. For more information, consult the Crop Progress State Stories, which is published by the USDA’s National Agricultural Statistics Service December through March.
Appendix 1
Additional February departures from normal data for select Florida locations (Source: NWS).
| Station | Average Temperature (˚F) | Departure from Normal (˚F) | Total Rainfall (in.) | Departure from Normal (in.) |
| Gainesville | 63.4 | +5.1 | 1.91 | -0.76 |
| Sarasota | 69.3 | +4.5 | 3.05 | +1.13 |
| Melbourne | 68.9 | +4.9 | 1.87 | -0.11 |
| Fort Myers | 72.1 | +4.8 | 1.69 | -0.09 |
| West Palm Beach | 72.8 | +4.4 | 1.69 | -0.94 |
Appendix 2
Select daily record low maximum temperatures (°F) tied or broken during February 2025 (compiled from NOAA).
| Location | Date | Record | Broken/Tied | Last |
| Fernandina Beach | 4 | 89 | Broken | 84 in 2014 |
| Plant City | 4 | 88 | Broken | 87 in 1907 |
| Crestview | 4 | 81 | Broken | 76 in 2012 |
| Tallahassee | 4 | 82 | Broken | 81 in 1957 |
| Plant City | 6 | 88 | Broken | 86 in 2020 |
| Crestview | 6 | 78 | Broken | 76 in 1994 |
| Pensacola | 6 | 78 | Broken | 76 in 1994 |
| Fort Lauderdale | 7 | 83 | Tied | 83 in 2022 |
| Ochopee | 7 | 87 | Broken | 86 in 2012 |
| Fort Myers | 7 | 86 | Tied | 86 in 1994 |
| Crestview | 9 | 84 | Broken | 81 in 1994 |
| Pensacola | 9 | 80 | Broken | 78 in 1957 |
| Tallahassee | 9 | 83 | Broken | 82 in 1957 |
| Chipley | 10 | 83 | Broken | 82 in 1994 |
| St. Augustine | 10 | 83 | Broken | 82 in 1994 |
| Quincy | 11 | 80 | Broken | 79 in 1999 |
| Plant City | 12 | 90 | Broken | 89 in 1905 |
| Mayport | 12 | 89 | Broken | 85 in 2019 |
| Gainesville | 12 | 86 | Tied | 86 in 2019 |
| Daytona Beach | 12 | 85 | Broken | 84 in 2021 |
| Jacksonville | 12 | 85 | Broken | 84 in 2020 |
| Hastings | 13 | 84 | Broken | 82 in 2021 |
| Ocala | 13 | 89 | Broken | 88 in 1959 |
| Plant City | 13 | 93 | Broken | 88 in 2020 |
| Gainesville | 13 | 89 | Broken | 85 in 2020 |
| Daytona Beach | 13 | 89 | Broken | 86 in 2020 |
| Lakeland | 13 | 90 | Broken | 88 in 2020 |
| Hastings | 14 | 88 | Broken | 78 in 2007 |
| Kissimmee | 14 | 89 | Broken | 87 in 2020 |
| Ochopee | 14 | 90 | Broken | 87 in 2018 |
| Tampa | 15 | 85 | Broken | 84 in 1990 |
| Gainesville | 15 | 86 | Broken | 84 in 2001 |
| Vero Beach | 16 | 85 | Broken | 84 in 2018 |