Prepared by Florida Climate Center
The Florida State University
Tallahassee, FL
Summary:
- Average monthly temperatures in November were above normal.
- Monthly precipitation totals were generally below normal, except in portions of the Panhandle.
- Drought developed in the Panhandle during the month; approximately 16% of the state was in moderate drought (D1) and 52% was abnormally dry (D0) by the end of the month.
- A transition to La Niña conditions is expected soon (57% chance). It is expected to persist through January – March 2025 and will likely be a weak event.
Average monthly temperatures in November were above normal in Florida. Average monthly temperature departures from normal ranged from +1.4 ̊F in Key West to +8.0 ̊F in Tallahassee for the month (see Table 1 and Appendix 1 for select cities). Following a near average October, temperatures in November were well above normal for the month. Monthly mean temperatures were +6-8 ̊F above normal across the Panhandle and North Florida. Apalachicola and Crestview recorded their warmest November on record, while Tallahassee and Pensacola had their 2nd-warmest November on record. In addition, stations across the Peninsula experienced one of their top 10 warmest Novembers on record. There were 187 total daily high minimum temperature records broken during the month; select daily high maximum temperature records tied or broken this month are provided in Appendix 2.
Table 1. November average temperatures and departures from normal ( ̊F) for selected cities.
| Station | Mean Temperature | Departure from Normal |
| Pensacola | 67.5 | +6.1 |
| Tallahassee | 68.2 | +8.0 |
| Jacksonville | 67.8 | +5.5 |
| Orlando | 71.4 | +3.2 |
| Tampa | 73.0 | +3.2 |
| Miami | 76.8 | +2.0 |
| Key West | 78.0 | +1.4 |
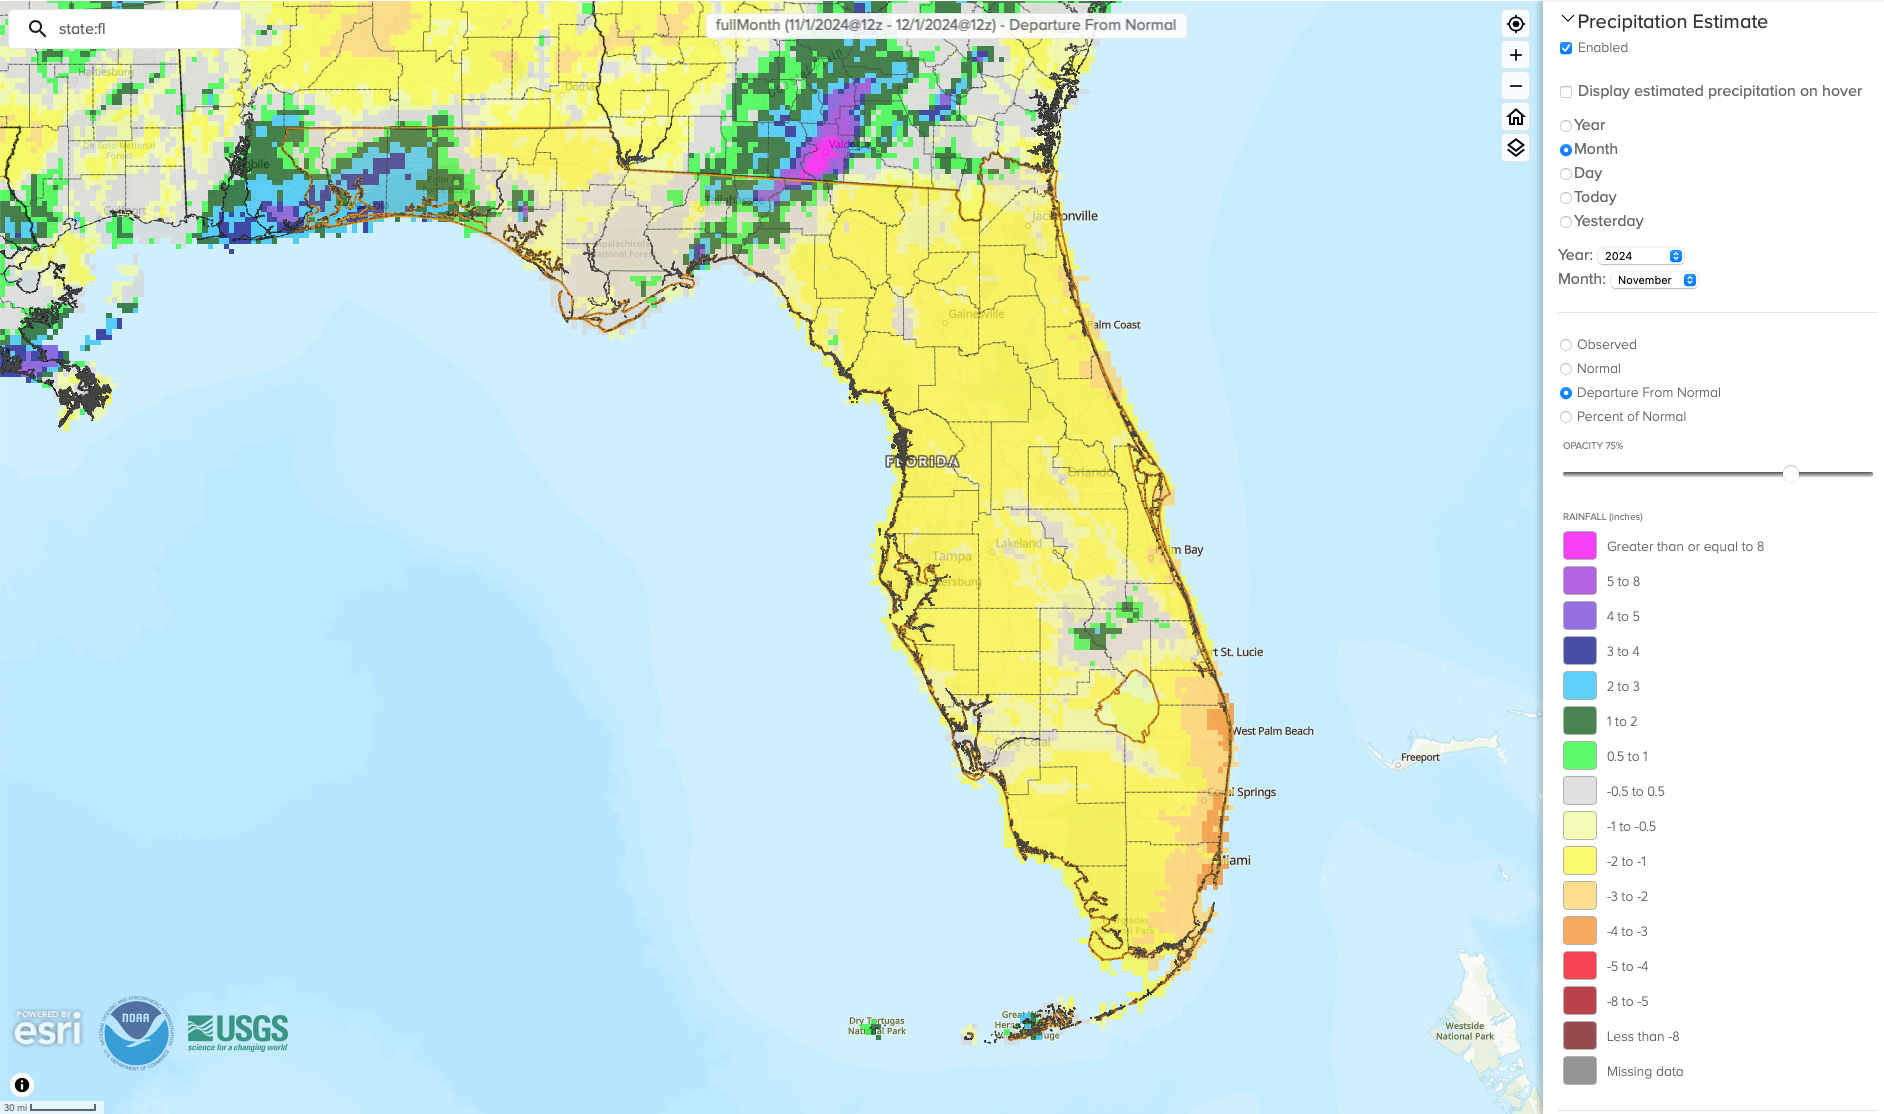
Monthly precipitation totals were generally below normal, with few exceptions that include the western Panhandle and the Keys. The monthly precipitation departures from normal ranged from -3.49 inches in West Palm Beach to +2.21 inches in Pensacola (see Table 2 and Appendix 1 for select locations). While November is typically a dry month in Florida, warmer than normal temperatures and little rainfall led to drought development in the Panhandle and in northeast Florida by the end of the month. Abnormally dry conditions developed in Southeast Florida where rainfall deficits were more than 3 inches (Figure 2).
Table 2. November precipitation totals and departures from normal (inches) for selected cities.
| Station | Total Rainfall | Departure from Normal |
| Pensacola | 6.63 | +2.21 |
| Tallahassee | 2.88 | -0.22 |
| Jacksonville | 1.44 | -0.56 |
| Orlando | 0.60 | -1.19 |
| Tampa | 1.94 | +0.54 |
| Miami | 0.47 | -3.06 |
| Key West | 3.16 | +1.11 |
Figure 1. A graphical depiction of the monthly rainfall departure from normal (inches) for November (courtesy of NOAA, NWS).

La Niña Watch.
ENSO-neutral conditions have continued in the tropical equatorial Pacific Ocean with overall near-average sea surface temperatures in the central and eastern equatorial Pacific Ocean. The latest weekly Niño indices ranged from +0.2 ̊C (Niño-4) to -0.3 ̊C (Niño-3.4). La Niña conditions are expected to emerge soon in December 2024 (now a 57% chance) and persist through January-March 2025. It is favored to be a weak La Niña event, with a less than 25% chance it would be a moderate event (SST anomaly >= 1 ̊C), according to the Climate Prediction Center.
Hazardous Weather Events in November.
According to the Local Storm Reports issued by the local National Weather Service offices serving Florida, there were 53 individual local reports of hazardous weather events recorded across the state during the month of November (see Table 3 for a breakdown by event type). Wind gusts of 40-66 mph were felt in the Keys from the passing of Hurricane Rafael to the south and west. Rafael made landfall in western Cuba on November 6 as a category 3 hurricane. High wind gusts of 40-55 mph were also reported across the Panhandle on November 19-20 associated with a passing frontal boundary.
Table 3. Breakdown of storm reports submitted in Florida during the month of November (compiled from Iowa State University/Iowa Environmental Mesonet).
| Report Type | Number of Reports |
| Heavy Rain | 1 |
| Flood | 0 |
| Flash Flood | 0 |
| Coastal Flood | 1 |
| Marine Thunderstorm Wind | 15 |
| Non-Thunderstorm Wind Gust | 18 |
| Non-Thunderstorm Wind Damage | 1 |
| Tornado/Waterspout/Funnel Cloud | 0/0/0 |
| Thunderstorm Wind Damage | 0 |
| Thunderstorm Wind Gust | 0 |
| Tropical Cylone | 15 |
| Storm Surge | 0 |
| Rip Currents | 2 |
Daily Record Events in November.
Table 4. Summary of daily records broken or set in Florida in November (source: NCEI Daily Weather Records).
| Category | Number of Records |
| Highest daily max. temp. | 31 |
| Highest daily min. temp. | 187 |
| Lowest daily max. temp. | 0 |
| Lowest daily min. temp. | 0 |
| Highest daily precipitation | 15 |
| Total | 233 |
Drought-Related Impacts.
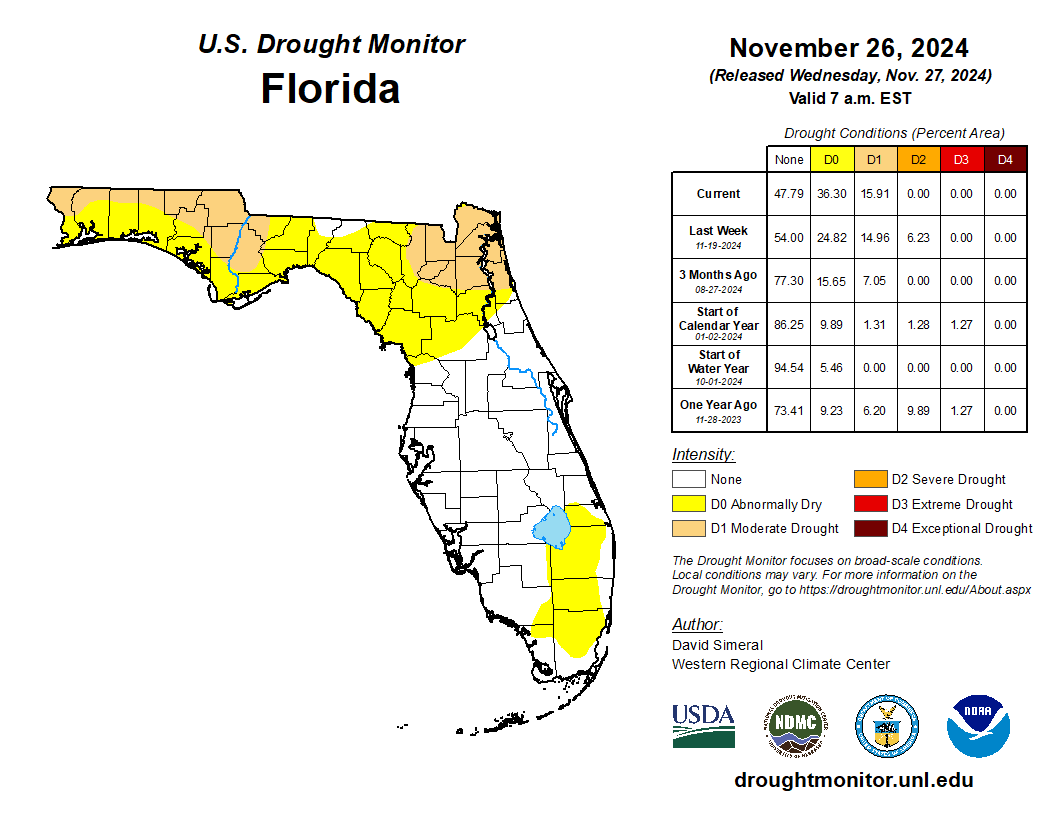
In mid-November, about 1.6% of the state was in severe drought (D2), 16% was in moderate drought (D1), and about 25% was abnormally dry (D0), according to the U.S. Drought Monitor. By the end of the month, moderate drought (D1) affected about 16% of the state and 36% of the state was abnormally dry (D0) (Figure 2 below).
As of November 30, the Lake Okeechobee water level was 15.78 ft. above sea level (Feet-NGVD29), which is above average for this time of year. At the first of the month, the water level was 16.10 ft. above sea level.
Figure 2. A graphical depiction of the latest drought conditions in Florida according to the U.S. Drought Monitor (courtesy of the National Drought Mitigation Center, University of Nebraska-Lincoln).

Agriculture-Related Impacts.
Following tropical rainfall earlier in the season, drying conditions set in and persisted during the month of November. In mid-November, topsoil moisture conditions were adequate in 62% of the state, short in 25%, and very short in 10% of the state, while 3% of the state had surplus topsoil moisture conditions. Near the end of November, topsoil moisture conditions were adequate in 57% of the state, short in 30%, and very short in 10% of the state, while 3% had surplus topsoil moisture conditions. For more information, consult the Crop Progress and Conditions report, which is published by the USDA’s National Agricultural Statistics Service.
Appendix 1
Additional November departures from normal data for select Florida locations (Source: NWS).
| Station | Average Temperature (˚F) | Departure from Normal (˚F) | Total Rainfall (in.) | Departure from Normal (in.) |
| Gainesville | 66.6 | +3.9 | 0.17 | -1.62 |
| Sarasota | 72.8 | +2.7 | 0.13 | -1.68 |
| Melbourne | 71.4 | +2.4 | 1.42 | -1.113 |
| Fort Myers | 74.0 | +2.5 | 2.20 | +0.42 |
| West Palm Beach | 75.0 | +2.0 | 0.13 | -3.49 |
Appendix 2
Select daily record high maximum temperatures (°F) tied or broken during November 2024 (compiled from NOAA).
| Location | Date | Record | Broken/Tied | Last |
| Tallahassee | 1 | 88 | Tied | 88 in 2016 |
| Venice | 3 | 89 | Tied | 89 in 2022 |
| Tampa | 3 | 88 | Tied | 88 in 2022 |
| Tallahassee | 5 | 89 | Broken | 88 in 2015 |
| Chipley | 6 | 87 | Broken | 86 in 2015 |
| Tarpon Springs | 6 | 91 | Broken | 90 in 1935 |
| Tampa | 6 | 91 | Broken | 90 in 2015 |
| Apalachicola | 7 | 85 | Broken | 84 in 2003 |
| Bradenton | 7 | 90 | Tied | 90 in 1996 |
| Fernandina Beach | 7 | 88 | Broken | 85 in 2003 |
| Jacksonville | 7 | 87 | Tied | 87 in 2003 |
| Cross City | 8 | 89 | Broken | 87 in 2003 |
| Tampa | 8 | 89 | Broken | 88 in 2015 |
| Cross City | 11 | 89 | Broken | 86 in 1986 |
| Niceville | 11 | 84 | Broken | 83 in 2020 |
| Ochopee | 11 | 92 | Broken | 91 in 2015 |
| Clermont | 12 | 89 | Tied | 89 in 2023 |
| Venice | 12 | 89 | Tied | 89 in 2023 |
| Tampa | 12 | 89 | Broken | 88 in 2023 |
| Fernandina Beach | 13 | 85 | Broken | 84 in 2008 |
| Tallahassee | 13 | 85 | Broken | 83 in 2005 |
| Fernandina Beach | 15 | 86 | Broken | 84 in 1955 |
| Pensacola | 18 | 82 | Broken | 80 in 2021 |
| Fernandina Beach | 21 | 89 | Broken | 83 in 1962 |
| Fort Lauderdale | 22 | 86 | Broken | 85 in 2015 |
| Fernandina Beach | 23 | 88 | Broken | 85 in 1948 |
| Crestview | 25 | 81 | Broken | 80 in 2001 |
| Homestead | 30 | 90 | Broken | 88 in 1997 |


