Prepared by Florida Climate Center
The Florida State University
Tallahassee, FL
Key Points:
- January average temperatures were above normal statewide for the month.
- Monthly precipitation totals were below normal for the month.
- Drought conditions improved in the Panhandle during the month but persisted in the Big Bend region; the Peninsula became abnormally dry by month’s end.
- La Niña conditions in the equatorial Pacific Ocean weakened, and a transition to ENSO-neutral is expected over the next couple of months.
Average monthly temperatures in January were above normal across the state. Average temperature departures from normal ranged from +1.3 ̊F in Melbourne to +6.8 ̊F in Pensacola for the month (see Table 1 and Appendix 1 for select cities). Following a cold end to December, mean average temperatures in January were well above normal during the beginning of the month. During the first week, departures from normal ranged from +5 ̊F in south Florida to +13 ̊F in the western Panhandle. Select daily high maximum temperature records tied or broken during the month are provided in Appendix 2.
Table 1. January average temperatures and departures from normal ( ̊F) for selected cities.
| Station | Mean Temperature | Departure from Normal |
| Pensacola | 60.0 | +6.8 |
| Tallahassee | 57.5 | +5.3 |
| Jacksonville | 58.0 | +3.8 |
| Orlando | 64.4 | +3.8 |
| Tampa | 64.6 | +2.6 |
| Miami | 72.1 | +3.5 |
| Key West | 72.6 | +2.0 |
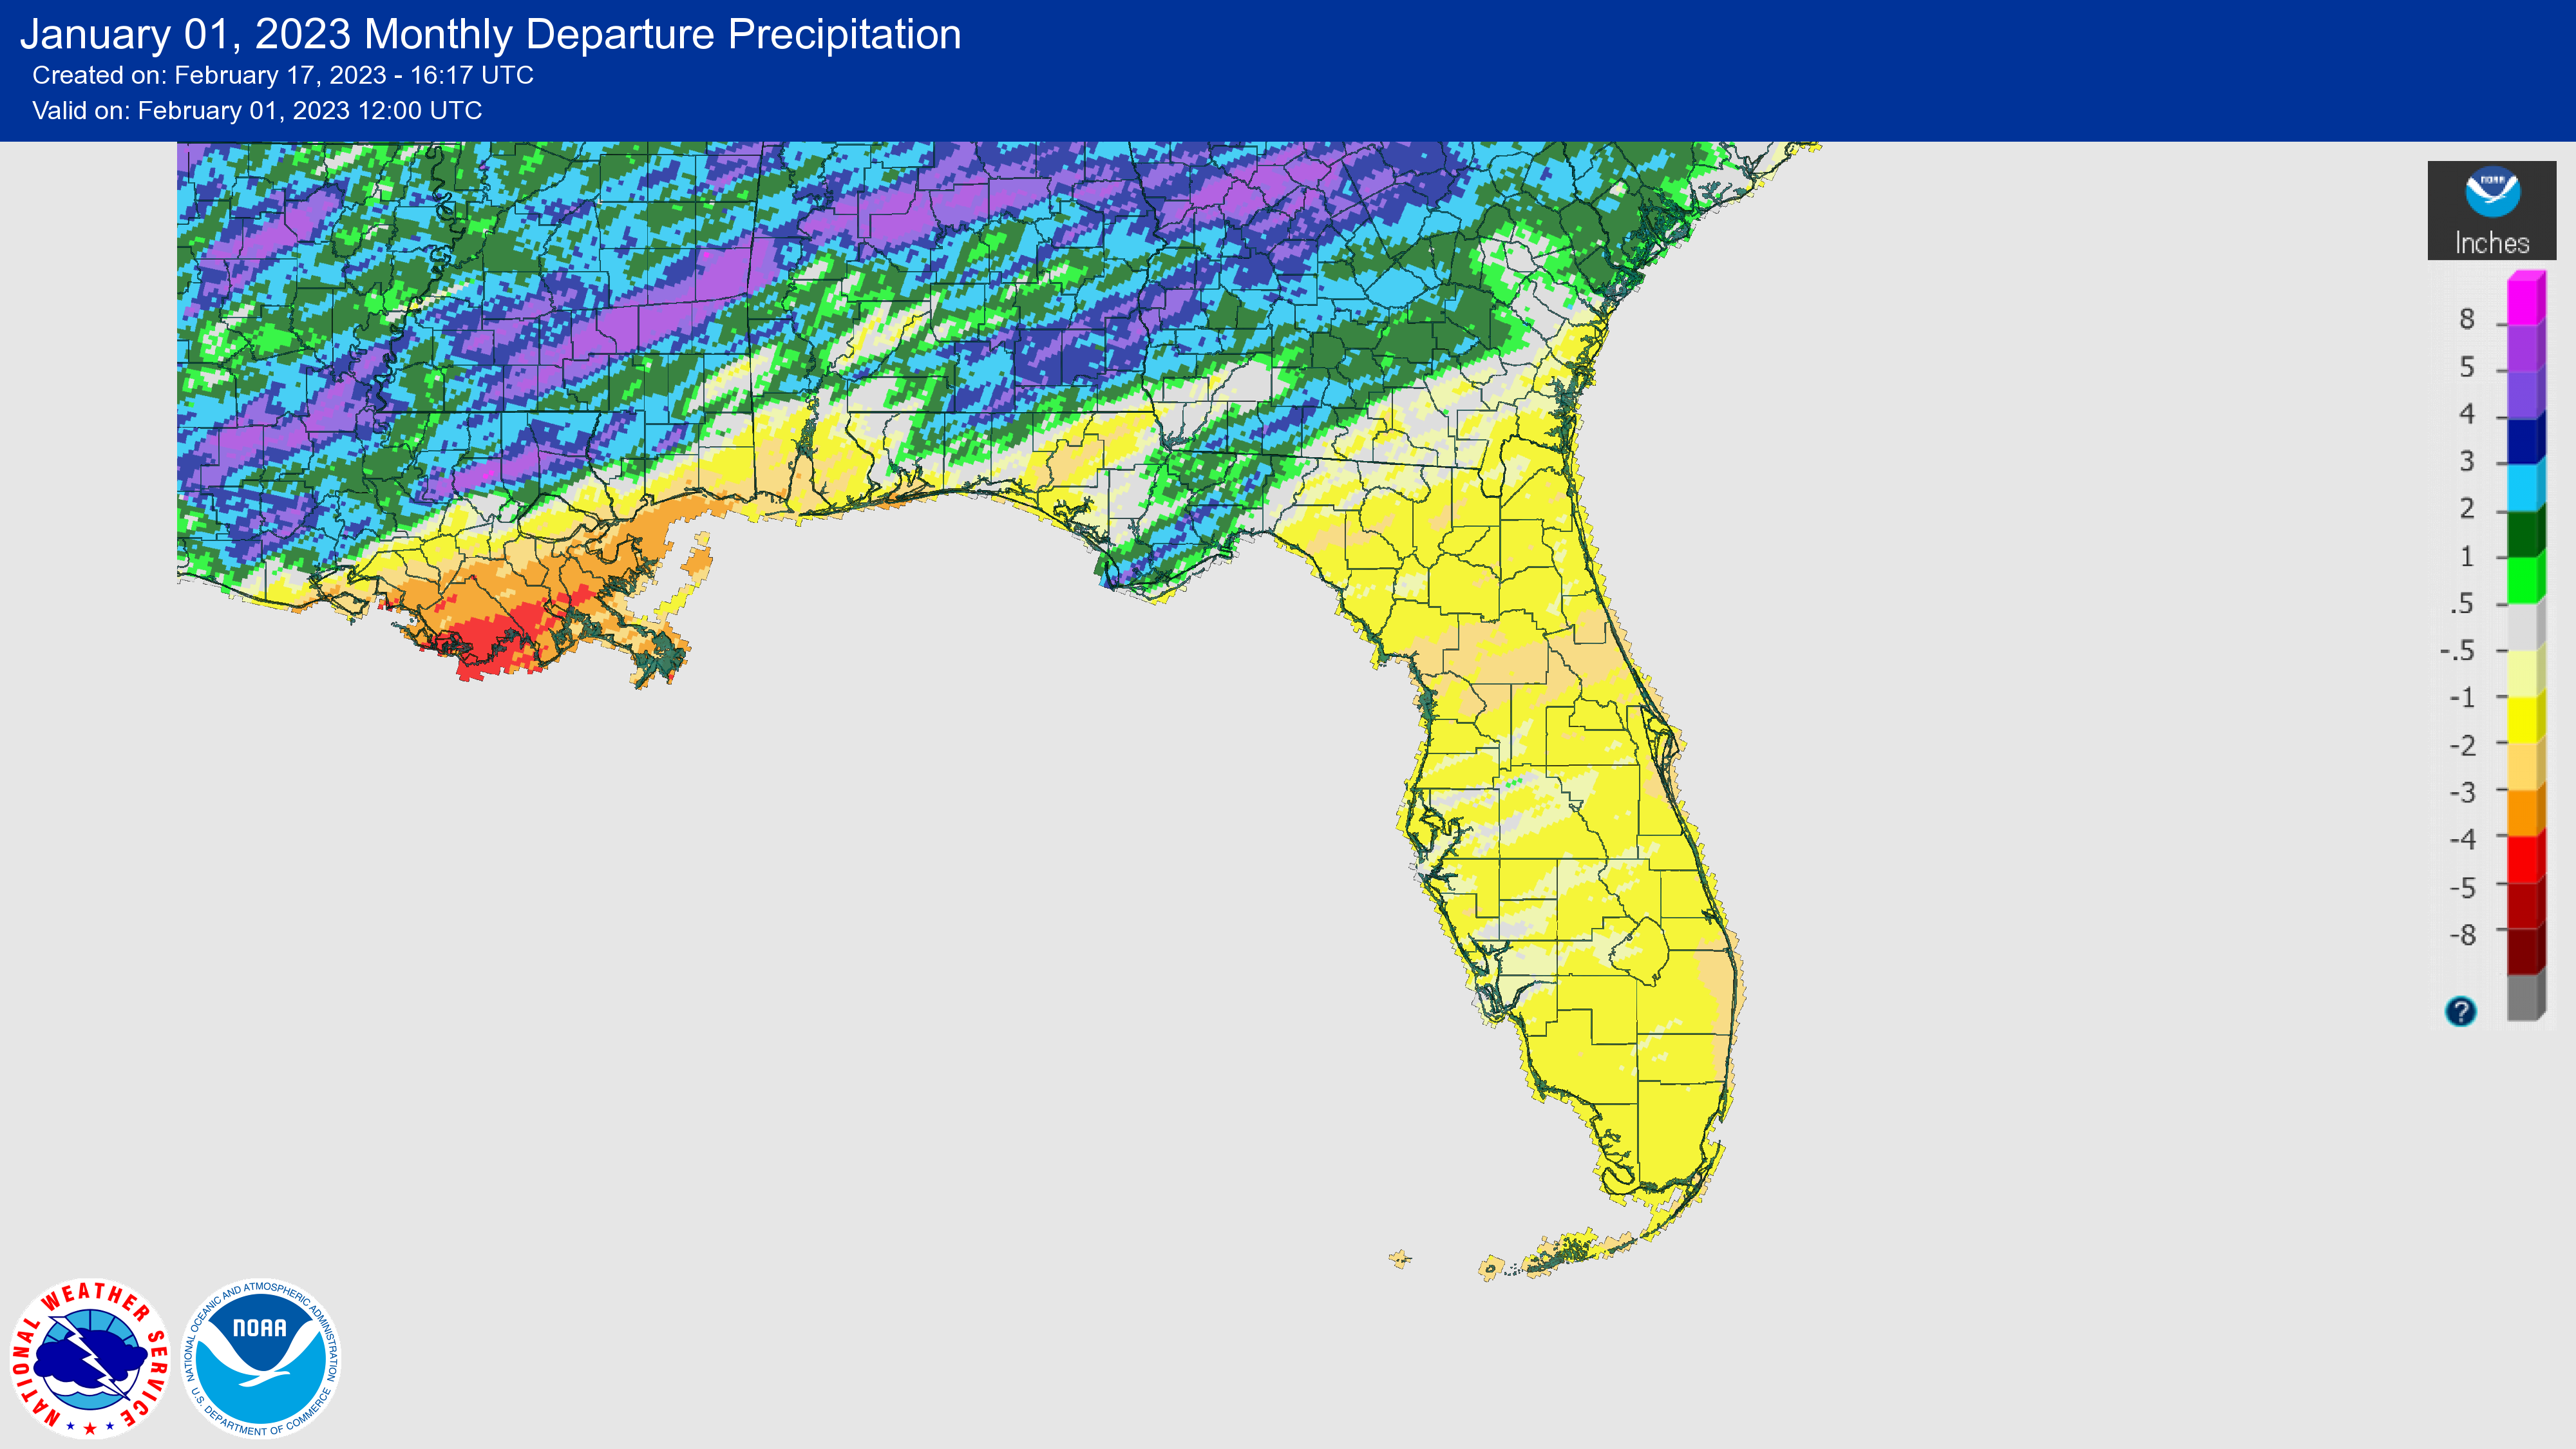
January was generally dry, with monthly rainfall totals below normal for much of the state. The monthly precipitation departures from normal ranged from -3.26 inches in West Palm Beach to +2.27 inches in Tallahassee (see Table 2 and Appendix 1 for additional locations). The Tallahassee and Apalachicola areas picked up several inches of rain toward the end of the month, which helped to alleviate drought in this area, but generally most places were dry and, as a result, abnormally dry conditions appeared over much of the Peninsula by the end of the month.
Table 2. January precipitation totals and departures from normal (inches) for selected cities.
| Station | Total Rainfall | Departure from Normal |
| Pensacola | 4.03 | -1.00 |
| Tallahassee | 6.68 | +2.27 |
| Jacksonville | 2.18 | -1.10 |
| Orlando | 1.01 | -1.47 |
| Tampa | 1.55 | -1.10 |
| Miami | 0.05 | -1.78 |
| Key West | 0.08 | -1.75 |
Figure 1. A graphical depiction of the monthly rainfall departure from normal (inches) for January (courtesy of NOAA, NWS).

La Niña Continues but Weakens.
A weak La Niña was still in place throughout the month of January with signs of weakening. Sea surface temperatures in the eastern equatorial Pacific Ocean were not as cold as they have been, with the latest Niño index values generally near -0.5°C, and sub-surface temperatures warmed too. There is forecaster consensus that La Niña is expected to continue to weaken, with a transition to ENSO-neutral over the next couple of months. ENSO-neutral is expected to then persist through the Northern Hemisphere spring and early summer. There are increasing chances of El Niño at longer forecast horizons, though large uncertainty remains.
Hazardous Weather Events in January.
According to the Local Storm Reports issued by the local National Weather Service offices serving Florida, there were 140 individual local reports of hazardous weather events recorded across the state during the month of January (see Table 4 for a breakdown by event type). No major impacts were reported.
Table 4. Breakdown of storm reports submitted in Florida during the month of January (compiled from Iowa State University/Iowa Environmental Mesonet).
| Report Type | Number of Reports |
| Heavy Rain | 0 |
| Flood | 0 |
| Coastal Flood | 0 |
| Hail | 2 |
| Marine Thunderstorm Wind | 35 |
| Non-Thunderstorm Wind Gust | 22 |
| Non-Thunderstorm Wind Damage | 1 |
| Tornado/Waterspout/Funnel Cloud | 6/0/2 |
| Thunderstorm Wind Damage | 27 |
| Thunderstorm Wind Gust | 43 |
| Rip Currents | 0 |
| Wildfire | 2 |
Daily Record Events in January.
Table 5.Summary of daily records broken or set in Florida in January (source: NCEI Daily Weather Records).
| Category | Number of Records |
| Highest daily max. temp. | 69 |
| Highest daily min. temp. | 39 |
| Lowest daily max. temp. | 6 |
| Lowest daily min. temp. | 3 |
| Highest daily precipitation | 6 |
| Total | 123 |
Weather/Climate Highlight of the Month:
January temperatures were above average, and the statewide monthly average maximum temperature ranked 12th-warmest on record. Many daily high maximum temperature records were broken during the month. Key West reached a high of 90 ̊F several times during the month, including on the 23rd, 25th and 31st, which shattered previous records of 83 ̊F, 82 ̊F and 83 ̊F set on this day in 1973, 2012 and 1946, respectively.
Drought-Related Impacts.
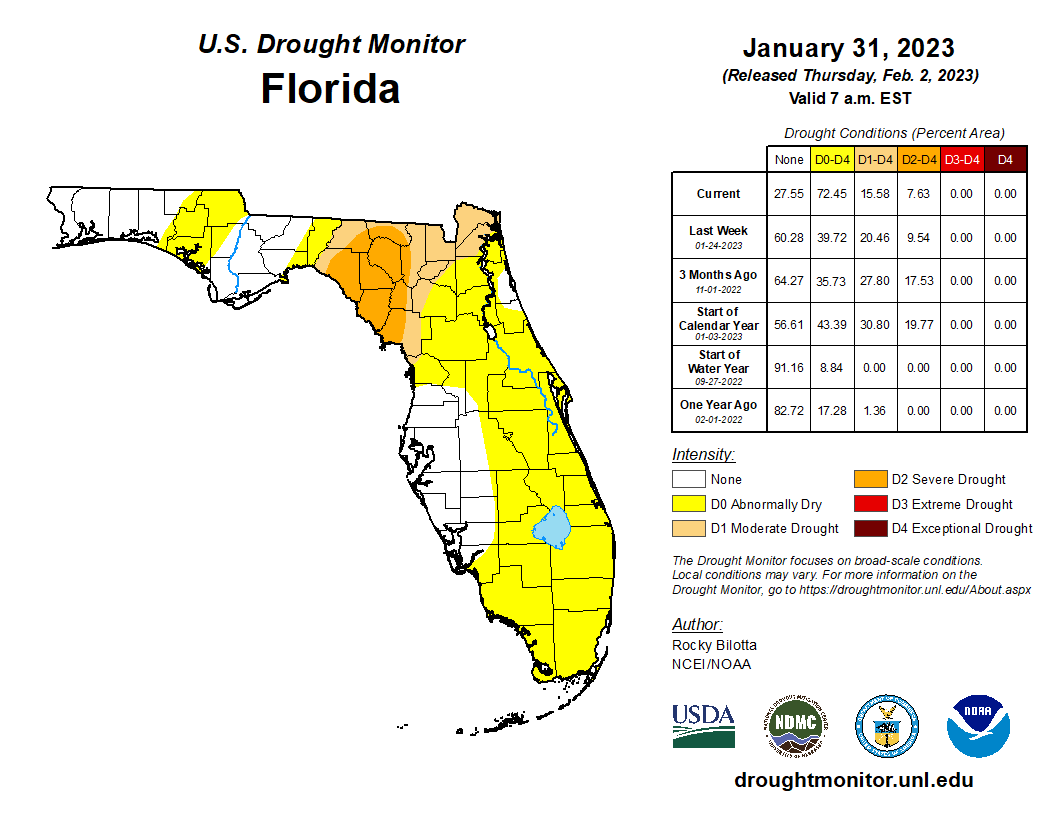
By the middle of January, severe drought (D2) affected the eastern Panhandle and Big Bend regions. About 16% of the state was in severe drought (D2), 13% was in moderate drought (D1), and 13% was abnormally dry, according to the U.S. Drought Monitor. By the end of the month, drought was removed in the Panhandle, but 8% of the state remained in severe drought (D2), 8% was in moderate drought (D1), and 57% was abnormally dry (Figure 2 below).
As of January 31, the Lake Okeechobee water level was 16.02 ft. above sea level (Feet-NGVD29), which is above average for this time of the year. At the first of the month, the water level was 16.36 ft. above sea level.
Figure 2. A graphical depiction of the current drought conditions in Florida according to the U.S. Drought Monitor (courtesy of the National Drought Mitigation Center, University of Nebraska-Lincoln).

Agriculture-Related Impacts.
During the month of January, Florida pasture conditions remained mostly fair to good but cold spells and lack of rainfall in the southern half of the State did hurt some pastures with reports of bleaching and frost. Livestock remained in mostly fair to good condition. Sugarcane planting and harvest progressed well, while citrus activities included the removal of dead trees and other maintenance activities. Several vegetable crops were planted and harvested, such as green beans, yellow squash, potatoes, sweet corn, pepper, and avocado. Preparation for rice planting also began during the latter part of the month. For more information, consult the Crop Progress - State Stories reports, which are produced monthly December through March by the USDA’s National Agricultural Statistics Service.
Appendix 1
Additional January departures from normal data for select Florida locations (Source: NWS).
| Station | Average Temperature (˚F) | Departure from Normal (˚F) | Total Rainfall (in.) | Departure from Normal (in.) |
| Gainesville | 58.5 | +3.7 | 1.65 | -1.64 |
| Sarasota | 64.3 | +1.9 | 1.43 | -1.36 |
| Melbourne | 64.6 | +1.3 | 0.43 | -2.20 |
| Fort Myers | 68.9 | +4.2 | 1.33 | -1.10 |
| West Palm Beach | 69.8 | +3.5 | 0.21 | -3.26 |
Appendix 2
Select daily record high maximum temperatures (°F) broken or tied during January (compiled from NOAA).
| Location | Date | Record | Broken/Tied | Last |
| Stuart | 1 | 86 | Broken | 85 in 2022 |
| Niceville | 2 | 79 | Broken | 78 in 1975 |
| Pensacola | 2 | 79 | Broken | 74 in 2009 |
| Key West | 2 | 90 | Broken | 86 in 2022 |
| Cross City | 3 | 82 | Broken | 81 in 2015 |
| Deland | 3 | 85 | Tied | 85 in 1907 |
| Pensacola | 3 | 81 | Broken | 79 in 2020 |
| Hastings | 4 | 83 | Broken | 82 in 2015 |
| Crestview | 4 | 79 | Broken | 77 in 1997 |
| Sanford | 5 | 86 | Broken | 84 in 2015 |
| Miami | 5 | 86 | Broken | 84 in 2015 |
| West Palm Beach | 5 | 86 | Broken | 84 in 1972 |
| Key West | 8 | 88 | Broken | 85 in 2022 |
| Marianna | 12 | 80 | Broken | 79 in 2017 |
| Crestview | 17 | 80 | Tied | 80 in 2017 |
| Pensacola | 17 | 80 | Broken | 78 in 2017 |
| Jacksonville Beach | 19 | 83 | Broken | 82 in 2001 |
| Plant City | 19 | 85 | Tied | 85 in 2001 |
| Key West | 19 | 88 | Broken | 82 in 2020 |
| Jacksonville | 19 | 84 | Broken | 83 in 2001 |
| Tallahassee | 19 | 84 | Broken | 79 in 2001 |
| Mayport | 22 | 83 | Broken | 80 in 2017 |
| Key West | 22 | 89 | Broken | 84 in 2017 |
| Hialeah | 23 | 85 | Broken | 84 in 2017 |
| Miami | 23 | 88 | Broken | 85 in 2007 |
| Key West | 23 | 90 | Broken | 83 in 1973 |
| Perrine | 24 | 86 | Broken | 84 in 2018 |
| Plant City | 25 | 88 | Broken | 86 in 1898 |
| Orlando | 25 | 86 | Broken | 85 in 1990 |
| Gainesville | 25 | 82 | Broken | 81 in 1990 |
| Vero Beach | 25 | 86 | Broken | 84 in 2002 |
| Key West | 25 | 90 | Broken | 82 in 2012 |
| Clermont | 26 | 87 | Broken | 84 in 1962 |
| Daytona Beach | 26 | 84 | Broken | 82 in 1965 |
| Key West | 28 | 89 | Broken | 83 in 1997 |
| Miles City | 29 | 87 | Tied | 87 in 1990 |
| Key West | 29 | 88 | Broken | 84 in 1997 |
| Jacksonville Beach | 30 | 88 | Broken | 83 in 1991 |
| Gainesville | 30 | 86 | Broken | 84 in 2013 |
| Crestview | 30 | 83 | Broken | 78 in 2013 |
| Tallahassee | 30 | 83 | Tied | 83 in 1957 |
| Jacksonville | 30 | 87 | Broken | 85 in 2013 |
| Jacksonville Beach | 31 | 88 | Broken | 85 in 1985 |
| Gainesville | 31 | 85 | Broken | 83 in 1985 |
| Key West | 31 | 90 | Broken | 83 in 1946 |


